
 Open Access Article
 This Open Access Article is licensed under a
 Creative Commons Attribution 3.0 Unported Licence
Naphthalimide–coumarin conjugate: ratiometric fluorescent receptor for self-calibrating quantification of cyanide anions in cells†
Yasuhiro Shiraishi *ab,
Naoto Hayashia,
Masaki Nakahatac,
Shinji Sakaic and
Takayuki Hiraia
*ab,
Naoto Hayashia,
Masaki Nakahatac,
Shinji Sakaic and
Takayuki Hiraia
aResearch Center for Solar Energy Chemistry, Division of Chemical Engineering, Graduate School of Engineering Science, Osaka University, Toyonaka 560-8531, Japan. E-mail: shiraish@cheng.es.osaka-u.ac.jp
bPrecursory Research for Embryonic Science and Technology (PRESTO), Japan Science and Technology Agency (JST), Saitama 332-0012, Japan
cDivision of Chemical Engineering, Graduate School of Engineering Science, Osaka University, Toyonaka 560-8531, Japan
First published on 23rd June 2017
Abstract
Quantitative determination of toxic cyanide anions (CN−) in biological samples is an important subject. We synthesized a naphthalimide–coumarin conjugate with a simple imine linker (1), which behaves as a fluorescent receptor for ratiometric quantification of CN−. It exhibits green naphthalimide fluorescence at 533 nm, originating from the excited-state intramolecular charge transfer (ESICT) from coumarin to naphthalimide fluorophores. Selective CN− addition to the imine linker affords an α-amino nitrile product. This suppresses ESICT and creates coumarin fluorescence at 444 nm and naphthalimide fluorescence at 533 nm originating from direct photoexcitation of the respective fluorophores. The emission intensity at 533 nm is maintained upon CN− addition and can be used as an internal standard for analysis. This ratiometric response enables self-calibrating CN− quantification based on the intensities of two emissions in solution and in cells. This facilitates rapid (within 3 min), selective, and sensitive ratiometric detection of very low levels of CN− (>1.8 μM).
Introduction
The cyanide anion (CN−) is very toxic1 and its binding to cytochrome units causes paralysis of cellular respiration2 and significant damage to the nervous system.3 Absorption of a very small amount of CN−, as little as 0.5–3.5 mg per kilogram of body weight, is enough to cause human death.4 Cyanides are, however, versatile reagents for synthesis5 and metallurgy.6 This often causes a release of CN− into the environment. The World Health Organization (WHO) therefore sets the maximum permissive level of cyanide in drinking water at 1.9 μM.7 Quantitative determination of CN− in environmental and biological samples by simple and rapid pretreatment and inexpensive instrumentation is a challenge.Fluorometric analysis with a CN−-selective receptor is one promising method for this purpose because it facilitates simple quantification of CN− with a common fluorescence spectrometer. So far, a variety of off–on type fluorescent CN− receptors have been proposed;8 however, many of them show single-wavelength fluorescence and its intensity is used for quantification. The emission intensity is strongly affected by several factors such as instruments and receptor concentration; therefore, tedious calibration procedure is necessary on the respective instruments. In contrast, ratiometric receptor, which shows a new fluorescence in addition to the inherent one by the interaction with CN−, allow quantification just by monitoring the intensities of two emissions, where the effects of instruments and receptor concentration can be eliminated. Some ratiometric CN− receptors, which can be used in bulk solution, have been proposed;9 however, to the best of our knowledge, none of the receptor facilitates ratiometric CN− quantification in cells.
Here we report a first example of a fluorescent CN− receptor enabling ratiometric quantification in cells. Our strategy for the receptor design is a simple π-conjugation of two fluorophores with donor and acceptor characters, respectively, which are in the excited-state intramolecular charge transfer (ESICT). As shown in Scheme 1, a naphthalimide–coumarin conjugate with a simple imine linker (1), when dissolved in neutral media, exhibits a green naphthalimide fluorescence at 533 nm via ESICT. CN− addition to the imine moiety suppresses ESICT and allows direct photoexcitation of the respective fluorophores, creating a coumarin fluorescence at 444 nm and a naphthalimide fluorescence at 533 nm. The 533 nm emission maintains its intensity. This facilitates ratiometric quantification of CN− in solution and cells based on the intensity of 533 nm emission as an internal standard.10 This allows rapid (3 min), selective, and sensitive detection of CN− as low as 1.8 μM, lower than the permissive level in drinking water set by WHO.
 | ||
| Scheme 1 Proposed mechanism for ratiometric fluorescence response of the receptor 1 upon reaction with CN−. | ||
Results and discussion
Synthesis and fluorescence properties
The receptor 1 was synthesized by the procedure depicted in Scheme 2. 4-Amino-N-butyl-1,8-naphthalimide11 and 8-formyl-7-hydroxy-4-methylcoumarin12 were dissolved in EtOH, and the solution was stirred at 80 °C for 4 h. The solid formed was recovered by filtration and washed thoroughly with EtOH and CH2Cl2, affording 1 as orange solids with 14% yield. The purity of 1 was confirmed by 1H NMR, 13C NMR, and FAB-MS analysis (Fig. S1–S3, ESI†).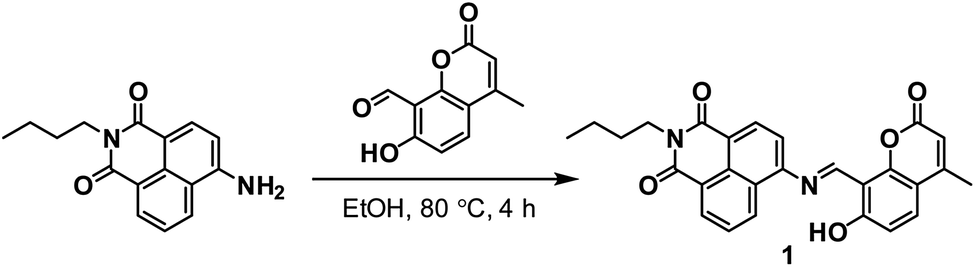 | ||
| Scheme 2 Synthesis of the receptor 1. | ||
1 (10 μM) was dissolved in a buffered water/MeCN mixture (1/1 v/v) with pH 7.0 (HEPES 0.1 M) and subjected for fluorescence measurements at 25 °C. As shown in Fig. 1a (green line), 1, when photoexcited at 385 nm, shows a green fluorescence centered at 533 nm with fluorescence quantum yield (ΦF) = 0.16. Addition of 200 equiv. of CN− (as n-Bu4N+ salt) to this solution followed by stirring for 5 min (blue line) creates a new emission at 444 nm (ΦF = 0.05) while maintaining the intensity of the 533 nm emission (ΦF = 0.17). It is noted that addition of other nucleophiles scarcely changes the spectrum, indicating that CN− selectively creates the 444 nm emission. It is also noted that, as shown in Fig. 1b, the 444 nm emission enhanced selectively by CN− is unaffected by the other nucleophiles. This clearly suggests that 1 selectively detects CN− even in the presence of these contaminants.
 | ||
| Fig. 1 (a) Fluorescence spectra (λex = 385 nm) of 1 (10 μM) with 200 equiv. of each nucleophile in a buffered water/MeCN mixture (1/1 v/v; HEPES 0.1 M, pH 7.0) at 25 °C. (b) Intensity obtained (black) with 200 equiv. of each nucleophile and (white) 200 equiv. of CN− and other nucleophiles. | ||
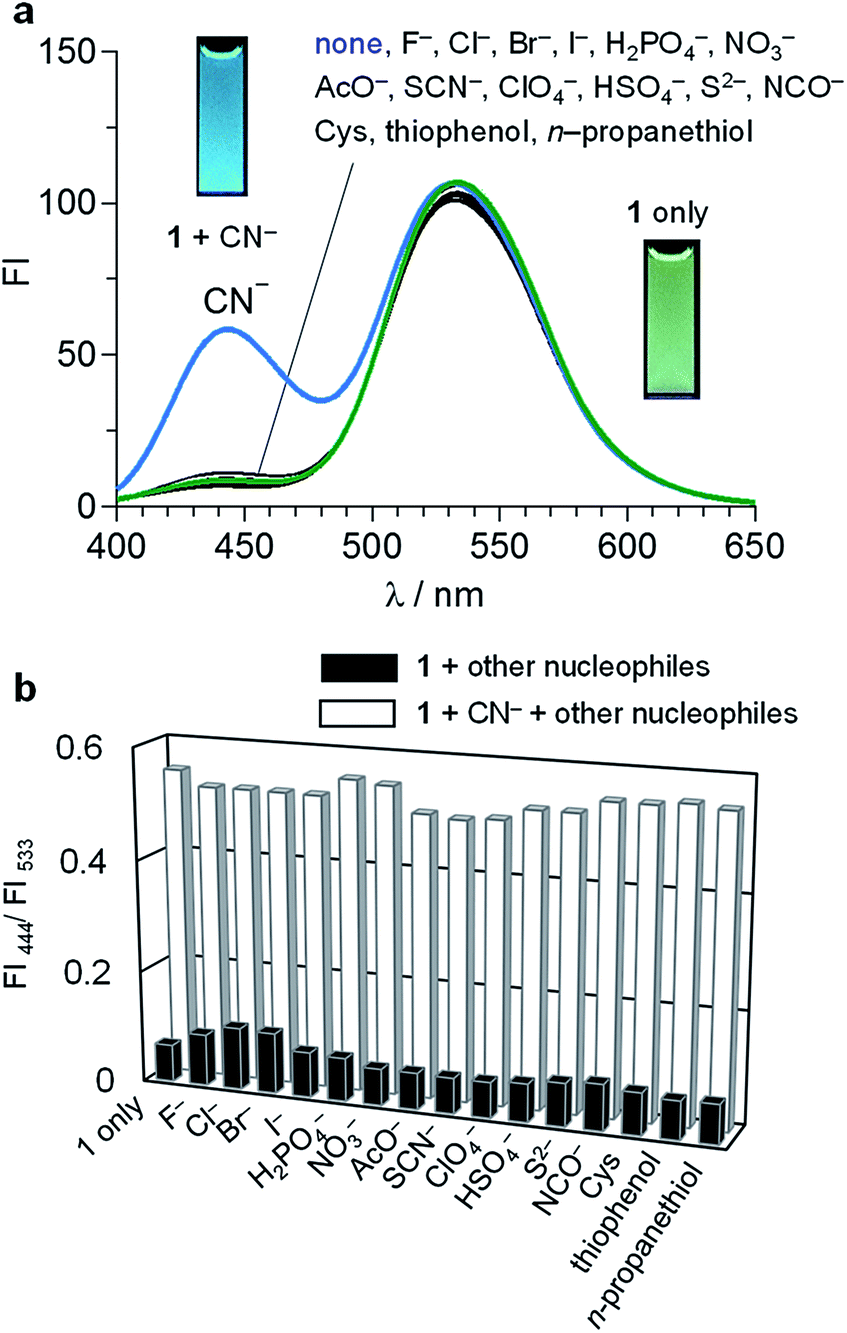
Fig. 2 (top) shows the change in fluorescence spectra of 1 at pH 7.0 with CN− concentrations. Stepwise addition of CN− increases the intensity of the 444 nm fluorescence, while maintaining the intensity of the 533 nm fluorescence. As shown in Fig. 2 (bottom), plots of the ratio of fluorescence intensities (FI444/FI533) versus the CN− concentrations show linear relationship, indicating that 1 allows accurate CN− sensing at ∼4000 μM. The detection limit is determined to be 1.8 μM based on the signal-to-noise (S/N) ratio using the equation (DL = 3 × SD/S),13 where SD is the standard deviation of blank analysis (SD = 2.77 × 10⁻⁴, n = 10) and S is the slope of the intensity versus the CN− concentrations (S = 4.47 × 10⁻⁴ μM−1). This detection limit is lower than the maximum permissive level of cyanide in drinking water (1.9 μM) set by WHO,7 although the present method cannot use pure water due to the low solubility of the receptor and requires a water/MeCN (1![[thin space (1/6-em)]](https://www.rsc.org/images/entities/char_2009.gif) :1) mixture for the analysis. Nevertheless, the receptor 1 facilitates sensitive CN− detection by ratiometric analysis. It must also be noted that 1 detects CN− very rapidly. Fig. S4 (ESI†) shows the time course of the fluorescence intensity of 1 after addition of CN−. The intensity increases immediately after the CN− addition and almost terminates within 3 min, suggesting that only 3 min assay facilitates CN− sensing.
:1) mixture for the analysis. Nevertheless, the receptor 1 facilitates sensitive CN− detection by ratiometric analysis. It must also be noted that 1 detects CN− very rapidly. Fig. S4 (ESI†) shows the time course of the fluorescence intensity of 1 after addition of CN−. The intensity increases immediately after the CN− addition and almost terminates within 3 min, suggesting that only 3 min assay facilitates CN− sensing.
 | ||
| Fig. 2 Change in (top) fluorescence spectra (λex = 385 nm) and (bottom) the ratio of fluorescence intensity (FI444/FI533) of 1 (10 μM) with CN− concentration, measured in a buffered water/MeCN mixture (1/1 v/v; HEPES 0.1 M, pH 7.0) at 25 °C. The right figures show the enlarged images of the left figures. | ||
Mechanism for reaction with CN−
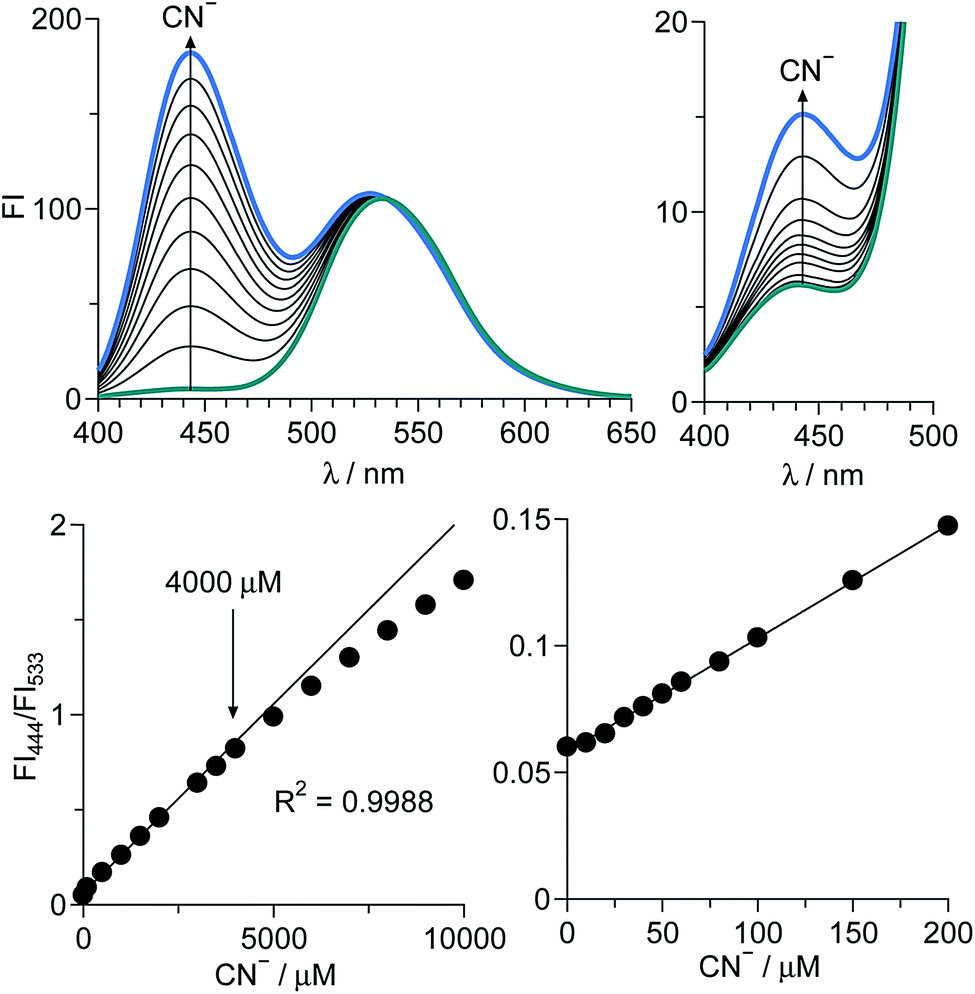
As summarized in Scheme 1, the CN−-induced enhancement of the 444 nm emission for 1 is triggered by the addition of HCN to the imine moiety of 1′ species, the deprotonated form of 1, producing [1′–HCN]− species. At pH > 7, 1 undergoes deprotonation of its –OH group since pKa of 7-hydroxycoumarin moiety is 7.8.14 The deprotonated 1′ reacts with HCN,15 and gives an α-amino nitrile product [1′–HCN]−. The HCN addition is confirmed by fluorescence analysis of 1 with CN− at different pH. As shown in Fig. S5 (ESI†), the fluorescence enhancement of 1 by CN− is very small at pH > 10. This suggests that deprotonation of HCN (HCN + OH− ↔ H2O + CN−; pKa = 9.2) suppresses the HCN addition to 1′, clearly supporting the reaction mechanism in Scheme 1.The HCN addition to the imine moiety of 1′, producing the [1′–HCN]− species, is confirmed by NMR analysis. 1H NMR charts of 1 and [1′–HCN]− were shown in Fig. 3, where the 2D COSY spectra were used for the assignment of the respective chemical shifts (Fig. S6 and S7, ESI†). As shown in Fig. 3a, 1 measured in DMSO-d6 shows imine Ha proton at 9.5 ppm. As shown in Fig. 3b, the [1′–HCN]− species shows significant upfield shift of the Ha proton (6.1 ppm). This suggests that the imine moiety of 1′ reacts with HCN. As shown in Fig. 4, 13C NMR charts of 1 also show upfield shift of the imine CH carbon (160 ppm → 42 ppm) by the reaction with HCN and creates a new peak for the –CN carbon at 119 ppm. This further supports the HCN addition to the imine moiety. The 1:1 reaction of 1′ with HCN is confirmed by FAB-MS analysis. As shown in Fig. S8 (ESI†), the product shows a peak at m/z 481.2 attributable to the [1′ + HCN]− species. The result strongly supports the 1:1 reaction between 1′ and HCN.
 | ||
| Fig. 3 1H NMR chart of 1 (10 mM) measured (a) without and (b) with 1 equiv. of CN− (400 MHz, 30 °C, DMSO-d6). | ||
 | ||
| Fig. 4 13C NMR chart of (a) 1 and (b) 1 with 1 equiv. of CN− (100 MHz, 30 °C, CDCl3). | ||
Mechanism for fluorometric response
The ratiometric fluorescence response of 1 upon CN− addition can be explained by the mechanism summarized in Scheme 1. Without CN−, the deprotonated 1′ shows the 533 nm fluorescence from the excited-state naphthalimide moiety, formed by the excited-state intramolecular charge transfer (ESICT) from the coumarin to naphthalimide moiety. In contrast, the formation of [1′–HCN]− by the HCN addition to the imine moiety of 1′ leads to a cleavage of the π-conjugation between the coumarin and naphthalimide moieties and suppresses ESICT. This thus creates two emissions from the directly photoexcited coumarin and naphthalimide moieties, respectively. Ab initio calculations based on the time-dependent density functional theory (TDDFT)16 confirm the mechanism. As shown in Table S1 (ESI†), singlet electronic transition of 1′ is mainly contributed by HOMO−2 → LUMO (S0 → S3) transition. Its energy (2.99 eV, 415 nm) is similar to the observed λmax (425 nm) of the absorption spectrum of 1′ (Fig. S9, ESI†). As summarized in Fig. 5 (left), π-electrons of HOMO−2 of 1′ are delocalized over the two fluorophores, but those of LUMO are localized on the naphthalimide moiety. This indicates that the ESICT from the photoexcited coumarin to naphthalimide moiety indeed creates the 533 nm naphthalimide fluorescence.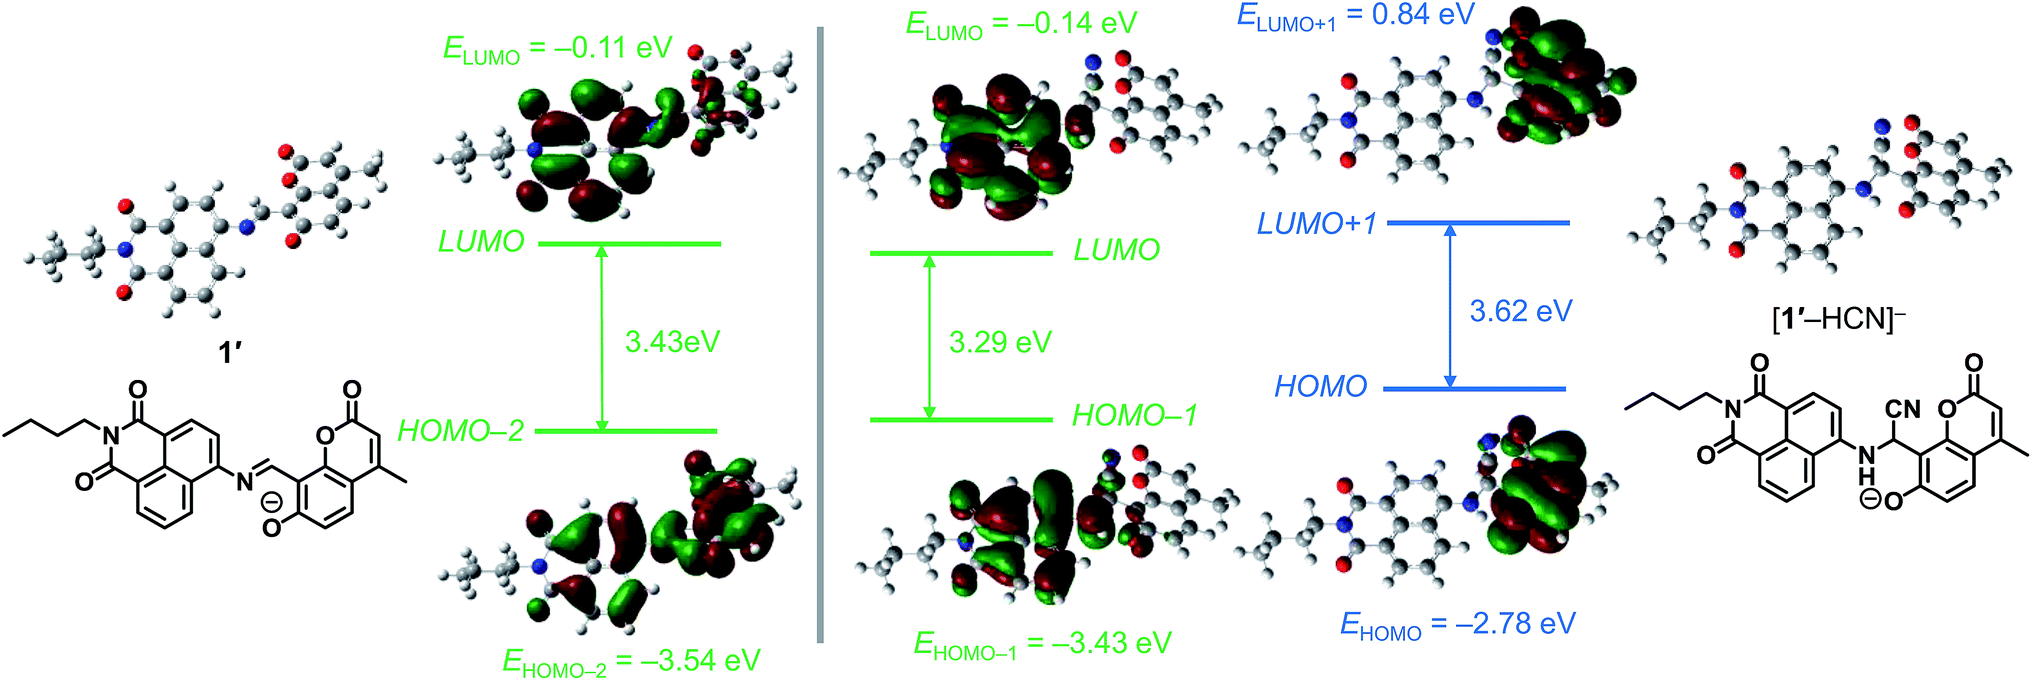 | ||
| Fig. 5 Energy diagrams and interfacial plots of main molecular orbitals of (left) 1′ and (right) [1′–HCN]−, calculated at the DFT level (B3LYP/6-31+G*). | ||
In contrast, as shown in Table S1 (ESI†), singlet transition of [1′–HCN]− species is contributed predominantly by HOMO−1 → LUMO (S0 → S2) and HOMO → LUMO+1 (S0 → S4) transitions. The former transition energy (2.88 eV, 431 nm) is close to that for the observed λmax (425 nm) in the absorption spectrum of [1′–HCN]− (Fig. S9, ESI†). As shown in Fig. 5 (right, green), π-electrons of both HOMO−1 and LUMO are localized on the naphthalimide moiety, indicating that this absorption is attributable to π,π*-transition of naphthalimide moiety. The 533 nm fluorescence of the [1′–HCN]− species therefore originates from the directly photoexcited naphthalimide moiety. In contrast, the energy for HOMO → LUMO+1 transition (3.43 eV, 361 nm) is also close to the observed λmax (368 nm) for the [1′–HCN]− absorption. As shown in Fig. 5 (right, blue), π-electrons of both HOMO and LUMO+1 are localized on the coumarin moiety, indicating that this is attributable to π,π*-transition of the coumarin moiety. The 444 nm fluorescence of [1′–HCN]− therefore originates from the directly photoexcited coumarin moiety. These findings suggest that 1′ shows 533 nm naphthalimide fluorescence through ESICT, while the [1′–HCN]− species shows the 533 nm and 444 nm fluorescence from the directly photoexcited naphthalimide and coumarin moieties, respectively. The intensities of the 533 nm emission from both species are identical and, hence, the emission can be used as an internal standard for ratiometric quantification of CN−.
CN− quantification in cells
The receptor 1 also facilitates quantification of CN− in cells. HeLa cells were incubated in DMF containing 1 (100 μM) and different concentrations of CN− (0–90 μM) for 30 min at 37 °C, and were washed with PBS (pH 7.4). The obtained cells were monitored by fluorescence microscopy at a blue channel (λex = 360 nm; λem = 460 nm) and a green channel (λex = 470 nm; λem = 535 nm), respectively. As shown in the bottom of Fig. 6, the cell images monitored at a green channel show similar emission intensities regardless of the CN− concentrations. In contrast, as shown in the blue channel images (top), the emission intensity increases with increasing the CN− concentrations. The emission intensities of each cell (at least 10 cells) were determined by the equipped BZ-II Analyzer software (Keyence), and their average intensities (FI460 and FI535) were calculated. Fig. 6k shows the change in the ratio of the emission intensity (FI460/FI535) with the CN− concentrations. A linear relationship (R2 = 0.9979) indicates that 1 facilitates accurate quantification of CN− in cells based on the self-calibrating method.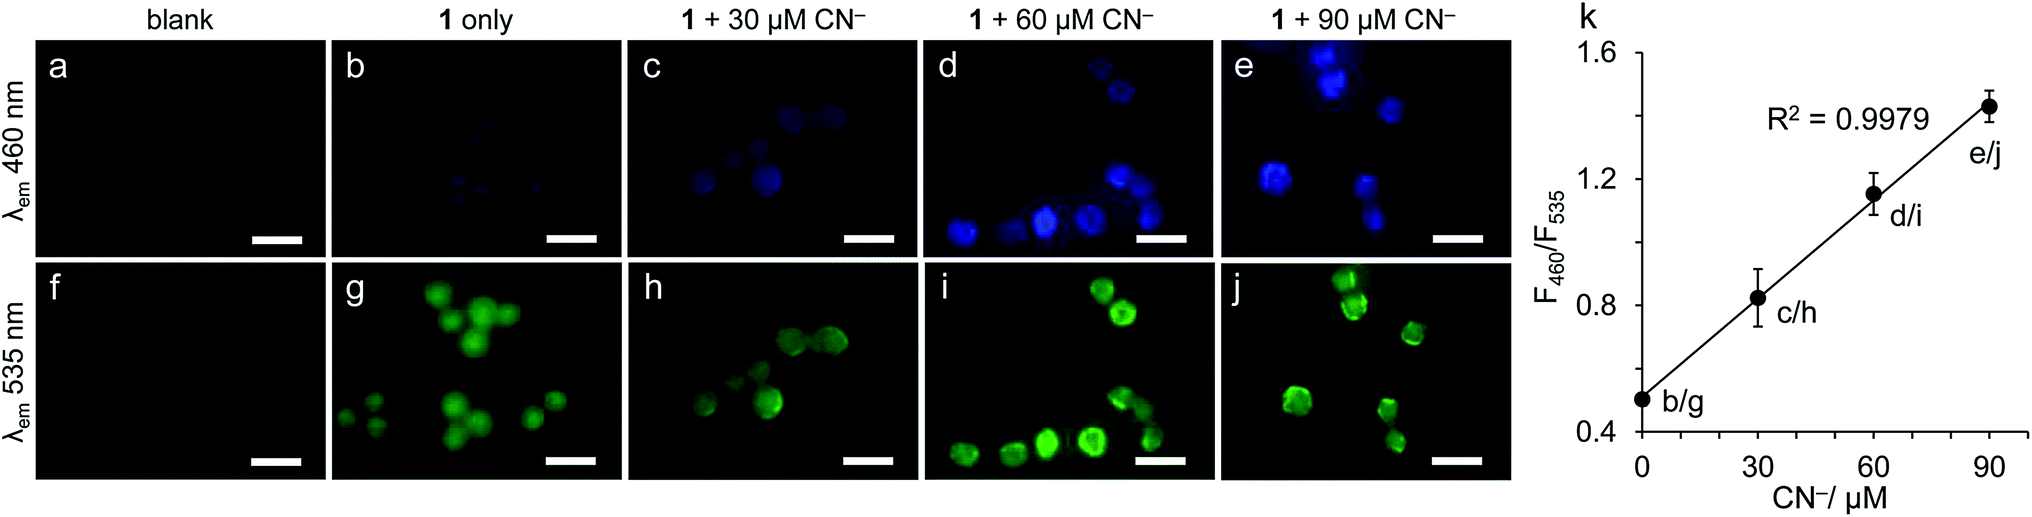 | ||
| Fig. 6 Fluorescence microscope images of HeLa cells incubated with 1 (100 μM, DMF) and different concentration of CN− (0–90 μM), monitored (a–e) at a blue channel (λex = 360 nm; λem = 460 nm) and (f–j) at a green channel (λex = 470 nm; λem = 535 nm). The respective images were obtained after incubation for 30 min at 37 °C, followed by washing with PBS (pH 7.4). (k) Change in the ratio of fluorescence intensity (FI460/FI535) of 1 as a function of CN− concentrations. The scale bars are set at 20 μm. | ||
To clarify the toxicity of the cell treatment, viability of the HeLa cells before and after treatment with DMF solution containing 1 was determined. A Trypan blue solution was added to the cells, and the respective live and dead cells were counted by Countess II FL Automated Cell Counter. As reported,8c,9c–f some early-reported CN− receptors exhibit low cytotoxicity after the treatment with aqueous solution containing the receptors. However, in our case, the cell viability after the treatment was only ca. 4%, as summarized in Fig. S10 (ESI†). This means that the cell treatment with DMF solution containing 1 leads to a loss of the functionality for almost all of the cells. In our case, the use of DMF with high cytotoxicity is necessary for permeation of the receptor into the cells due to its low solubility in water. Living cell imaging is therefore not facilitated by the present receptor 1.
Conclusion
We synthesized a simple naphthalimide–coumarin dyad (1) behaving as a ratiometric fluorescent receptor for CN− quantification. The original longer-wavelength fluorescence is unaffected by CN−, while the shorter-wavelength fluorescence selectively increases by the CN− addition. This thus allows self-calibrating quantification of CN− with the longer-wavelength emission as an internal standard. The receptor facilitates rapid, selective, and sensitive CN− quantification even in cells. The molecular design presented here based on simple conjugation of two fluorophores controlling the invariable and variable emissions towards CN− would contribute to the creation of more efficient receptors for accurate CN− quantification in environmental and biological samples.Experimental
General
All anions were used as n-Bu4N+ or Na+ salts. Fluorescence spectra were measured on a JASCO FP-6500 fluorescence spectrophotometer with a 10 mm path length cell (both excitation and emission slit widths, 5.0 nm) at 298 ± 1 K using a temperature controller. All measurements were performed under aerated condition.17 Absorption spectra were measured on an UV-visible photodiode-array spectrometer (Shimadzu; Multispec-1500) equipped with a temperature controller (S-1700).18 1H and 13C NMR charts were obtained using a JEOL JNM-ECS400 spectrometer. FAB-MS analysis was performed on a JEOL JMS 700 Mass Spectrometer. Fluorescence images of HeLa cells were obtained on fluorescence microscopy (BIOREVE BZ-9000, Keyence).19 Mean fluorescent intensities on the obtained images were determined using BZ-II Analyzer software (Keyence) by measuring the fluorescent intensity of at least 10 cells per photograph. Fluorescence quantum yields (ΦF) were determined with Rhodamine B (in EtOH) as a standard.20Synthesis of the receptor 1 [7-hydroxy-4-methyl-8-((N-butyl-1,8-naphthalimide-4-ylimino)methyl)coumarin]
4-Amino-N-butyl-1,8-naphthalimide (57 mg, 0.2 mmol)11 and 8-formyl-7-hydroxy-4-methylcoumarin (43 mg, 0.2 mmol)12 were dissolved in EtOH (3 mL), and the solution was stirred at 80 °C for 4 h. The solid formed was recovered by filtration and washed thoroughly with EtOH and CH2Cl2, affording 1 as orange solids. Yield: 13.4 mg (14.1%). 1H NMR (400 MHz, DMSO-d6, TMS), δ (ppm): 14.10 (1H, s), 9.41 (1H, s), 8.58 (3H, t, J = 7.1 Hz), 7.97–7.95 (2H, m), 7.87 (1H, d, J = 7.8 Hz), 7.09 (1H, d, J = 8.8 Hz), 6.33 (1H, d, J = 1.0 Hz), 4.08 (2H, t, J = 7.8 Hz), 2.48–2.45 (3H, m), 1.68–1.61 (2H, m), 1.43–1.35 (2H, m), 0.95 (3H, t, J = 7.1 Hz). 1C NMR (100 MHz, DMSO-d6, TMS) δ (ppm): 165.3, 164.1, 163.7, 160.3, 159.7, 154.8, 153.0, 150.3, 132.1, 131.8, 130.5, 129.3, 128.9, 127.4, 126.5, 123.0, 121.5, 116.0, 114.4, 111.9, 111.7, 107.4, 40.4, 30.3, 20.4, 19.0, 13.9. FAB-MS: m/z: calcd for C27H23N2O5+ (1 + H+)+ 455.5; found: 455.2; HRMS (FAB+): m/z: calcd for C27H23N2O5+ (1 + H+)+: 455.1601; found; 455.1605.Calculation details
Ab initio calculations were performed with tight convergence criteria at the DFT level within the Gaussian 03 package, using the B3LYP/6-31+G(D) basis set for all atoms. The excitation energies and oscillator strengths of the compounds were calculated by TDDFT at the same level of optimization. Cartesian coordinates are summarized at the end of ESI.†Cell culture and fluorescence microscopy
HeLa cells were grown in Dulbecco's modified eagle's medium (DMEM) supplemented with 10% fetal bovine serum on cover slip in 60 mm dishes. The trypsinized cells were incubated with DMF containing 1 (100 μM) and required amount of CN− for 20 min at 37 °C in humidified air containing 5% CO2. The cells were then washed with PBS for three times and subjected for observation using BIOREVE BZ-9000 Fluorescence Microscope apparatus.Cell viability test
Trypsinized HeLa cells were incubated with DMF containing 1 (100 μM) for 20 min at 37 °C in humidified air containing 5% CO2. After washing with PBS for three times, a Trypan blue solution was added to the cells. The respective live and dead cells were counted using the Countess II FL Automated Cell Counter.Acknowledgements
This work was supported by the Grant-in Aid for Scientific Research (No. 15K06556) from the Ministry of Education, Culture, Sports, Science and Technology, Japan (MEXT).Notes and references
- A. Ishii, H. Seno, K. Watanabe-Suzuki, O. Suzuki and T. Kumazawa, Anal. Chem., 1998, 70, 4873–4876 CrossRef CAS PubMed
.
- F. Wang, L. Wang, X. Chen and J. Yoon, Chem. Soc. Rev., 2014, 43, 4312–4324 RSC
- R. Badugu, J. R. Lakowicz and C. D. Geddes, J. Am. Chem. Soc., 2005, 127, 3635–3641 CrossRef CAS PubMed
- W. Kaim and B. Schwederski, Bioinorganic Chemistry: Inorganic Elements in the Chemistry of Life, John Wiley & Sons Ltd., England, 1991, p. 208 Search PubMed
- Z. Xu, X. Chen, H. N. Kim and J. Yoon, Chem. Soc. Rev., 2010, 39, 127–137 RSC
- H. Hachiya, S. Ito, Y. Fushinuki, T. Masadome, Y. Asano and T. Imato, Talanta, 1999, 48, 997–1004 CrossRef CAS PubMed
- WHO, Guidelines for Drinking-Water Quality, World Health Organization, Geneva, Switzerland, 2011, p. 342 Search PubMed
-
(a) C. H. Lee, H. J. Yoon, J. S. Shim and W. D. Jang, Chem.–Eur. J., 2012, 18, 4513–4516 CrossRef CAS PubMed
-
(a) X. Cheng, R. Tang, H. Jia, J. Feng, J. Qin and Z. Li, ACS Appl. Mater. Interfaces, 2012, 4, 4387–4392 CrossRef CAS PubMed
-
(a) S. S. Pandey, S. N. Baker, S. S. Pandey and G. A. Baker, Chem. Commun., 2012, 48, 7043 RSC
- L. Cui, Z. Peng, C. Ji, J. Huang, D. Huang, J. Ma, S. Zhang, X. Qian and Y. Xu, Chem. Commun., 2014, 50, 1485–1487 RSC
- Y. Shiraishi, M. Nakamura, T. Kogure and T. Hirai, New J. Chem., 2016, 40, 1237–1243 RSC
- N. Sharma, S. I. Reja, V. Bhalla and M. Kumar, Dalton Trans., 2014, 43, 15929–15936 RSC
- M. Adamczyk, M. Cornwell, J. Huff, S. Rege and T. V. S. Rao, Bioorg. Med. Chem. Lett., 1997, 7, 1985–1988 CrossRef CAS
-
(a) A. Strecker, Justus Liebigs Ann. Chem., 1850, 75, 27–45 CrossRef
- R. E. Stratmann, G. E. Scuseria and M. J. Frisch, J. Chem. Phys., 1998, 109, 8218–8224 CrossRef CAS
- Y. Shiraishi, M. Nakamura, K. Yamamoto and T. Hirai, Chem. Commun., 2014, 50, 11583–11586 RSC
- Y. Shiraishi, K. Tanaka, E. Shirakawa, Y. Sugano, S. Ichikawa, S. Tanaka and T. Hirai, Angew. Chem., Int. Ed., 2013, 52, 8304–8308 CrossRef CAS PubMed
- Y. Liu, S. Sakai, S. Kawa and M. Taya, Anal. Chem., 2014, 86, 11592–11598 CrossRef CAS PubMed
-
(a) A. Proutiere, E. Megnassan and H. Hucteau, J. Phys. Chem., 1992, 96, 3485–3489 CrossRef CAS
Footnote |
| † Electronic supplementary information (ESI) available: Supplementary data (Fig. S1–S10), and Cartesian coordinates for molecules. See DOI: 10.1039/c7ra05423h |
| This journal is © The Royal Society of Chemistry 2017 |