 Open Access Article
Influence of melt-draw ratio on the crystalline behaviour of a polylactic acid cast film with a chi structure
Ruijie Xu*,
Jiayi Xie and
Caihong Lei *
*
Guangdong Provincial Key Laboratory of Functional Soft Condensed Matter, School of Materials and Energy, Guangdong University of Technology, Guangzhou 510006, P. R. China. E-mail: xu565786@163.com; lch528@gdut.edu.cn
First published on 15th August 2017
Abstract
Herein, polylactic acid cast films were prepared with different melt-draw ratios via an extrusion casting process. The structure and properties of the prepared films were characterized. The results showed that with the increasing melt-draw ratios (MDRs), an oriented structure appeared at first, and then, a chi structure crystal was formed at higher MDRs. The vertical shish crystals showed a higher melting point than the oriented structure. The PLA molecules were extended by melt-stretching, and weak hydrogen bonds appeared between the carbonyl and methyl bond in the neighbourhood extended PLA molecular chain segments. The hydrogen bond limited the molecular mobility in the amorphous region, which increased the weight fraction of the rigid amorphous region. The stretching-induced crystallization occurred during the melt-stretching process, but the formed crystals were not strictly α form or α′ form. At lower MDRs, mainly an oriented structure was formed, and with the increase in MDR, meridional streaks in SAXS patterns appeared, accompanying the shish formation. The kebab and oriented structure signals superimposed together; this led to irregular equatorial scattering patterns. In this study, we provide a new insight into PLA crystallization via melt-extrusion cast flow.
Introduction
Polylactic acid (PLA) is a well-known biodegradable semi-crystalline polyester that has been widely used in the biomedical, packaging, and agriculture fields.1 To date, four types of crystal structures (α, α′, β, and γ forms) have been reported, and many studies have been focused on the structural changes, such as crystallization, crystal transformation, and mesophase formation, of PLA.1–4 However, the relatively slow crystallization rate of pure PLA makes it easily quench into the amorphous state during a fast cooling process such as injection, blowing or extrusion moulding.5 The enhancement of overall PLA crystallinity is an essential factor to be considered when PLA is utilized for various industrial applications. Many studies have been carried out to enhance the overall crystallization rate by adding nucleators, such as talc, phthalimide, and triphenyl phosphate.6,7 Some studies show that blending of poly(L-lactide) (PLLA) and poly(D-lactide) (PDLA) is effective for controlling the overall crystallinity and obtaining the stereocomplex crystal with a higher melting point.8 Secondary process technology, such as annealing or stretching, can also increase the nucleation density and improve the crystallinity. All the abovementioned studies are based on the static crystallization process or only stretching of amorphous films for investigation of the crystalline property changes. These experimental conditions are different from those of the fiber fabrication process, where the elongation stress field is applied after the materials leave the extruder die.Several studies about the PLA melt-spinning process showed that the glass transition temperature Tg, melting point (Tm), and crystallinity were considerably increased depending on the melt-draw ratio (MDR). Cicero et al.9 found that Tg increased from 61.7 °C to 68.7 °C, whereas the crystallinity reached 51% at an MDR value of 8. Schmack et al.10 observed that the fibers spun at 1000 mm min−1 remained noncrystalline, and partial crystallization occurred at a spinning velocity above 2500 mm min−1. At a higher spinning temperature and stretching velocity, PLA fibers with β crystals were formed.11
Besides the melt-spinning process, melt-stretching is another important method where the polymer melt is stretched during the crystallization process. This method has been widely used to fabricate polypropylene, polyethylene, polyvinylidene fluoride, and poly(4-methyl-1-pentene) precursor films with row-nucleated crystalline structures.12–15 With the increase of melt-draw ratios, the crystallinity and orientation are enhanced.
During the melt-stretching extrusion process, the polymer molecules are stretched at the exit of the extruder die and orient along the flow direction. The high molecular weight chains will form stable oriented nuclei (shish) and the other chains create the chain-folded lamellae over these nuclei sites. This process will effectively increase the crystallization velocity.16 It is noted that the stretching velocity and melt-draw ratio herein are much smaller than those obtained during the spinning process. Usually, the stretching velocity in melt-extrusion cast is below 10 s−1, whereas that of spinning is more than hundred meters per second. The crystallization behaviour and morphology were different from those achieved during the melt-spinning process.
Depending on the melt-extrusion conditions, a large amount of PLA molecules remains uncrystallized when the molecules are stretched and cooled between the die and chill roll. Then, upon subsequent crystallization, the non-crystalline PLA chains become trapped between the growing crystals inside or outside of the lamella stacks. As a result of the highly entangled nature of the PLA chains, the segmental movement of the amorphous PLA chains becomes restricted. The concept of a third phase, termed as the rigid amorphous fraction (RAF), was introduced to explain the constraints exerted by the crystals upon the mobility of the amorphous phase.17 The existence of RAF shows no contribution to the heat capacity increase at the glass transition Tg and to the heat of fusion of the crystals.18,19
On the other hand, a mesophase has been reported in oriented polymer films and fibers.20,21 The mesophase indicates an oriented phase fraction, which exists as a transition layer, or an interface with a medium level of order between crystalline and amorphous regions, or an intermediate state between the crystalline and amorphous states. The physical nature of this state of intermediate order has been interpreted controversially. It has been proposed that the mesophase can be a type of paracrystalline order, or conformationally disordered structure.22–24
For polymers with a slow crystallization velocity, a complex structure composed of soft amorphous fraction (SAF), RAF, mesophase fraction, and crystal fraction would be obtained via flow-induced crystallization. Therefore, it is necessary to explore the complex crystalline structure prepared by the melt-extrusion cast process. The orientation structure and properties still need further studies. In this study, the PLA cast extrusion films were prepared at different melt-draw ratios between the cast roll and extruder. The structure and properties of the PLA cast films were studied.
Experimental
Material
Polylactic acid (4043D) with a melt flow index of 9.8 g/10 min (190 °C, 2.16 kg) from NatureWorks, USA, was used. The number- and weight-average molecular weights were 4.05 × 10⁵ and 5.47 × 10⁵, respectively, as evaluated by gel permeation chromatography (Viscotek 270max) using polystyrene as the standard and tetrahydrofuran as the solvent. The glass transition temperature of amorphous PLA is at 59 °C with a change in heat capacity of 0.44 J g−1. For 100% crystalline PLA, the heat of fusion is estimated to be 93 J g−1 at a peak melting temperature of Tm = 153.7 °C.25Film preparation
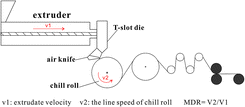
The cast films were prepared by extrusion casting through a T-slot die. During extrusion, uniaxial (machine direction, MD) stretching was applied to the PLA melt. The die temperature was set at 200 °C, and the melt-draw ratios (MDRs) were set at 40, 80, 107, 134, 152, 177, and 211. MDR is a specific value between the line speed of the chill roll and the extrudate velocity at the exit of the die. The films were produced at a chill roll temperature of 50 °C (Fig. 1).Film characterization
 | (1) |
![[thin space (1/6-em)]](https://www.rsc.org/images/entities/char_2009.gif) :
:![[thin space (1/6-em)]](https://www.rsc.org/images/entities/char_2009.gif) 2 by volume) solution containing 0.025 mol L−1 of sodium hydroxide for 24 h at 25 °C. Subsequently, the etched surface was cleaned with distilled water followed by ultrasonication. An SEM (S3400N, Hitachi, Japan) was utilized for all samples, which were sputter-coated with gold before observations, and the accelerated voltage was held at 10 kV.
2 by volume) solution containing 0.025 mol L−1 of sodium hydroxide for 24 h at 25 °C. Subsequently, the etched surface was cleaned with distilled water followed by ultrasonication. An SEM (S3400N, Hitachi, Japan) was utilized for all samples, which were sputter-coated with gold before observations, and the accelerated voltage was held at 10 kV.Results and discussion
Effects of melt-draw ratios on the crystalline structure of cast films
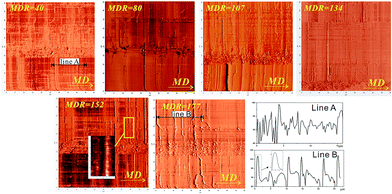
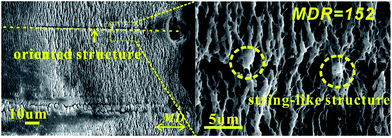
The height images of the surface morphology for the extrusion cast films with different MDRs were obtained using AFM and are shown in Fig. 2. The height difference sections along line A and line B in the extrusion direction are also included. It can be seen that at lower MDR, some oriented structures along the machine direction (MD) appear. With the increasing MDR value, many new textures grow perpendicularly to the oriented initial structure on its both sides. Compared to that in line A, the obvious height difference appears along the machine direction in line B. The orientation-induced crystallization induces the appearance of a vertical structure. These newly grown crystals gradually become pronounced with the increase in MDR. The interesting phenomenon is the formation process of this kind of chi structure. First, some oriented structures appear, and then, a perpendicular structure is induced. A similar crossed crystallization structure formation process has been reported by Murase et al.27 during spinning, where the string-like structure appeared at first via flow-induced phase separation, and then, a shish-kebab structure was formed via a self-assembly process. Analogically, during melt-stretching, the initial oriented structure is first formed and then separated from the matrix because of the viscosity difference. Then, with the increase in the melt-stretching velocity, the oriented structure affords nuclei for the growth of the vertical structure. When we enlarged the vertical structure, we noticed that some analogous kebab structures appear. Compared with the shish-kebab structure formed during melt-spinning, the vertical structure turns longer and distributes sparsely in our experiment. The main reason is the huge stretching rate difference between the melt-stretching and melt-spinning. Ma et al.17 indicated that during the electrospun process, the moved (soft) amorphous phase, rigid amorphous phase, mesophase, and crystal coexisted in the system. Moreover, a similar structure may exist during melt-stretching. The relationship between the initial oriented structure and newly grown crystals has been discussed hereinafter.The etched surface of the PLA cast film with an MDR value of 152 is shown in Fig. 3. It is interesting that the oriented parts are totally etched, and the lamellar structure kebab crystals are reserved. The string-like structure is also saved after etching. This result means that the string-like structure is closer to the crystalline structure. The distance of the neighbourhood-like kebab crystal is about 3–5 μm, which is similar as that of the AFM structure. This stacked structure has also been reported by Xu et al.42 under shear field.
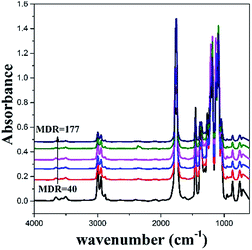
Fig. 4 shows the typical FT-IR spectra of the PLA films with different MDRs. Some distinct peaks within the regions of 2858–2995 cm−1 correspond to the asymmetrical and symmetrical stretching mode of the CH3 and CH2 groups. The fundamental modes of the carbonyl vibration occur in the region 1751–1758 cm−1. It should be noted that upon close examination, the spectra reported by the authors are largely over-absorbed in the thick samples. Moreover, the intensity of the bands near 3700–3450 cm−1 is dependent on the degree of over-absorption. The range between 3700 and 3450 cm−1 is due to an overtone mode, whose intensity increases with the degree of over-absorption of its corresponding fundamental modes. The characteristic spectra of C–O–C occur in the region 1050–1200 cm−1. The peaks in the region 1430–1480 cm−1 represent C–H deformation, whereas those in the region 733–756 cm−1 represent the skeletal vibration of the methylene groups.
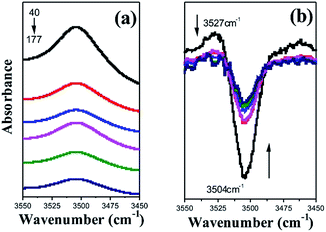
To discuss the effect of melt-stretching on PLA crystal structure transformation, the characteristics of the local regions were followed. As Opaprakasit et al.28 mentioned, bands near 3500 cm−1 were related to the weak C![[double bond, length as m-dash]](https://www.rsc.org/images/entities/char_e001.gif) O bond stretching, implying C
O bond stretching, implying C![[double bond, length as m-dash]](https://www.rsc.org/images/entities/char_e001.gif) O bond elongation due to a specific reaction, especially hydrogen bonding. The enlarged spectra and their second derivatives are shown in Fig. 5. With the increasing MDR, the peak at 3500 cm−1 becomes wide and weak. Moreover, two distinct peaks located at 3527 and 3504 cm−1 in second derivatives were observed, which belonged to the amorphous and crystalline region, respectively. With an enhancement in melt-stretching, the C
O bond elongation due to a specific reaction, especially hydrogen bonding. The enlarged spectra and their second derivatives are shown in Fig. 5. With the increasing MDR, the peak at 3500 cm−1 becomes wide and weak. Moreover, two distinct peaks located at 3527 and 3504 cm−1 in second derivatives were observed, which belonged to the amorphous and crystalline region, respectively. With an enhancement in melt-stretching, the C![[double bond, length as m-dash]](https://www.rsc.org/images/entities/char_e001.gif) O bond elongation in the amorphous region is reduced and turns strong in the crystalline region; this suggests a weak interaction between the carbonyl and methyl bond in the neighbourhood extended PLA molecular chain segments to form the ordered structure. Compared to Opaprakasit's result, the crystalline C
O bond elongation in the amorphous region is reduced and turns strong in the crystalline region; this suggests a weak interaction between the carbonyl and methyl bond in the neighbourhood extended PLA molecular chain segments to form the ordered structure. Compared to Opaprakasit's result, the crystalline C![[double bond, length as m-dash]](https://www.rsc.org/images/entities/char_e001.gif) O overtone found in the pure PLLA is roughly located at 30 cm−1 higher than that of its stereocomplex, reflecting a strong C
O overtone found in the pure PLLA is roughly located at 30 cm−1 higher than that of its stereocomplex, reflecting a strong C![[double bond, length as m-dash]](https://www.rsc.org/images/entities/char_e001.gif) O bond.28
O bond.28
Fig. 6 shows the IR spectra in the range between 1000 and 650 cm−1 and the second derivatives spectra between 950 and 900 cm−1 with different MDRs. As abovementioned, the bands at 707, 755, 869, and 956 cm−1 are attributed to the amorphous region. With the increasing MDR, the band at 869 cm−1, which is assigned to the C–C backbone stretching [ν(C–COO)] is shifted to a higher wavenumber of 871 cm−1 because of the dipole–dipole interaction in the crystal lattice.29 Moreover, the weak shoulder peaks at 916, 739, and 680 cm−1 are observed. They are believed to be relative to the crystalline structure formation.
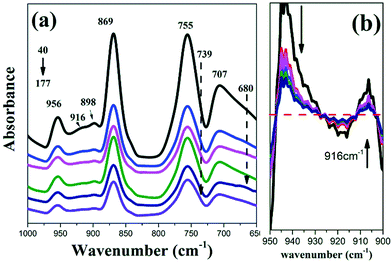 | ||
| Fig. 6 IR spectra (a) and the second derivatives at 960–900 cm−1 (b) of the PLA cast films with different MDRs. | ||
In the backbone vibration region (970–730 cm−1, assigned to skeletal C–C stretching coupled with the CH3 rocking mode),30 the melt-stretched PLA films gives a band at 916 cm−1, whereas there is no band around 920 cm−1 for the amorphous PLLA. It has been found that the band at 920 cm−1 is related to the ordered helical chain conformation of PLLA.31 Stoclet et al.32 and Zhang et al.33 reported that the band at 918 cm−1 belongs to the mesophase formed in the quench- or draw-induced samples. However, during the extrusion cast process, the helix conformation is weak and imperfect. The characteristic peak shifts to a lower wavenumber. Therefore, this may be the first report on the observation of a conformational band at 916 cm−1 for PLLA.
The different melt-draw ratios show a remarkable influence on the molecular orientation. For quantitative comparison, the dichroic ratio R and structural absorbance A were determined using the following relations:20
| R = A∥/A⊥ | (2) |
| A = (A∥ + 2A⊥)/3 | (3) |
Fig. 7 compares the dichroic ratio R of the 916 and 956 cm−1 band, which are assigned to the oriented primary crystal phase and amorphous phase, respectively. With the increasing melt-draw ratio, the orientation fraction improves in both the primary crystal phase and amorphous phase. However, the molecular orientation in the amorphous phase becomes much lower than that in the crystalline phase. Moreover, two possible reasons could account for it. First, it could result from the different extensibility limit of segments trapped among entanglement junctions since further increase in the molecular orientation will be delayed, whereas segments will become well-oriented.34 The main difference in the oriented primary crystal and amorphous phase is the degree of molecule chain entanglement. The entanglement limits significant segmental extensibility and the orientation and crystallization retard the molecule segmental relaxation. The second possibility could be related to higher intermolecular cohesion in the oriented primary crystal phase than that in the amorphous phase beyond the segmental extensibility limit, which can alleviate relative slippage among stretched segments and thus benefit the increase in molecule orientation. Lv et al.20 proved that the cohesive structure required remarkable conformational ordering to reduce steric hindrance. The relative orientation content between the oriented crystal and amorphous phases is also shown in Fig. 7. The value almost remains constant because of synchronized stretching in the oriented primary crystal and amorphous phase in the melt state.
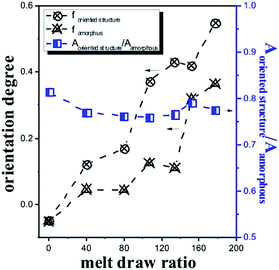 | ||
| Fig. 7 Molecular orientation and relative orientation content of PLA cast films with different MDRs. | ||
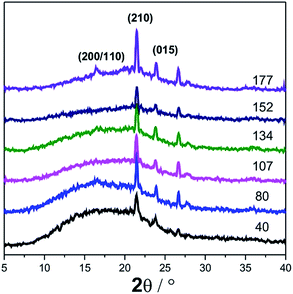
Based on the FTIR result, we believe that an incomplete primary crystal is formed during melt stretching, derived from the weak hydrogen bond between the extended PLA molecular chain segments. To more carefully study the crystal structure, the WAXD profiles of the PLA cast films with different MDRs from 40 to 177 are given in Fig. 8. Sharp crystalline peaks are observed at the 2θ values around 21.4°, 23.8°, and 26.6° for all samples. These three peaks are attributed to the diffraction from the (210), (015), and (207) lattice planes. The (210) lattice plane is the characteristic of an α crystal reported by Zhang et al.35 Cho36 found that when the annealing temperature was higher than 155 °C, the 015-reflection appeared and it was attributed to the transformation of the disordered part into crystals during heating. Herein, the existence of the 015-reflection indicates the formation of ordered crystals during melt stretching. However, it is surprising that the main reflection peak of α or α′ form crystals at 16.8° for both (200) and (110) reflections does not appear until the MDR is 177. We believe that during melt stretching, the molecular orientation induces the formation of crystal nuclei and some weak or imperfect primary crystals. However, these crystals are not strictly α form or α′ form. This result is in agreement with the FTIR spectra, where the new characteristic peak at 916 cm−1 corresponds to this incomplete primary crystal.
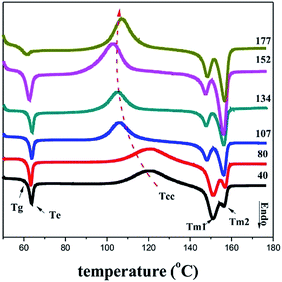
Fig. 9 shows the DSC curves of PLA films with different MDRs. The enthalpy value of each crystallization peak and the crystallinity of the samples are listed in Table 1. All the curves exhibit a glass transition temperature (Tg), a broad cold-crystallization exotherm (Tcc), and two melting peaks (Tm1 and Tm2). The samples prepared at the MDR values of 40 and 80 show approximate DSC curves. The Tg does not change much and the Tcc shifts to lower temperatures and becomes sharper with the increase in MDR from 80 to 152. This may be since the melt-stretching process enhances the molecular orientation and the formation of the initial crystalline nuclei for cold-crystallization. Similar results have been reported by Lee et al.37,38 Further increase in the MDR to 177 results in the movement of Tg to lower temperatures. The relaxation peak almost disappears. Tcc becomes broad and moves to higher temperatures because of a reduction of the initial crystalline nuclei numbers. During the melt stretching extrusion process, the stretching-induced crystallization only occurs within the limited space between the die and the chill roll. Higher MDR shortens the staying time within this space, and there is not enough time for nuclei formation; this results in lower crystallinity.
| MDR | 40 | 80 | 107 | 134 | 152 | 177 |
|---|---|---|---|---|---|---|
| HC (J g−1) | 36.3 | 36.9 | 37.1 | 43.8 | 43.1 | 41.0 |
| HM (J g−1) | 38.5 | 41.2 | 42.5 | 49.6 | 51.3 | 47.6 |
| X (%) | 2.3 | 4.6 | 5.82 | 6.21 | 8.8 | 7.1 |
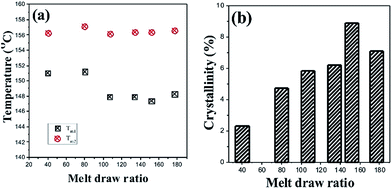
The melting point and crystallinity of the samples are shown in Fig. 10. The phenomenon of double melting peaks in the PLA cast film has been reported by Zhang et al.,31 but they did not provide the reason for it. We notice that the Tm1 peak becomes weak and the Tm2 peak is obviously enhanced with an increase in MDR. The abovementioned AFM images show that at lower MDRs, the oriented structure is mainly induced, and then, more vertical crystals (Chi-structure) are formed at higher MDRs. Then, it is deduced that at lower MDRs, Tm1 originates from the melting of the oriented structure and Tm2 is related to the vertical crystals. With the increasing MDR, the more initially oriented structure is transformed into a higher ordered crystalline structure, and more vertical crystals are induced; this leads to the improvement of the Tm2 peak. We also notice that the melting temperature of the cast film is 10 °C lower than that of the normal PLLA crystalline samples33,35 because of the weak crystalline structure. Although the weak hydrogen bond between the carbonyl and methyl bond in the neighbourhood extended PLA molecular chain segments could increase the melting temperature, the efficiency was limited. The crystal formed in the melt-stretching process is still very weak and incomplete. The crystallinity shows the same trend. When the MDR is smaller than 152, the crystallinity is increased from 2.3% to 8.9%. Upon further increasing the MDR, the crystallinity decreases to 7.8%. Apparently, fast stretching shows no benefit on the force-induced crystallization for polymers with slow crystalline velocity.
For crystals with slow crystallization velocity, a soft amorphous region (SA), rigid amorphous region (RA), and crystalline region (C) coexist. The weight fractions ΦI for I = SA, RA, and C of these three phases can be determined by DSC.17 ΦC is equivalent to crystallinity, and ΦSA is calculated as follows:
| ΦSA = ΔCp/ΔCp0 | (4) |
| ΦRA = 1 − Φc − ΦSA | (5) |
As seen in Table 2, ΦSA decreases with the increasing MDR. The ΦSA is decreased to 0.63 for the melt-extrusion cast film produced using an MDR of 152; this indicates that 0.149 RAF exists in this sample. An endothermic peak is also observed just above Tg in the DSC curves (Fig. 8). Wunderlich pointed out that for any ordering connected with the RAF, a decrease in enthalpy would be expected, whereas disordering would yield an endotherm.39 The decrease in heat capacity increment at Tg confirms that RAF is able to exist in the films. The weak hydrogen bond between the carbonyl and methyl bond may be the main reason affecting the molecular mobility in the amorphous region.
| MDR | 40 | 80 | 107 | 134 | 152 | 177 |
|---|---|---|---|---|---|---|
| ΦC | 0.023 | 0.047 | 0.058 | 0.062 | 0.089 | 0.071 |
| ΦSA | 0.95 | 0.83 | 0.77 | 0.75 | 0.63 | 0.78 |
| ΦRA | 0.027 | 0.123 | 0.172 | 0.188 | 0.281 | 0.149 |
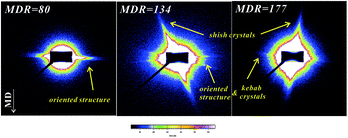
To better understand how the crystals are formed, the cast films with different MDRs were tested via SAXS experiments. The extrusion is in the vertical direction as indicated by the arrow in Fig. 11. At an MDR value of 80, only two sharp SAXS patterns on the equatorial direction are observed. No pronounced vertical patterns can be found. This is in agreement with the former DSC results, where the Tm1 peak is stronger than that of Tm2. The equatorial pattern is attributed to the oriented crystalline structure induced by low MDR stretching, similar to that obtained for lower shear rate shearing-only induced layered structure.40 These results further prove the formation of a mainly oriented crystalline structure at lower MDRs. With the increase in MDR to 134 and 177, the scattering intensity in the equatorial direction is not uniform and becomes weak obviously; a strong scattering pattern appears in the meridional direction, in agreement with the abovementioned vertical crystal formation at higher MDRs. As shown in the AFM images, a multilevel-kebab structure appears at a higher MDR. The meridional pattern is contributed by vertical shish crystals and the irregular scattering pattern on the equatorial direction is the superimposed signals of the oriented initial crystals and the grown kebab. The SAXS pattern transformation process is similar to the change of the shish nuclei model during the flow-induced crystallization process.41
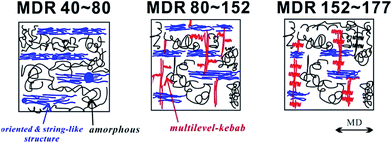
A schematic of the crystalline structure formation process is shown in Fig. 12. At a low melt-draw ratio, the crystallinity is very low. The soft amorphous region and rigid amorphous region (oriented structure) coexist in the system. With the increasing melt-draw ratio, the multilevel-kebab structure is observed, but these crystals are not strictly α or α′ form crystals. When the MDR is increased to 177, the multilevel-kebab structure turns intensive. The rigid amorphous region turns discontinuous due to the fast crystalline velocity induced by the higher melt-stretching field.
Conclusions
The structure and crystalline properties of PLA extrusion cast film with different melt-draw ratios were described based on the AFM, FTIR, DSC, WAXD, and 2D-SAXS data. The oriented crystalline structure forms at lower melt-draw ratios, and higher melt-draw ratios induce pronounced chi structure crystals. The DSC curves show that all the samples have two melting peaks, corresponding to the chi structure. The melting point of the oriented structure is near 149 °C, and the vertical shish crystals have a higher melting point at 156 °C. The melting point is 10 °C lower than that of a normal PLA spherulite because of the weak hydrogen bond. The crystallinity is gradually improved with the increasing MDR from 40 to 152 and obviously reduced at higher MDRs. The melt-stretching-induced crystals are not strictly an α form or α′ form, and the characteristic bond of the initial oriented structure is at 916 cm−1. At lower MDRs, the chain segments are oriented and stretched. At higher MDRs, the chi-structure crystals appear on both sides of the initial oriented crystalline structure. This melt stretching process typically increases the rigid amorphous region fraction.Acknowledgements
The authors would like to thank the National Science Foundation of China under Grant No. 51603047, Guangdong Province Major Key Projects of Applied Research and Development of Science and Technology (2015B090925021), Guangzhou Science and Technology Plan Project (201510010037), Guangdong Province Ordinary University Innovation Project, the PhD Start-up Fund of the Natural Science Foundation of Guangdong Province, China (2016A030310344), and China Postdoctoral Science Foundation funded project (2016M592461) for financial support. We would also like to thank Shenzhen Senior Materials Company, Ltd., for generously supplying the raw materials.Notes and references
- M. Peddy, S. Vivekanandhan, M. Misra, S. Bhatiac and A. Mohanty, Prog. Polym. Sci., 2013, 38, 1653 CrossRef.
- L. Bouapao, H. Tsuji, K. Tashiro, J. Zhang and M. Hanesaka, Polymer, 2009, 50, 4007 CrossRef CAS.
- J. Kalish, K. Aou, X. Yang and S. Hsu, Polymer, 2011, 52, 8141 Search PubMed.
- G. Stoclet, R. Seguela, J. Lefebvre and M. Vert, Macromolecules, 2011, 44, 4961 CrossRef CAS.
- Z. Gui, C. Lu and S. Cheng, Polym. Test., 2013, 32, 15 CrossRef CAS.
- H. Xiao, P. Li, X. Ren, T. Jiang and J. Yeh, J. Appl. Polym. Sci., 2010, 118, 3558 CrossRef CAS.
- D. He, Y. Wang, C. Shao, G. Zheng, Q. Li and C. Shen, Polym. Test., 2013, 32, 1088 CrossRef CAS.
- J. Sun, J. Shao, S. Huang, B. Zhang, G. Li, X. Wang and X. Chen, Mater. Lett., 2012, 89, 169 CrossRef CAS.
- J. Cicero, J. Dorgan, J. Janzen, J. Garrett, J. Runt and J. Lin, J. Appl. Polym. Sci., 2002, 86, 2828 CrossRef CAS.
- G. Schmack, B. Tändler, R. Vogel, R. Beyreuther, S. Jacobsen and H. Fritz, J. Appl. Polym. Sci., 1999, 73, 2785 CrossRef CAS.
- B. Gupta, N. Revagade, N. Anjum, B. Atthoff and J. Hilborn, J. Appl. Polym. Sci., 2006, 100, 1239 CrossRef CAS.
- C. Lei, S. Wu, Q. Cai, R. Xu, B. Hu and W. Shi, Polym. Int., 2014, 63, 584 CrossRef CAS.
- B. Hu, C. Lei, R. Xu, W. Shi, Q. Cai, H. Mo and C. Chen, J. Plast. Film Sheeting, 2013, 30, 300 CrossRef.
- B. Hu, C. Lei, R. Xu, W. Shi, Q. Cai, H. Mo and C. Chen, J. Plast. Film Sheeting, 2015, 31, 78 CrossRef.
- A. Ma, L. Xu, B. Yin, M. Yang and B. Xie, RSC Adv., 2016, 6, 62038 RSC.
- R. Lv, R. Na, Z. Li, S. Zou, N. Tian, F. Chen and Q. Fu, J. Macromol. Sci., Part B: Phys., 2011, 50, 2042 CrossRef CAS.
- Q. Ma, M. Pyda, B. Mao and P. Cebe, Polymer, 2013, 54, 2544 CrossRef CAS.
- R. Androsch and B. Wunderlich, Polymer, 2005, 46, 12556 CrossRef CAS.
- W. Qiu, A. Habenschuss and B. Wunderlich, Polymer, 2007, 48, 1641 CrossRef CAS.
- R. Lv, B. Na, N. Tian, S. Zou, Z. Li and S. Jiang, Polymer, 2011, 52, 4979 CrossRef CAS.
- A. Sanz, A. Nogales, T. Ezquerra, M. Soccio, A. Munari and N. Lotti, Macromolecules, 2010, 43, 671 CrossRef CAS.
- S. Ran, X. Zong, D. Fang, B. Hsiao, B. Chu and R. Phillips, Macromolecules, 2001, 34, 2569 CrossRef CAS.
- S. Bruckner, S. Meille, V. Petraccone and B. Pirozzi, Prog. Polym. Sci., 1991, 16, 361 CrossRef CAS.
- Y. Zhou, J. Hu, B. Dang and J. He, RSC Adv., 2016, 6, 48720 RSC.
- M. Pyda and B. Wunderlich, Macromolecules, 2005, 38, 10472 CrossRef CAS.
- S. Gogolewski and A. Pennings, J. Appl. Polym. Sci., 1983, 28, 1045 CrossRef CAS.
- H. Murase, Y. Ohta and T. Hashimoto, Macromolecules, 2011, 44, 7335 CrossRef CAS.
- P. Opaprakasit, M. Opaprakasit and P. Tangboriboonrat, Appl. Spectrosc., 2007, 61, 1352 CrossRef CAS PubMed.
- B. Na, N. Tian, R. Lv, Z. Li, W. Xu and Q. Fu, Polymer, 2010, 51, 563 CrossRef CAS.
- G. Kister, G. Cassanas and M. Vert, Polymer, 1998, 39, 267 CrossRef CAS.
- J. Zhang, Y. Duan, H. Sato, H. Tsuji, I. Noda, S. Yan and Y. Ozaki, Macromolecules, 2005, 38, 8012 CrossRef CAS.
- G. Stoclet, R. Seguela, J. M. Lefebvre, S. Elkoun and C. Vanmansart, Macromolecules, 2010, 43, 1488 CrossRef CAS.
- J. Zhang, K. Tashiro, H. Tsuji and A. Domb, Macromolecules, 2007, 40, 1049 CrossRef CAS.
- K. Takahashi, D. Sawai, T. Yokoyama, T. Kanamoto and S. Hyon, Polymer, 2004, 45, 4969 CrossRef CAS.
- J. Zhang, K. Tashiro, H. Tsuji and A. Domb, Macromolecules, 2008, 41, 1352 CrossRef CAS.
- T. Cho and G. Strobl, Polymer, 2006, 47, 1036 CrossRef CAS.
- S. Lee, J. Han and J. Heo, Polymer, 2013, 54, 3624 CrossRef CAS.
- S. Lee, J. Han, Y. Jeong and M. Kwon, Macromolecules, 2009, 43, 25 CrossRef.
- B. Wunderlich, Prog. Polym. Sci., 2003, 28, 383 CrossRef CAS.
- Y. Wang, M. Li and C. Shen, Mater. Lett., 2011, 65, 3525 CrossRef CAS.
- B. Na, N. Tian, R. Lv, Z. Li, W. Xu and Q. Fu, Polymer, 2010, 51, 563 CrossRef CAS.
- H. Xu, L. Xie, X. Jiang, M. Hakkarainen, J. B. Chen, G. J. Zhong and Z. M. Li, Biomacromolecules, 2014, 15, 1676 CrossRef CAS PubMed.
| This journal is © The Royal Society of Chemistry 2017 |

