 Open Access Article
Creative Commons Attribution 3.0 Unported Licence
Thermally shocked graphene oxide-containing biocomposite for thermal management applications†
Orebotse Joseph Botlhokoab,
James Ramontja a and
Suprakas Sinha Ray
 *ab
*ab
aApplied Chemistry Department, University of Johannesburg, Droonfontein 2028, Johannesburg, South Africa. E-mail: rsuprakas@csir.co.za; suprakas73@yahoo.com
bDST-CSIR National Centre for Nanostructured Materials, Council for Scientific and Industrial Research, Pretoria 0001, South Africa
First published on 5th July 2017
Abstract
In this communication, we present a new approach to simultaneously improve the thermal conductivity and ductility of a biobased polylactide blend composite by localizing thermally shocked graphene oxide particles in a dispersed poly(ε-caprolactone) phase. The preliminary results presented in this work will pave the way for the development of high performance environmentally benign composite materials for thermal management applications.
1. Introduction
The critical issue of thermal management in electronic packaging has attracted increasing attention owing to the continuous demand for faster electronic devices and reduction in the overall size of electronic components.1 In addition, the development of environmentally benign material-based cheaper electronic devices is in the forefront of electronic industries and academic research. Ideal thermal management materials are expected to provide concurrent package protection, heat dissipation, and finally should be easily processable and environment-friendly.2 However, a combination of these properties is not easily achievable.Conventional materials used for thermal management include metals, ceramics and carbon based fillers, and polymers like thermosets and thermoplastics.3,4 These conventional materials in their original form are not suitable for thermal management applications owing to the need for high power density and small sized electronic devices.5 For example, metals have high mass density which eliminates their use as heat sinks, and it develops stress problems during shipping and handling. Conventional polymers have low thermal conductivity and high coefficient of thermal expansion.3,6,7 One of the most promising polymers for thermal management applications is polylactide (PLA) as it is biodegradable and exhibits good mechanical properties. However, its low elongation at break, heat distortion temperature, and melt viscosity for further processing are drawbacks that limit its diverse applications.8
To overcome the above-mentioned drawbacks, several studies on graphene particles-filled PLA/PCL blend composites have been conducted. For example, Huang et al.9 showed the improved efficiency of selectively located graphene fillers at the interface of immiscible PCL/PLA blends; the PCL and the PLA phases formed a co-continuous structure resulting in high thermal conductivity. Mosanenzadeh et al.2 reported that a higher filler loading of combined graphene nanoplatelets/hexagonal boron nitride in PLA composites resulted in higher thermal conductivity than a lower loading in graphene nanoplatelets/hexagonal boron nitride-filled PLA composites. On the other hand, Huang et al.10 demonstrated improved thermal conductivity with a high filler loading of combined carbon nanotubes/graphene nanoplatelets in epoxy matrix. Several studies revealed that thermal conductivity of graphene-based composites has the potential to outperform thermal conductivity of composites filled with carbon nanotubes or metal particles due to unique two-dimensional phonon transport, physical properties, and very high thermal conductivity of graphene. This indicates that the inherent properties of the filler are vital for obtained composite properties.11–14 In addition, few studies demonstrating the enhanced thermal conductivity of boron nitride-filled composites at a high filler loading have been reported.15,16
In brief, very high filler loading and trapping of the filler at the interface of immiscible polymer blends strongly affects the transport phenomena; hence, blend composites exhibit high thermal conductivity.9,16 Furthermore, surface treatment of the filler using strong acids or acetone helps in controlling the filler localization in the system, which results in high thermal conductivity. Mixing particles of different sizes and shapes has also been demonstrated as an effective method to improve the thermal conductivity.16,17 However, these fundamentals are not in line with the interests of the 21st century technology of electronic industries. Considering the filler loading, localization, dispersibility, and the above-mentioned drawbacks of PLA, it is clear that there is a need for research and development of environmentally benign thermal management components.
The aim of this communication is to demonstrate the potential of graphene oxide (GO)-based filler for thermal management applications, since graphene has very high thermal conductivity of approximately 5.5 × 10³ W m−1 K−1, theoretical specific surface area of approximately 2630 g m−2, and other unique physical characteristics.18,19 In addition, we present an interesting example of highly dispersible and self-controllable GO-based material obtained through one-step green chemistry based protocol. The concurrent improvements in the thermal conductivity and the electrical resistivity with the addition of only GO-based filler in the PLA/PCL blend and the dependence of the compatibilization efficiency on the filler dispersibility have been studied.
2. Experimental
The graphite (G) powder used to prepare GO in this study was purchased from Sigma-Aldrich, South Africa. A commercial-grade (PLA U'Z S-17) PLA (D-content ≈ 1%) obtained from Toyota, Japan with Mw = 120–135 kg mol−1, ρ = 1.24 g cm−3, a melt flow index (MFI) of 15.84 g/10 min (190 °C/2.16 kg, according to the ISO 1133B standard method), Tg = 62 °C, and Tm = 175 °C was used in this study. PCL was purchased from Sigma-Aldrich, South Africa. According to the supplier, the properties of PCL were Mw = 80 kg mol−1, ρ = 1.145 g cm−3, MFI = 5.57 g/10 min (190 °C/2.16 kg, according to the ISO 1133B standard method), and Tm = 60 °C. Prior to use, PLA was dried at 80 °C, while PCL was dried at 40 °C under vacuum for 12 h.GO was prepared through chemical oxidation of the natural G powder according to the well-known improved Hummers' method reported by the Tour group,20 as presented briefly in the ESI.† To obtain thermally exfoliated and partially reduced GO (TERGO), the dried GO powder (∼0.1 g) was subjected to thermal shock in a tube furnace at 700 °C for a minute under the flow of argon gas (120 ml min−1).
Neat blend and blend composites were prepared via melt-mixing in a HAAKE PolyLab OS Rheomix (Thermo Electron Co., USA) operated at a rotor speed of 60 rpm at a temperature of 195 °C for 8 min. All the components were dry-mixed in a plastic bag before melt mixing. The neat PLA/PCL blend and the blend composites were then compression molded into different shapes at 195 °C using a Carver 973214A hot press at 1.2 MPa and cooled to ±20 °C. However, the samples for thermal conductivity measurements were melt-pressed at 195 °C under a pressure of 50 kPa using a custom-built 20-ton hydraulic melt press. The samples containing 0 and 0.05 wt% of either GO or TERGO filler are denoted as blend, blend/GO, and blend/TERGO, respectively. Neat PLA and PCL were prepared by the same method as the neat blend and its composites. Furthermore, the PLA/PCL blend weight ratio was fixed at 60![[thin space (1/6-em)]](https://www.rsc.org/images/entities/char_2009.gif) :
:![[thin space (1/6-em)]](https://www.rsc.org/images/entities/char_2009.gif) 40 and finally denoted as blend. The motivation to select this blend ratio can be found in the ESI (Fig. S1, ESI).†
40 and finally denoted as blend. The motivation to select this blend ratio can be found in the ESI (Fig. S1, ESI).†
The chemical and structural characterizations of the G, GO, and TERGO particles were carried out using attenuated total reflectance Fourier-transform infrared spectra (FTIR) spectroscopy with a Perkin-Elmer Spectrum 100 spectrometer (USA) in the range of 600 to 4000 cm−1. The morphological analyses of the GO and the TERGO particles were carried out by field-emission scanning electron microscopy (FESEM; JSM-7500, JEOL, Japan). The samples were sputter coated with carbon before imaging at an acceleration voltage of 2 kV. Raman spectroscopic measurements were conducted using a Jobin-Yvon T64000 Raman spectrometer (France) equipped with an OlympusBX40 micro-Raman (100× objective) using 514.5 nm excitation wavelength of an argon ion-laser. The morphologies of the polymeric samples were also analyzed using FESEM. The blend and the composite samples were first freeze-fractured in liquid nitrogen, and then the PCL minor phase was etched with acetic acid for 15 h at 27 °C. The etched surface was then sputter-coated with carbon, and the sides were painted with a silver paste and finally imaged at an acceleration voltage of 3 kV. The number average radius (Rn) of the etched and dispersed PCL droplets were determined by imageJ software (ImageJ 1.46r), using eqn (1).
 | (1) |
 | (2) |
 | (3) |
 | (4) |
 is the specific melting enthalpy of 100% crystalline PLA or PCL, which are 93 (ref. 21) or 135 (ref. 22) (J g−1), respectively.
3. Results and discussion
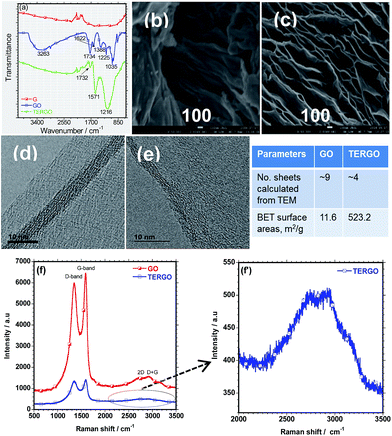
The FTIR spectra and the SEM images of the GO and the TERGO particles are presented in Fig. 1(a), (b) and (c) respectively. No well-defined IR peaks were observed in the FTIR spectrum of G. On the other hand, the spectrum of GO was characterized by IR peaks at 1035, 1225, 1388, 1622, 1734, and 3263 cm−1, which correspond to the alkoxy C–O, epoxy C–O, –OH bending deformation (bound H2O molecules) or C–O vibration, C![[double bond, length as m-dash]](https://www.rsc.org/images/entities/char_e001.gif) C stretching of the aromatic (sp2 system of GO), C
C stretching of the aromatic (sp2 system of GO), C![[double bond, length as m-dash]](https://www.rsc.org/images/entities/char_e001.gif) O stretching vibration of the carboxyl group, and hydroxyl –OH (free H2O molecules), respectively.23–25 The presence of these IR peaks confirm the successful oxidation of GO. The FTIR spectrum of TERGO was characterized by similar IR peaks at 1216, 1571, and 1732 cm−1, corresponding to the stretching vibration of the C–O, C
O stretching vibration of the carboxyl group, and hydroxyl –OH (free H2O molecules), respectively.23–25 The presence of these IR peaks confirm the successful oxidation of GO. The FTIR spectrum of TERGO was characterized by similar IR peaks at 1216, 1571, and 1732 cm−1, corresponding to the stretching vibration of the C–O, C![[double bond, length as m-dash]](https://www.rsc.org/images/entities/char_e001.gif) C, and C
C, and C![[double bond, length as m-dash]](https://www.rsc.org/images/entities/char_e001.gif) O bonds, respectively that exist in both the GO-based particles. It is evident that the thermal exfoliation process of GO removed most of the oxygen-containing functional groups and decreased the intensity of the remaining IR peaks.
O bonds, respectively that exist in both the GO-based particles. It is evident that the thermal exfoliation process of GO removed most of the oxygen-containing functional groups and decreased the intensity of the remaining IR peaks.
The SEM image of GO showed the presence of thin graphene sheets and a wrinkled surface morphology [Fig. 1(b)]. On the other hand, the SEM image of TERGO showed well-expanded and thinner graphene sheets compared to those of GO. The decrease in the thickness indicates the removal of bound water and other oxygen-containing functional groups as discussed previously, indicating successful exfoliation. The expansion suggests an increase in the volume ratio. To support the above findings and obtain more insights into the oxidation of GO, exfoliation and slight reduction of the TERGO, Raman spectroscopic analyses were conducted. Fig. 1(f) shows the Raman spectra of the GO and the TERGO particles. The Raman spectra revealed that GO contains narrow D- and G-band peaks at about 1349.83 cm−1 and 1595.92 cm−1 due to the presence of hydroxyl, epoxy, and carboxyl functional groups.20,26 In addition, very weak 2D and D + G peaks are also visible at 2727.43 cm−1 and 2931.42 cm−1, indicating multi-layer graphene sheets.26 On the other hand, TERGO contains characteristic D- and G-band peaks at 1355.47 cm−1 and 1591.79 cm−1. Significantly weak D and D + G peaks at about 2743.49 cm−1 and 2921.44 cm−1 are observed in the case of TERGO (Fig. 1(f′)). Importantly, the intensity of the D and G peaks and their overtones significantly decreased upon thermal shocking process. Thus, supports the expansion and reduction of number graphene sheets due to the removal of most of oxygen-containing functional groups [Fig. 1(a)–(e)] and inset table, which lead to high thermal conductivity characteristics. The data obtained based on the D- and G-peaks, and their overtones are consistent with chemical oxidation, thermal exfoliation and reduction reports.20,26,27
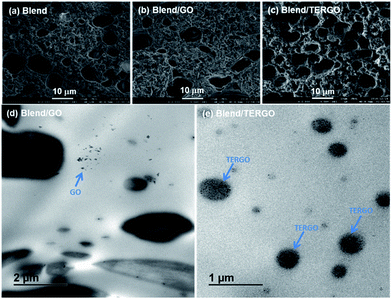
The freeze-fractured PCL-etched surface morphology of the neat blend presented in Fig. 2(a) shows that the irregular PCL droplets are non-uniformly dispersed in the PLA matrix, suggesting poor compatibility between the PLA and the PCL phases. The droplet size (Rn, μm) of the dispersed PCL minor phase decreased when the GO [Fig. 2(b)] and the TERGO [Fig. 2(c)] particles were incorporated in the blend. For example, in the case of the neat blend, the calculated size of the dispersed phase was 1.31 ± 0.26 μm, which decreased to 0.79 ± 0.25 μm and 0.76 ± 0.04 μm in the cases of GO- and TERGO-filled blend composites, respectively. It is notable that the addition of the TERGO particles improved the uniformity of the dispersed PCL droplets. Such an observation is attributed to the preferential localization of the TERGO particles in the dispersed PCL phase, resulting in an increased viscosity ratio, which in turn leads to a delay of or an insufficient coalescence of the dispersed PCL droplets. This observation indicates that 0.05 wt% TERGO is sufficient to fine-tune and stabilize the phase-separated blend morphology. The stable and compatibilized morphology of the TERGO-filled blend composite conduced to a higher melt viscosity (Fig. S2, ESI†).
To support the above findings and obtain more insights on the dispersions of the GO and the TERGO particles in the PLA/PCL phase, local TEM analyses were carried out. Fig. 2(d) and (e), respectively, show the bright field TEM images of the GO- and the TERGO-filled blend composites. The TEM micrographs revealed that most of the GO particles were randomly dispersed in the PLA phase and very few particles existed in the PCL phase. On the contrary, the TERGO particles were homogeneously dispersed in the PCL phase.
From Fig. 3, it is noticeable that the neat PLA exhibits high modulus and tensile strength and a very low elongation at break. The observed brittleness of PLA is a major disadvantage for various applications.21 Upon blending PLA with PCL, the modulus and the tensile strength decreased significantly, however, the ductile nature of PCL led to a significant increase in the elongation at break of the PLA/PCL blend. On the other hand, the GO-filled blend composite showed deterioration of all the tensile properties, which is attributed to the stiffness of the GO particles and the poor compatibilization efficiency. Interestingly, the TERGO-filled blend composite showed a balance of modulus and tensile strength compared to those of the neat blend and a significant increase in the elongation at break. This indicates that the TERGO particles are excellent compatibilization agents for this blend. It should be noted that the error bars of the TERGO-filled blend composite were significantly smaller than those of the GO-filled blend composite, indicating better dispersion of the PCL droplets in the PLA matrix due to the preferential localization of the TERGO particles.
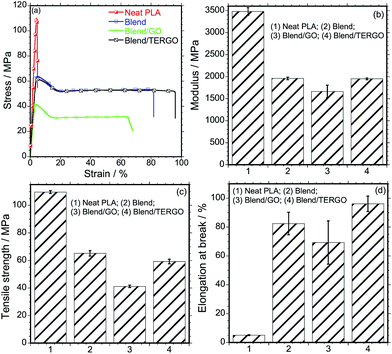 | ||
| Fig. 3 (a) Stress–strain curves, (b) tensile modulus, (b) tensile strength, and (d) elongation-at-break of neat polymers, blend, and GO- and TERGO-filled blend composites. | ||
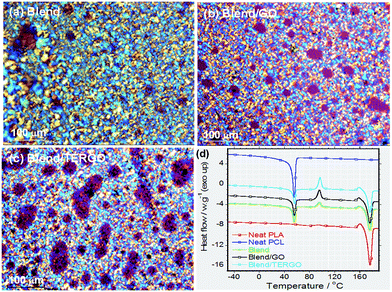
It is known that heat transport in G particles or its derivatives occurs via phonons of varying frequencies. The high frequency phonons are the major heat energy carriers, and the low frequency phonon vibrations carry a small amount of heat energy in various systems.28 In order to elucidate the thermal conductivity and the electrical resistivity behaviors of neat PLA, PCL, blend, GO- or TERGO-filled blend composites, the transport properties were measured, and the relative thermal conductivity and resistivity bar graphs are shown in Fig. 4(a) and (b), respectively. It is notable that the neat PLA has a higher thermal conductivity (0.22392 W m−1 K−1) and resistivity (1.8959 × 10¹³ ohm per cm) than the neat PCL (0.17312 W m−1 K−1 and 1.2716 × 10¹³ ohm per cm) and the blend (0.20821 W m−1 K−1 and 8.4007 × 10¹² ohm per cm). The obtained value of the thermal conductivity of neat PLA is consistent with its known value of approximately 0.16 W m−1 K−1.2 Upon blending PLA with PCL, a slight reduction in the thermal conductivity with a significant reduction in the resistivity was observed. The slight reduction in the thermal conductivity of the blend is attributed to the low thermal conductivity of the dispersed PCL droplets. The resistivity behavior of the blend is unusual since polymers are natural insulators, and thus, an enhanced electrons blockage is expected. Therefore, the significant reduction in the resistivity is attributed to the effects of fairly pinched spherulites, mixture of large and small spherulites (Fig. 5), or non-uniform dispersed PCL droplets [Fig. 2(a)] which act as electrically conducting pathways.
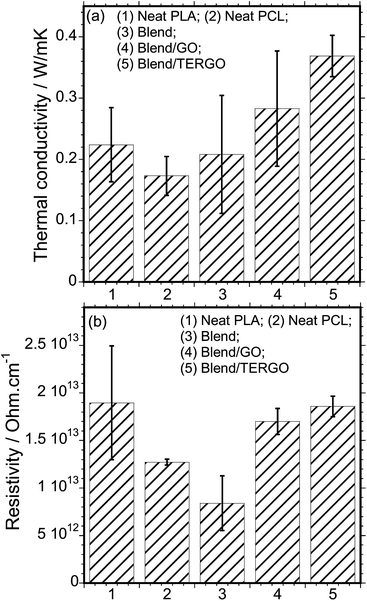 | ||
| Fig. 4 (a) The thermal conductivity and (b) the electrical resistivity behaviors of neat PLA, PCL, blend, GO- or TERGO-filled blend composites. The filler loading was fixed at 0.05 wt%. | ||
It is evident that the TERGO-filled blend composite exhibited the highest thermal conductivity value, which is significantly higher than those of the neat blend and the GO-filled blend composite as well as those of the neat PLA and PCL, due to high frequency phonon and few layers of graphene sheets as results of high temperature treatment.29,30 Again, the error bars of the TERGO-filled blend composite were significantly smaller than the neat blend and the GO-filled blend composite. This confirms that the PCL droplets are uniformly dispersed in the PLA matrix [Fig. 2(c)] because of the strong affinity of the TERGO particles towards the PCL phase and the self-controllable homogeneous dispersion of the TERGO particles [Fig. 2(e)]. The attained uniform surface morphology and the predominance of TERGO particles in the PCL minor phase give rise to particle–particle interactions that lead to more phonon scattering interfaces and short distance phonon transportation within the blend, increasing the thermal conductivity and the resistivity simultaneously.
However, the lower thermal conductivity of the GO-filled blend composite relative to the TERGO-filled composite is attributed to the insufficient phonon scattering interfaces at the boundaries and longer distances for GO particle–particle interactions in the system, which leads to smaller thermal contact areas. The unique electrical resistivity for GO-filled blend composite is attributed to the introduction of oxide groups, such as epoxy, hydroxyl or carboxyl [Fig. 1(a)]. They play the key role by trapping electrons, hence electrically insulating behaviour is notable.31 While the presences of few oxygenated sites on the TERGO particles act in the same way as those of GO particles, however the enhanced electrical resistivity of TERGO-filled blend composite relative to GO-filled blend composite is due to perfectly located TERGO particles in the PCL minor phase as well as poor electrical network and the use of PLA matrix pathway for electrical transport. Based on the obtained results, it is proposed that the thermal conductivity and the electrical resistivity characteristics are strongly influenced by the surface morphology, particle–particle filler interaction, volume ratio, and phonon scattering within the polymeric system.
To understand the thermal behavior of neat polymers, neat blend, and blend composite, DSC analyses were conducted and the second heating scans are shown in Fig. 5(d), while the characteristic parameters calculated from DSC thermograms are summarized in Table S1.† Neat PLA is characterized by high Tm value of 176.91 °C and Xc of approximately 59.42%, while neat PCL is characterized by low Tm of 55.48 °C and Xc of approximately 46.39%. The obtained melting profiles for neat PLA and PCL are in agreement with the published melting profiles of these individual polymers, (PLA32,33 and PCL34). In case of the blend, both PLA and PCL melting profiles are observed within the same range respective to their neat polymers, however the Xc of PLA slightly decreased to 58.30% while the one relative to PCL significantly decreased to 31.91%. The achieved melting profiles indicate immiscibility behavior of the blend, which is corroborating with SEM images (Fig. 2(a)). Upon the addition of GO and TERGO particles, the melting profiles of the composites shows similar melting values as that of neat blend (Table S1†). However, the presence of GO particles improved the Xc, while TERGO particles reduced the Xc relative to that of the neat blend. The change in Xc between the blend and its GO- or TERGO-filled composites suggests the alteration of spherulites size and arrangements (Fig. 5(a)–(c)) as well as the mobility of the polymer chains,35 which is justified by variation in melt viscosity (Fig. S2, ESI†).
4. Conclusions
In summary, the dispersed TERGO particles demonstrated the potential to fine-tune and stabilize the surface morphology of the PLA/PCL blend without significantly altering the tensile strength and the modulus. Such a stable morphology resulted in a notable improvement in the elongation at break of the TERGO-filled blend composite. The thermal conductivity and the electrical resistivity of the GO- and the TERGO-filled blend composites were increased relative to the neat blend. However, the TERGO-filled blend composite exhibited optimum values for both characteristics. Thus, lightweight, tough, and fairly flexible TERGO-filled blend composites have the potential for thermal management and other packaging applications, however, intensive studies still need to be conducted.Acknowledgements
The authors appreciate the financial support of the National Research Foundation, South Africa together with the University of Johannesburg and the Council for Scientific and Industrial Research, and further thank the staff of the DST-CSIR NCNSM characterization facility for their work on characterization.Notes and references
- R. Solomon, P. Sandborn and M. Pecht, IEEE Trans. Compon. Packag. Technol., 2000, 707–717 Search PubMed.
- S. G. Mosanenzadeh, S. Khalid, Y. Cui and H. E. Naguib, Polym. Compos., 2016, 37, 2196–2205 CrossRef CAS.
- H. Ding, Y. Guo and S. N. Leung, J. Appl. Polym. Sci., 2016, 133 DOI:10.1002/app.42910..
- M. T. Sebastian, Int. J. Appl. Ceram. Technol., 2010, 7, 415–434 CAS.
- G. Subodh, C. Pavithran, P. Mohanan and M. T. Sebastian, J. Eur. Ceram. Soc., 2007, 27, 3039–3044 CrossRef CAS.
- J. Gu, X. Yang, Z. Lv, N. Li, C. Liang and Q. Zhang, Int. J. Heat Mass Transfer, 2016, 92, 15–22 CrossRef CAS.
- R. K. Goyal, P. Jadhav and A. N. Tiwari, J. Electron. Mater., 2011, 40, 1377–1383 CrossRef CAS.
- S. S. Ray, K. Yamada, A. Ogami, M. Okamoto and K. Ueda, Macromol. Mater. Eng., 2002, 23, 943–947 CAS.
- J. Huang, Y. Zhu, L. Xu, J. Chen, W. Jiang and X. Nie, Compos. Sci. Technol., 2016, 129, 160–165 CrossRef CAS.
- X. Huang, C. Zhi and P. Jiang, J. Phys. Chem. C, 2012, 116, 23812–23820 Search PubMed.
- K. M. F. Shahil and A. A. Balandin, Nano Lett., 2012, 12, 861–867 CrossRef CAS PubMed.
- J. D. Renteria, D. L. Nika and A. A. Balandin, Appl. Sci., 2014, 4, 525–547 CrossRef.
- D. L. Nika and A. A. Balandin, J. Phys.: Condens. Matter, 2012, 24, 233203 CrossRef PubMed.
- A. A. Balandin, Nat. Mater., 2011, 10, 569–581 CrossRef CAS PubMed.
- H. Ishida and S. Rimdusit, Thermochim. Acta, 1998, 320, 177–186 CrossRef CAS.
- M. Donnay, S. Tzavalas and E. Logakis, Compos. Sci. Technol., 2015, 110, 152–158 CrossRef CAS.
- V. Goyal and A. A. Balandin, Appl. Phys. Lett., 2012, 100, 073113 CrossRef.
- J. Wang, F. Ma and M. Sun, RSC Adv., 2017, 7, 16801–16822 RSC.
- F. You, X. Li, L. Zhang, D. Wang, C. Shi and Z. Dang, RSC Adv., 2017, 7, 6170–6178 RSC.
- D. C. Marcano, D. V. Kosynkin, J. M. Berlin, A. Sinitskii, Z. Sun, A. Slesarev, L. B. Alemany, W. Lu and J. M. Tour, ACS Nano, 2010, 4, 4806–4814 CrossRef CAS PubMed.
- J. Ramontja, S. S. Ray, S. K. Pillai and A. S. Luyt, Macromol. Mater. Eng., 2009, 294, 839–846 CrossRef CAS.
- K. K. Gupta, N. Pal, P. K. Mishra, P. Srivastava, S. Mohanty and P. Maiti, J. Biomed. Mater. Res., Part A, 2014, 102, 2600–2612 CrossRef PubMed.
- B. T. K. Sharmila, A. B. Nair, B. T. Abraham, P. M. S. Beegum and E. T. Thachil, Polymer, 2014, 55, 3614–3627 CrossRef.
- Y. Yan, T. Kuila, N. H. Kim and J. H. Lee, Carbon, 2014, 74, 195–206 CrossRef CAS.
- W. Chen, L. Yan and P. R. Bangal, Carbon, 2010, 48, 1146–1152 CrossRef CAS.
- A. C. Ferrari, J. C. Meyer, V. Scardaci, C. Casiraghi, M. Lazzeri, F. Mauri, S. Piscanec, D. Jiang, K. S. Novoselov, S. Roth and A. K. Geim, Phys. Rev. Lett., 2006, 97, 187401 CrossRef CAS PubMed.
- Y. Yan, T. Kuila, N. H. Kim and J. H. Lee, Carbon, 2014, 74, 195–206 CrossRef CAS.
- M. J. Mochane and A. S. Luyt, Polym. Eng. Sci., 2015, 55, 1255–1262 CAS.
- D. L. Nika and A. A. Balandin, Rep. Prog. Phys., 2017, 80, 036502 CrossRef PubMed.
- J. D. Renteria, S. Ramirez, M. Hoda, B. Alonso, A. Centeno, A. Zurutuza, A. I. Cocemasov, D. L. Nika and A. A. Balandin, Adv. Funct. Mater., 2015, 25, 4664–4672 CrossRef CAS.
- P. K. S. Mural, M. Sharma, G. Madras and S. Bose, RSC Adv., 2015, 5, 32078–32087 RSC.
- A. K. Matta, R. U. Rao, K. N. S. Suman and V. Rambabu, Procedia Mater. Sci., 2014, 6, 1266–1270 CrossRef CAS.
- V. Ojijo, S. S. Ray and R. Sadiku, ACS Appl. Mater. Interfaces, 2012, 4, 2395–2405 CAS.
- S. C. Agwuncha, S. S. Ray, J. Jayaramudu, C. Khoathane and R. Sadiku, Macromol. Mater. Eng., 2015, 300, 31–47 CrossRef CAS.
- M. J. Hato, S. S. Ray and A. S. Luyt, Macromol. Mater. Eng., 2008, 293, 752–762 CrossRef CAS.
Footnote |
| † Electronic supplementary information (ESI) available: Synthesis of GO, selection of blend ratio, melt-state rheology and DSC data. See DOI: 10.1039/c7ra05421a |
| This journal is © The Royal Society of Chemistry 2017 |

