 Open Access Article
Creative Commons Attribution 3.0 Unported Licence
Enhancing the rate performance of spherical LiFeBO3/C via Cr doping
X. X. Dong,
C. Y. Huang,
Q. Jin,
J. Zhou,
P. Feng,
F. Y. Shi and
D. Y. Zhang *
*
School of Material Science and Engineering, Shanghai Institute of Technology, Shanghai 201418, China. E-mail: dyz@sit.edu.cn
First published on 5th July 2017
Abstract
Spherical LiFe1−xCrxBO3/C (x = 0, 0.005, 0.008) has been successfully synthesized by ball-milling and spray-drying assisted high-temperature solid-state reaction. The effect of Cr doping on LiFeBO3/C is characterized by XRD, energy-dispersive X-ray spectroscopy (EDS) and XPS. The results show that LiFe0.995Cr0.005BO3/C delivers the highest initial discharge specific capacity of 196.3 mA h g−1 at 0.1C and superior rate capability of 90 mA h g−1 at 5C. Moreover the material presents a cyclic retention of 95% after 50 cycles at 1C. Such improvement in the electrochemical performance can be attributed to the high electronic conductivities (4.75 × 10⁻⁵ S cm−1) and Li ion diffusion coefficients (9.20 × 10⁻¹³ cm2 s−1). The introduction of supervalent Cr3+ into the LiFeBO3 lattice produces Fe vacancies with accompanying conduction electrons, which lead to the enhanced electronic conductivity and Li ion diffusion coefficient.
1. Introduction
In recent years olivine LiFePO4 has been deeply researched and dominates most vehicle markets due to its safety, potentially low cost and environmental benignity, but the low theoretical capacity of LiFePO4 cannot sufficiently meet the requirements for high-energy density applications. Besides phosphates, the other polyanion-type cathode materials, including borates, silicates and titanates, have attracted great attention.1–7 Among them, LiFeBO3 has been regarded as a promising cathode alternative for lithium ion batteries due to its higher theoretical capacity (220 mA h g−1), higher electrical conductivity (3.9 × 10⁻⁷ S cm−1) and smaller volume change (2%) than those of the LiFePO4.The electrochemical performance of LiFeBO3 was firstly reported by Legagneur et al., and the poor electrical conductivity and low ionic conductivity of the pristine LiFeBO3 hindered its performance.8 Yamada et al. made great progress in the electrochemical performance of LiFeBO3, which arrived at a capacity of >190 mA h g−1 at 0.05C, by introducing ketchen black and vapor grown carbon fibers to increase its electrical conductivity.9 They claimed that the significant positive impact was realized by avoiding the surface poisoning of LiFeBO3 resulting from contact with moisture in the air. Meanwhile, Khalifah et al. demonstrated that the moisture in the air may poison the surface of LiFeBO3 particles and induce severe degradation of electrochemical properties.10 Carbon coating was proved to enhance the electrical conductivity of LiFeBO3 as well as prevent it from air exposure.4,11,12 Multi-layer core–shell structural LiFeBO3/C, synthesized by sol–gel method, presented an initial discharge specific capacity of 196.5 mA h g−1 at 0.05C, which dropped to 136.1 mA h g−1 after 30 cycles.4 Moreover, its discharge specific capacity dropped to 120 mA h g−1 at 0.25C. Thus, the rate and cycle performance were considered to be severe challenges. Both particle size reducing and cation doping methods were investigated to improve the electrochemical performance of LiFeBO3.13–17 Recently, Chen et al. reported that nano-sized LiFeBO3/C mesoporous hollow spheres delivered not only a high initial reversible capacity of 190 mA h g−1 at 0.05C, but also superior rate capability (80 mA h g−1) up to 4C, even delivered a discharge capability of 69 mA h g−1 at 8C.13 It was attributed to the high Li ion diffusion resulting from its nano-size particles, high surface area and large pore volume. The similar results also had been reported by Zhang et al. about nano-sized LiMnBO3/C.14 Yamada and co-workers found that the electrochemical properties of Li(MnxFe1−x)BO3 decreased with the Mn content increasing.15 The result was not consistent with the expected. Cation doping had been proved to be an efficient way to increase the rate performance of LiFePO4.18–21 Wang et al. reported that the rate capability and cyclic stability of LiFePO4 were greatly enhanced by bivalent cation (Ni, Co or Mg) doping at Fe-site.18 They attributed the significant improvement in electrochemical performance to the enhanced electronic conductivities and probably the mobility of Li ions in the doped samples. Park et al. noted Cr doping facilitates Li ion diffusion during the charge–discharge cycles.19 However, few works had been done to improve the rate performance of LiFeBO3 by Cr doping.
In this paper, LiFe1−xCrxBO3/C (x = 0, 0.005, 0.008) was prepared by ball-milling and spray-drying assisted high-temperature solid-state reaction. Ball-milling is an effective method for obtaining homogeneous mixture of raw materials and controlling the size of primary particle. Spray-drying is easy to obtain spherical particles. Ball-milling and spray-drying technique offers a simple, cheap and a robust way to prepare LiFeBO3/C. The effects of Cr doping on the electrochemical properties of LiFeBO3 were investigated.
2. Experimental
The LiFe1−xCrxBO3/C (x = 0, 0.005, 0.008) samples were synthesized by a solid-state reaction. LiOH·H2O, FeC2O4·2H2O, H3BO3, Cr2O3 and caramel were used as raw materials. All raw materials were mixed by ball milling at a speed of 600 rpm for 3 h with 0.4 mm ZrO2 beads as the grinding media, and finally a green suspension was generated. Then, the suspension was dried by a spray dryer and spherical precursor was obtained. At last, the as-prepared precursor were transferred into a tube furnace and sintered at 550 °C for 7 h under the N2 atmosphere to yield LiFe1−xCrxBO3/C (x = 0, 0.005, 0.008) samples.Phase identification was performed by X-ray powder diffraction measurement (XRD, Bruker D8 Focus diffractometer) with Cu Kα radiation (0.1541 nm) at a scanning rate of 0.01° per second in the 2θ range from 10° to 70°. The morphologies of the samples were monitored by a scanning electron microscope (SEM, JEOL, JSM-6700F) and a transmission electron microscope (TEM, JEOL JEM-2100). The chemical composition was determined by energy dispersive X-ray spectroscopy (EDS, Bruker, XFlash 4010). X-ray photoelectron spectroscopy (XPS, Kratos Axis Ultra DLD) with Al Kα radiation was employed to measure the state of each element in the surface. Elemental carbon analysis of sample was performed by C–S analysis equipment (HIR-944B). The electronic conductivities of the cylindrical pellets with a diameter of 10 mm of the synthesized samples were measured at room temperature using a powder resistivity tester (FT-300/301) under a pressure range of 2 to 22 MPa and a resistivity range of 10−4 Ω cm to 2 × 10⁵ Ω cm.
The electrochemical characterizations were performed using CR2016 coin-type cell. The working electrodes were fabricated by mixing the active material (LiFe1−xCrxBO3/C, x = 0, 0.005, 0.008), super P and polyvinylidene fluoride (PVDF) binder in a weight ratio of 8![[thin space (1/6-em)]](https://www.rsc.org/images/entities/char_2009.gif) :
:![[thin space (1/6-em)]](https://www.rsc.org/images/entities/char_2009.gif) 1
1![[thin space (1/6-em)]](https://www.rsc.org/images/entities/char_2009.gif) :
:![[thin space (1/6-em)]](https://www.rsc.org/images/entities/char_2009.gif) 1 in N methyl-2-pyrrolidone (NMP). The mixed slurry was coated uniformly on aluminium foil, dried in the vacuum for 4 h at 120 °C. Then electrodes pressed into pellets of 12 mm in diameter where about 6 mg of active materials was hold on it. Two-electrode electrochemical cells were assembled in a glove box filled with high-purity argon where LiFe1−xCrxBO3/C (x = 0, 0.005, 0.008) electrodes as a cathode, the lithium metal foil was used as an anode, Celgard2320 as separator and 1 M LiPF6 in EC
1 in N methyl-2-pyrrolidone (NMP). The mixed slurry was coated uniformly on aluminium foil, dried in the vacuum for 4 h at 120 °C. Then electrodes pressed into pellets of 12 mm in diameter where about 6 mg of active materials was hold on it. Two-electrode electrochemical cells were assembled in a glove box filled with high-purity argon where LiFe1−xCrxBO3/C (x = 0, 0.005, 0.008) electrodes as a cathode, the lithium metal foil was used as an anode, Celgard2320 as separator and 1 M LiPF6 in EC![[thin space (1/6-em)]](https://www.rsc.org/images/entities/char_2009.gif) :
:![[thin space (1/6-em)]](https://www.rsc.org/images/entities/char_2009.gif) DMC (1
DMC (1![[thin space (1/6-em)]](https://www.rsc.org/images/entities/char_2009.gif) :
:![[thin space (1/6-em)]](https://www.rsc.org/images/entities/char_2009.gif) 1 vol%) were used as an electrolyte. The electrochemical measurements were performed by Land Battery Testers (LAND-CT2001A) in the voltage range between 1.5 and 4.5 V. Constant-current and constant-voltage (CC–CV) charging methods were used to measure the capacity of LiFe1−xCrxBO3/C (x = 0, 0.005, 0.008). The cells were first galvanostatically charged at 0.1C (1C = 220 mA g−1) to 4.5 V, then charged at constant voltage of 4.5 V until the current decay below 0.05C, finally the cells were discharged to 1.5 V at a current rate of 0.1C. The rate performance was performed by charging and discharging at various rates ranging from 0.1C to 5C. The electrochemical impedance spectroscopy (EIS) measurements were conducted using electrochemical workstation (Autolab PGSTAT302N). The frequency range was 10−2 to 105 Hz, and the amplitude was 5 mV. It should be pointed out that all the electrochemical measurements were performed at room temperature (25 °C).
1 vol%) were used as an electrolyte. The electrochemical measurements were performed by Land Battery Testers (LAND-CT2001A) in the voltage range between 1.5 and 4.5 V. Constant-current and constant-voltage (CC–CV) charging methods were used to measure the capacity of LiFe1−xCrxBO3/C (x = 0, 0.005, 0.008). The cells were first galvanostatically charged at 0.1C (1C = 220 mA g−1) to 4.5 V, then charged at constant voltage of 4.5 V until the current decay below 0.05C, finally the cells were discharged to 1.5 V at a current rate of 0.1C. The rate performance was performed by charging and discharging at various rates ranging from 0.1C to 5C. The electrochemical impedance spectroscopy (EIS) measurements were conducted using electrochemical workstation (Autolab PGSTAT302N). The frequency range was 10−2 to 105 Hz, and the amplitude was 5 mV. It should be pointed out that all the electrochemical measurements were performed at room temperature (25 °C).
3. Results and discussion
Fig. 1(a) shows the XRD patterns of all the LiFe1−xCrxBO3/C (x = 0, 0.005, 0.008) samples. Compared with the XRD pattern of the LiFeBO3/C sample, the XRD patterns of the Cr-doped samples do not exhibit extra reflections. All of the diffraction peaks of the samples could be indexed into the monoclinic LiFeBO3 (PDF card #00-054-0026) with space group of C2/c. Fig. 1(b) shows the peak shift toward larger angles in the XRD data induced by Cr doping, which indicated the change of the lattice parameter. The lattice parameters of the LiFe1−xCrxBO3/C (x = 0, 0.005, 0.008) samples are calculated by MDI Jade 9.0 software, and the results are listed in Table 1. As can be seen from the Table 1, the unit cell volume of LiFeBO3/C is contract with the increasing of Cr doping. The radius of Cr (0.64 Å) is smaller than that of Fe (0.74 Å). Thus, the lattice contracted after Cr doping, which is in accordance with the results reported by Gan et al.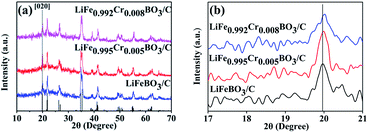 | ||
| Fig. 1 (a) XRD patterns of LiFe1−xCrxBO3 (x = 0, 0.005, 0.008); (b) the peak shift of [020] lattice plane. | ||
| Sample | a (nm) | b (nm) | c (nm) | V (nm3) |
|---|---|---|---|---|
| x = 0 | 0.51533 | 0.89074 | 1.01946 | 0.4679 |
| x = 0.005 | 0.51524 | 0.89065 | 1.01895 | 0.4675 |
| x = 0.008 | 0.51479 | 0.88853 | 1.02121 | 0.4670 |
The morphology of the LiFe0.995Cr0.005BO3/C sample was observed via SEM, as shown in Fig. 2(a) and (b) presents similar spherical particles with a size distribution ranging from 5 μm to 10 μm. As shown in Fig. 2(c), the spherical particles are actually an aggregation of a lot of smaller primary particles. Fig. 2(d) shows an enlarged image of the LiFe0.995Cr0.005BO3/C sample. The surface of the primary particles may covered by gel-liked carbon, which forms a network among primary particles to improve the electrical conductivity of the sample. Furthermore, there are a large number of micro pores among the primary particles. This microporous structure can provide sufficient space for electrolyte penetrating and increase the electrode–electrolyte interface area, which may enhance the Li ion diffusion coefficient. So the LiFe0.995Cr0.005BO3/C sample tends to deliver excellent electrochemical performance.
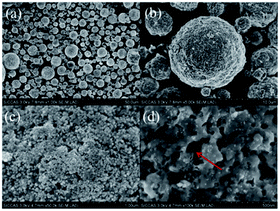 | ||
| Fig. 2 (a and b) Low-magnification and (c and d) high-magnification SEM images of the LiFe0.995Cr0.005BO3/C. | ||
A Bruker-AXS 133 eV XFlash 4010 Detector attached to the SEM is used to observe the elemental distribution of LiFe0.995Cr0.005BO3/C. As shown in Fig. 3, different colours represent different elements. The results illustrate that the elements (O, Cr and Fe) are uniformly distributed in the LiFe0.995Cr0.005BO3/C samples. Combined with the XRD results, it can be inferred that the Cr probably enters the structure of LiFeBO3 to form a solid solution.
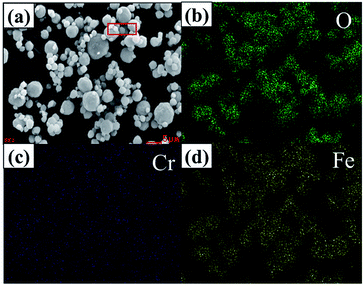 | ||
| Fig. 3 EDS mapping of the LiFe0.995Cr0.005BO3/C sample: (a) sample images of the selective area (b) O, (c) Cr, (d) Fe. | ||
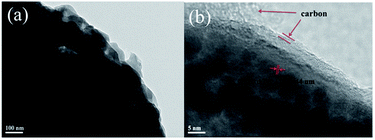
To observe the morphology of carbon layer of the LiFe0.995Cr0.005BO3/C, TEM images are presented in Fig. 4. As shown in Fig. 4(a), the darker spherical particles are well wrapped by flocculent layer. According to the further enlarged image as shown Fig. 4(b), the d spacing value (0.4406 nm) in the darker spherical particles consist with the [011] lattice spacing of LiFeBO3, which indicates the sample are highly crystalline. The flocculent layer is contributed to amorphous carbon. This amorphous carbon layer may prevent LiFe0.995Cr0.005BO3/C from surface poisoning when it exposed in the moisture air. The amount of carbon in the LiFe0.995Cr0.005BO3/C is about 3.0 wt% determined by C–S analysis method.
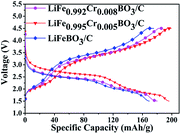
Typical charge–discharge curves cycled in the voltage range between 1.5–4.5 V at ambient temperature conditions are shown in Fig. 5. The LiFeBO3/C can deliver an initial discharge specific capacity of 169.4 mA h g−1 at 0.1C (1C = 220 mA g−1). The LiFe0.995Cr0.005BO3/C sample exhibits an initial discharge specific capacity of 196.3 mA h g−1 at 0.1C. This value is better than most previous reports.4,13,15–17 The significant enhancement may result from the improvement of electronic/ionic conductivity of LiFeBO3/C by Cr doping.19 However, the capacity increasing phenomenon is not maintained with further increase in Cr doping concentration. The discharge specific capacity for LiFe0.992Cr0.008BO3/C is 178.2 mA h g−1. Therefore, the optimal Cr doping amount is 0.5% in the LiFeBO3/C.
The cycling and rate performance of the LiFeBO3/C and LiFe0.995Cr0.005BO3/C samples are shown in Fig. 6(a) compares the cycling performances of LiFeBO3/C and LiFe0.995Cr0.005BO3/C at 1C. LiFeBO3/C can deliver an initial discharge specific capacity of 141.2 mA h g−1 with 89% capacity retention after 50 cycles at 1C. It is better than the result of the mesoporous hollow spheres LiFeBO3/C, 139 mA h g−1 at 1C, reported by Chen et al.13 Compared with LiFeBO3/C, the LiFe0.995Cr0.005BO3/C exhibits higher discharge specific capacity of 161.9 mA h g−1 with higher capacity retention of 95% after 50 cycles at 1C. It indicates that Cr doping could improve the cyclic stability of LiFeBO3/C. The discharge capacity of the LiFeBO3/C and LiFe0.995Cr0.005BO3/C samples at various rate, i.e., C/10, C/2, 1C, 2C and 5C, in the voltage range of 1.5–4.5 V are shown in Fig. 6(b). Overall, the discharge capacity of the LiFe0.995Cr0.005BO3/C is higher than that of LiFeBO3/C. With the discharge rate increasing, the superiority of the LiFe0.995Cr0.005BO3/C becomes more pronounced. When the rate is as high as 5C, the discharge specific capacity of the LiFe0.995Cr0.005BO3/C still remains 91.8 mA h g−1. Chen et al. reported that nano-sized LiFeBO3/C mesoporous hollow spheres delivered only a discharge specific capacity of 80 mA h g−1 at 4C.13 While, the discharge specific capacity of the LiFeBO3/C is only 28 mA h g−1 at 5C. The results confirmed that Cr doping could effectively enhance the rate performance of LiFeBO3/C, which may contribute to the improvement of ionic conductivity.
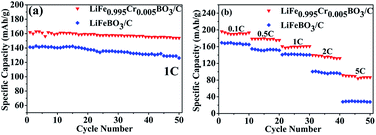 | ||
| Fig. 6 (a) Cycling performances of the LiFeBO3/C and the LiFe0.995Cr0.005BO3/C at 1C, (b) cycling performance of the LiFeBO3/C and the LiFe0.995Cr0.005BO3/C at various rates from 0.1C to 5C. | ||
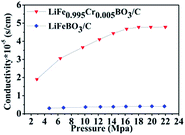
To gain further insight into the essence of improvement in electrochemical properties, a comparison between the electric conductivity for the LiFeBO3/C and LiFe0.995Cr0.005BO3/C samples is shown in Fig. 7. The electric conductivity of LiFe0.995Cr0.005BO3/C powder is calculated as 4.75 × 10⁻⁵ S cm−1, while the value for LiFeBO3/C powder is only 4.15 × 10⁻⁶ S cm−1. Apparently, Cr doping can improve the electronic conductivity resulting in better electrochemical properties. The result was in accordance with the enhanced LiFePO4 by Fe-site doping.18
In order to verify the influence of Cr doping on the Li ions diffusion coefficient, electrochemical impedance spectroscopy (EIS) measurements of LiFeBO3/C and LiFe0.995Cr0.005BO3/C were performed. Before EIS measurements, several preliminary galvanostatic cycles were performed for stable SEI film formation and the good permeation of the electrolyte into the active material. Fig. 8(a) shows the Nyquist and fitting plots of LiFe0.995Cr0.005BO3/C and LiFeBO3/C samples after 10 cycles at 0.1C, and the equivalent circuits shown in the inset of Fig. 8(a). As shown in Fig. 8(a), all the curves consist of a single semicircle in the high frequency region and an inclined line at low frequency region. The intercept on the Z′ axis in the high frequency region corresponds to the ohmic resistance (Rs) of electrolyte, the semicircle in the high-to-medium frequency range is related to the charge transfer resistance (Rct) on the interface of the electrolyte/electrode. As shown in Table 2, the simulation parameters of the equivalent circuit are obtained by electrochemical workstation (Autolab PGSTAT302N). The charge-transfer resistance (Rct) of LiFe0.995Cr0.005BO3/C electrode is 54.5 Ω, much smaller than that of the pristine LiFeBO3/C (∼215 Ω), indicating that the charge transfer at the electrolyte/electrode interface is greatly enhanced by Cr doping. The result is consistent with electric conductivity test (Fig. 7), which proved that the Cr doping can greatly improve the conductivity of LiFe0.995Cr0.005BO3/C sample and thus enhance the electron transport during the lithiation/delithiation reaction. The sloping line at low frequency is associated with the diffusion in the solid phase. The lithium ion diffusion coefficient can be calculated from the formula (1) as following
 | (1) |
 | (2) |
![[thin space (1/6-em)]](https://www.rsc.org/images/entities/char_2009.gif) 500 C mol−1 and 8.314 J K−1 mol−1, respectively. A is the electrode area, which is 1.13 × 10⁻⁴ m2, n is 1, T is 298 K, C can be calculated from the density and the molecular weight of the materials synthesized by different methods, which are 2.8 × 10⁴ mol m−3 in our case.22
500 C mol−1 and 8.314 J K−1 mol−1, respectively. A is the electrode area, which is 1.13 × 10⁻⁴ m2, n is 1, T is 298 K, C can be calculated from the density and the molecular weight of the materials synthesized by different methods, which are 2.8 × 10⁴ mol m−3 in our case.22
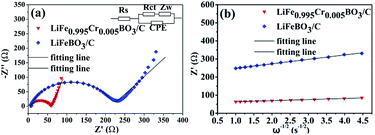 | ||
| Fig. 8 (a) The EIS and fitting plots of the LiFeBO3/C and the LiFe0.995Cr0.005BO3/C after 10 cycles at 0.1C, (b) the relationship between Z′ and ω−1/2 in low frequency. | ||
| Electrode | Rs (Ω) | Rct (Ω) | D (cm2 s−1) |
|---|---|---|---|
| LiFeBO3/C | 6.65 | 215 | 5.94 × 10⁻¹⁴ |
| LiFe0.995Cr0.005BO3/C | 5.64 | 54.5 | 9.20 × 10⁻¹³ |
According to formula (1) and (2), Li ion diffusion coefficients (DLi) of the LiFeBO3/C and LiFe0.995Cr0.005BO3/C are calculated separately, which are 5.92 × 10⁻¹⁴ cm2 s−1 and 9.20 × 10⁻¹³ cm2 s−1. The DLi of the LiFe0.995Cr0.005BO3/C is about one order of magnitude higher than that of the pristine LiFeBO3/C. It may be attributed to the chemistry defect in the lattice resulting from balancing the valence difference brought in by the Cr doping.23 The considerable improvement of the DLi of LiFeBO3/C directly leads to the enhancement of rate performance.
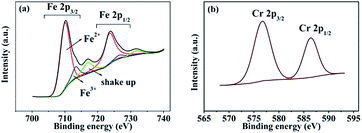
XPS measurements were performed to determine the chemical states of the LiFe0.995Cr0.005BO3/C sample. Fig. 9(a) and (b) present the XPS spectra of the Fe 2p and Cr 2p, respectively. The Fe 2p orbital is clearly resolved into Fe (2p3/2) and Fe (2p1/2) contributions, centred upon 709.9 eV, 713.2 eV 723.4 eV and 725.9 eV, respectively. The binding energies 709.9 eV and 713.2 eV correspond to the characteristic peak of Fe2+ and Fe3+, respectively. The apparent weak of shake up feature in high-resolution spectrum for Fe as shown in Fig. 9(a) suggests that all Fe atoms are in the structure of LiFeBO3.24 The content of Fe3+ is about 10%, which may contribute to the preparation process. The Cr 2p orbital is clearly resolved into Cr (2p3/2) and Cr (2p1/2) contributions, centred upon 576.7 eV, 586.4 eV. The peak of 576.7 eV in Cr (2p3/2) corresponds to the characteristic peak Cr3+. Owing to the supervalent Cr3+ is doped in LiFeBO3 at Fe sites, Fe vacancies would be produced to balance the valence.25 The following short equation (using Kröger–Vink notation26) describes the valence balance model:
 | (3) |
Cr doping increases the concentration of ionic vacancies according to formula (3). Basing on formula (3), two Cr atoms could substitute three Fe atoms. Thus, to maintain neutrality of the lattice in LiFeBO3, conduction electrons are produced locally to balance the Cr3+.27 It facilitates the Li ion diffusivity and electron conduction during the charge–discharge process.19,20
4. Conclusions
LiFe1−xCrxBO3/C (x = 0, 0.005, 0.008) were prepared by via ball-milling and spray-drying assisted high-temperature solid-state reaction. Cr element was proved to disperse uniformly in the samples and enter the structure of the monoclinic LiFeBO3 forming a solid solution. In the SEM and TEM images, LiFe0.995Cr0.005BO3 particles were covered by amorphous carbon layer, which form a conductive network. It was found that Cr doping played an important role in promoting the electrochemical performance. LiFe0.995Cr0.005BO3 showed the highest discharge capacity of 196.3 mA h g−1 at 0.1C, which was 26.9 mA h g−1 higher than that of the LiFeBO3/C. The cyclic retention of LiFe0.995Cr0.005BO3/C was 95% after 50 cycles at 1C, which was much better than that of the LiFeBO3/C (89%). Cr doping improved the rate performance of the LiFeBO3/C as well. The discharge capacity of the LiFe0.995Cr0.005BO3/C was 91.8 mA h g−1 at 5C, which was 3.27 times than that of the LiFeBO3/C (28 mA h g−1). The electrochemical performance improvement of the LiFeBO3/C by Cr doping was attributed to both the high electronic conductivities (4.75 × 10⁻⁵ S cm−1) and fast Li ion diffusion coefficients (9.20 × 10⁻¹³ cm2 s−1) of the LiFe0.995Cr0.005BO3/C. Basing on the XPS results, the mechanism of Cr doping was analysed. The supervalent Cr3+ doping would produce Fe vacancies with accompanying conduction electrons to maintain neutrality of the lattice in LiFeBO3, which lead to the improvement of electronic conductivities and DLi.Acknowledgements
We gratefully acknowledge the financial support by the Innovation Program of Shanghai Municipal education commission (15ZZ095) and the Science and Technology Commission of Shanghai Municipality (14520503100).References
- Z. A. Zhang, Z. Y. Zhang, W. Chen and G. C. Wang, et al., New J. Chem., 2015, 39, 3765–3769 RSC.
- J. C. Zheng, Y. D. Han, D. Sun, B. Zhang and E. J. Cairns, Energy Storage Materials, 2017, 7, 48–55 CrossRef.
- A. P. Tang, D. H. He, Z. Q. He and G. R. Xu, et al., J. Power Sources, 2015, 275, 888–892 CrossRef CAS.
- B. Zhang, L. Ming, J. C. Zheng and J. F. Zhang, et al., J. Power Sources, 2014, 261, 249–254 CrossRef CAS.
- Y. Z. Dong, Y. M. Zhao, Z. D. Shi, X. N. An, P. Fu and L. Chen, Electrochim. Acta, 2008, 53, 2339–2345 CrossRef CAS.
- K. Wang, W. j. Ren, J. L. Yang, R. Tan, Y. D. Liu and F. Pan, RSC Adv., 2016, 6, 47723–47729 RSC.
- L. Sebastian and J. Gopalakrishnan, J. Solid State Chem., 2003, 172, 171–177 CrossRef CAS.
- V. Legagneur, Y. An, A. Mosbah and R. Portal, et al., Solid State Ionics, 2001, 139, 37–46 CrossRef CAS.
- A. Yamada, N. Iwane, Y. Harada, S. I. Nishimura, Y. Koyama and I. Tanaka, Adv. Mater., 2010, 22, 3583–3587 CrossRef CAS PubMed.
- S. H. Bo, F. Wang, Y. Janssen, D. Zeng, K. W. Name, W. Xu, L. S. Du, J. Graetz, X. Q. Yang, Y. Zhu, J. B. Parise, C. P. Grey and P. G. Khalifah, J. Mater. Chem., 2012, 22, 8799–8809 RSC.
- P. Barpanda, Y. Yamashita, Y. Yamada and A. Yamada, J. Electrochem. Soc., 2013, 160, A3095–A3099 CrossRef CAS.
- L. Tao, G. Rousse, J. N. Chotard and L. Dupont, et al., J. Mater. Chem. A, 2014, 2, 2060–2070 CAS.
- Z. X. Chen, L. F. Cao, L. Chen, H. H. Zhou and C. M. Zheng, et al., J. Power Sources, 2015, 298, 355–362 CrossRef CAS.
- J. C. Zheng, S. E. Qin, B. Zhang, X. Ou, L. Ming and C. Shen, Chem. Lett., 2014, 43, 1411–1413 CrossRef CAS.
- A. Yamada, N. Iwane, S. I. Nishimura, Y. Koyama and I. Tanaka, J. Mater. Chem., 2011, 22, 10690–10696 RSC.
- Z. P. Li, Y. P. Wang, Q. R. Hu, Y. Yang, Z. C. Wu and C. M. Ban, J. Nanosci. Nanotechnol., 2015, 15, 7186–7190 CrossRef CAS PubMed.
- M. A. Cambaz, M. A. Reddy, B. P. Vinayan and R. Witte, et al., ACS Appl. Mater. Interfaces, 2016, 8, 2166–2172 CAS.
- D. Y. Wang, H. Li, S. Q. Shi, X. J. Huang and L. Q. Chen, Electrochim. Acta, 2005, 50, 2955–2958 CrossRef CAS.
- C. K. Park, S. B. Park, H. C. Shin, W. Cho and H. Jang, Bull. Korean Chem. Soc., 2011, 32, 191–195 CrossRef CAS.
- H. C. Shin, S. B. Park, H. Jang, K. Y. Chung, W. I. Cho, C. S. Kim and B. W. Cho, Electrochim. Acta, 2008, 53, 7946–7951 CrossRef CAS.
- Y. X. Wen, L. M. Zeng, Z. F. Tong, L. Q. Nong and W. X. Wei, J. Alloys Compd., 2006, 416, 206–208 CrossRef CAS.
- X. Y. Wang, H. Hao, J. L. Liu, T. Huang and A. S. Yu, Electrochim. Acta, 2011, 56, 4065–4069 CrossRef CAS.
- Y. Gan, C. Chen, J. L. Liu, P. W. Bian, H. Hao and A. S. Yu, J. Alloys Compd., 2015, 620, 350–357 CrossRef CAS.
- L. Y. Liu, Y. Cheng, Z. F. Liu, M. N. Ha, Q. S. Quo and Z. Zhao, RSC Adv., 2016, 6, 83814–83829 RSC.
- N. Meethong, Y. H. Kao, S. A. Speakman and Y. M. Chiang, Adv. Funct. Mater., 2009, 19, 1060–1070 CrossRef CAS.
- F. A. Kröger and H. J. Vink, Solid State Phys., 1956, 3, 307–435 Search PubMed.
- K. Haffe, Oxidation of Metals, Plenum Press, 1965 Search PubMed.
| This journal is © The Royal Society of Chemistry 2017 |

