 Open Access Article
Creative Commons Attribution 3.0 Unported Licence
Difunctional Cu-doped carbon dots: catalytic activity and fluorescence indication for the reduction reaction of p-nitrophenol†
Jinyan Du *,
Yun Zhao,
Juan Chen,
Ping Zhang,
Lingling Gao,
Meiqin Wang,
Cong Cao,
Wu Wen and
Changqing Zhu*
Anhui Key Laboratory of Chemo-Biosensing, Key Laboratory of Functional Molecular Solids, Ministry of Education, College of Chemistry and Materials Science, Anhui Normal University, Wuhu, 241000, PR China. E-mail: dujinyn@mail.ahnu.edu.cn; zhucq@mail.ahnu.edu.cn
First published on 5th July 2017
Abstract
Herein, we report the preparation of Cu-doped carbon dots (CDs) through a one-step hydrothermal carbonization using CuCl2·2H2O and ethylenediaminetetraacetic acid disodium salt dihydrate (EDTA) as precursors. As confirmed by Fourier transform infrared (FTIR) and X-ray photoelectron spectroscopy (XPS), the Cu species chelates with the carbon matrix through Cu–N complexes. Using p-nitrophenol reduction as a model reaction, the catalytic activity and performance as a fluorescence indicator in the catalytic process are further examined. Results show that the synergistic effect, which may stem from the highly efficient catalysis activity of Cu and the electron-enhanced effect from graphite-like CDs, is responsible for the catalytic activity of p-nitrophenol hydrogenation reaction with the pseudo-first-order rate constant being 1.2 × 10⁻² s−1. Interestingly, the catalyzed reduction process of p-nitrophenol can be tracked using fluorescence spectra of Cu-doped CDs by means of the Inner Filter Effect (IFE). The unique properties of the difunctional Cu-doped CD catalyst as well as the IFE sensing strategy will provide an ideal platform to monitor the catalytic processes.
1. Introduction
Catalytic reactions are a widespread type of chemical reaction in the natural world.1,2 Development of catalysts with excellent catalytic efficiency as well as trackable catalytic reaction dynamics is important in the research field of catalytic reactions. Within this, indication of catalytic reaction processes is of particular significance. At present, several schemes have been reported. For a system with absorbance changes, the absorption spectral changes of the reactants or products are used to monitor the catalytic process.3,4 If no absorbance change occurs in the system, the catalytic process is often tracked using spectrographic signals from additional chromogenic agents.5,6 Sometimes, the signals of chemical luminescence are used to indicate a catalytic process, i.e., for the luminol–H2O2 system.7,8 In fact, whether the spectrum signal changes or not, nuclear magnetic resonance (NMR) is a universal method that not only can track the catalytic reaction process, but also can capture the reaction mechanism.9,10 However, it is hard to use NMR for in situ, real-time and fast tracking of the catalytic reaction process. In all, these indication means are far from meeting the requirements where both good catalytic performance and sensitive indicative function are needed in the catalytic reactions. Moreover, it is noted that most of the current catalytic reaction process was monitored by the signals produced from the substrates or products. Can the catalytic reaction process be indicated by the catalyst's own signals?In recent years, due to low toxicity, good biocompatibility, excitation-dependent fluorescence feature and high resistance to photobleaching, luminescent carbon nanomaterials have been widely applied in the fields of sensing,11,12 biological images13,14 and drug release,15,16 etc. It is worth mentioning that fluorescence carbon dots (CDs) have an advantage of unique electron transfer, indicative of a great potential as catalyst. Extensive works related to the CDs as electrocatalyst/photocatalyst/redox catalysts or mimic enzymes have been reported.17–20 For instances, Qu et al.17 have reported that their as-prepared nitrogen-doped graphene quantum dots (N-GQDs) were able to be used as metal-free oxygen reduction reaction catalysts in fuel cells. Shi and coworkers18 demonstrated that the CDs have an intrinsic peroxidase-like activity to oxidation 3,3,5,5-tetramethylbenzidine (TMB) by hydrogen peroxide.
More interestingly, because of the modulation in the band structure, metal atom doping not only can improve the optical properties but also can vest novel functionalities to the CDs. For examples, hydrogen production efficiency are greatly enhanced with the doping of nickel because the absorbed UV and visible light can directly transfer its photoexcited electrons to solution.21 Doping with gadolinium was demonstrated to be used as a magnetic resonance imaging positive contrast agent.22 Moreover, Zn-doped CDs can be served as a fluorescent probe for the detection of H2O2 and glucose based on the Fenton reaction23 while doping with both Cu and N atoms can be acted as a novel photocatalyst because of the enhanced electron-accepting and donating ability.24 Inspired by these observations, herein, we report the preparation of Cu-doped CDs by a one-step hydrothermal carbonization of CuCl2·2H2O and ethylenediaminetetraacetic acid disodium salt dihydrate (EDTA). The catalytic reduction of p-nitrophenol in the presence of NaBH4 was chosen as a model reaction to investigate the catalytic activity of as-obtained Cu-doped CDs. On the basis of inner filter effect (IFE), the fluorescence excitation spectra of CDs were tuned to overlap with the absorption spectra of p-nitrophenol in the catalyzed system for investigating fluorescence indication performance to the catalytic reduction process of p-nitrophenol. Finally, the proposed catalytic mechanism and the rate of reaction were further investigated in detail.
2. Experimental section
2.1 Chemicals
The p-nitrophenol (99%) and sodium borohydride (NaBH4) were purchased from Alfa Aesar (Karlsruhe, Germany). Cupric chloride dihydrate (CuCl2·2H2O, 99%), ethylenediaminetetraacetic acid disodium salt dihydrate (EDTA, 98%) and other routine chemicals were acquired from Guoyao Chemical Reagent Company (Shanghai, China) and used as received without further purification. All solutions were prepared with ultrapure water (18.25 MΩ cm).2.2 Preparation of Cu-doped CDs
Typically, 1.0 g of EDTA and 0.458 g of CuCl2·2H2O were dispersed in 25 mL water by sonication for 0.5 h. Afterward the above mixture solution was transferred into a 50 mL Teflon-lined autoclave. Then the reaction system was sealed and heated from room temperature to 200 °C and kept at that temperature for 4 h. After the resultant solution was cooled to room temperature naturally, the products were collected by filtering, centrifuging and the as-collected supernatant was dialyzed in the dialysis bag (molecular weight: 500 kDa) for 24 h. The purified CDs were preserved at 4 °C for the following experiments.2.3 Preparation of bare CDs
The preparation process of the bare CDs is the same to the Cu-doped CDs while the only exception is that CuCl2·2H2O needs not to be added into the reaction system.2.4 Characterization
The morphology and microstructure were investigated by transmission electron microscopy (TEM, JEOL 2010, Japan). X-ray photoelectron spectroscopy (XPS) was measured on a thermoelectron instrument (Thermo-VG Scientific ESCALAB MK II). Elemental analysis was carried out by energy dispersive X-ray spectroscopy (EDS) conducted at the accelerating voltage of 200 kV on a Philips S-4800 instrument. UV-vis spectra of the samples were obtained on a Hitachi UV-2910 spectrophotometer. The fluorescence spectra were recorded with a Hitachi F-4600 fluorescence spectrophotometer. Fourier transform infrared (FTIR) spectra were carried out on a PerkinElmer PE-983 FTIR spectrophotometer.2.5 Catalytic assay toward p-nitrophenol reduction reaction
The reduction of p-nitrophenol by NaBH4 was chosen as a model reaction to investigate catalytic activity and indication performance of the prepared Cu-doped CDs. In a typical experiment, 1.0 mL of p-nitrophenol (3.0 × 10⁻⁴ mol L−1) and 1.0 mL of NaBH4 (3.0 × 10⁻² mol L−1) were introduced into a colorimetric tube and followed by adding different amount of Cu-doped CDs, and then diluted to 5 mL with Tris–HCl buffer solution (0.01 mol L−1, pH 4.0). The color of the solution changed gradually from yellow to transparent as the reaction proceeding. At the same time, the catalytic activity was monitored in situ on Hitachi UV-2910 spectrophotometer and Hitachi F-4600 fluorescence spectrophotometer.3. Results and discussion
3.1 Characterization of Cu-doped CDs
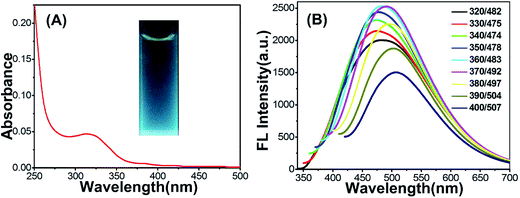
The Cu-doped CDs were synthesized according to the protocol described in the experimental section. As shown in Fig. 1A, optical absorption in the UV region was observed in the UV-vis absorption spectrum of Cu-doped CDs. In the inset of Fig. 1A, the Cu-doped CDs emitted bright blue light under UV light excitation (365 nm). From the fluorescent emission spectra of the Cu-doped CDs (Fig. 1B), the excitation-dependent fluorescence behavior were observed in the range from 350 to 700 nm, which is one of most special properties of CDs (the fluorescent emission spectra of bare CDs is shown in Fig. S1† for comparison).25,26 In addition, the average fluorescence quantum yield (QY) of the CDs in aqueous solution at room temperature was measured to be ∼6.1% using quinine sulfate as reference (QY of quinine sulfate is 54% at 370 nm excitation wavelength). This value is comparable with the result reported in the previous literatures for carbon dots.27–29The morphology of as-obtained Cu-doped CDs was characterized by TEM and high-resolution TEM (HRTEM, Fig. 2). As can be observed in Fig. 2, an average diameter of Cu-doped CDs is about 10.5 nm, which is larger than that of the bare CDs (an average diameter ∼3.5 nm, Fig. S2†). The HRTEM image (inset in Fig. 2A) displays a lattice fringe spacing of 0.201 nm, which may be attributed to the diffraction planes of sp2 graphitic carbon.30,31 FTIR spectrum was used to study the functional groups on the surface of CDs. As shown in Fig. 3A, the very strong absorption bands at 3386 cm−1 is ascribed to the stretching vibrations of O–H and N–H. The high-intensity peaks at 1624 cm−1, 1443 cm−1, and 1350 cm−1 correspond to the stretching vibrations of C![[double bond, length as m-dash]](https://www.rsc.org/images/entities/char_e001.gif) O, C–C and C–N.32 The FTIR spectrum from 900 to 1100 cm−1 was amplified to further characterize the chemical bond between the Cu and the matrix, as shown in Fig. 3B. Compared with the FTIR spectrum of bare CDs as shown in Fig. S3,† the new peaks at 1060 and 990 cm−1 can be assigned to N–Cu–N stretching vibrations, further confirming the formation of Cu coordination complexes in Cu-doped CDs.33
O, C–C and C–N.32 The FTIR spectrum from 900 to 1100 cm−1 was amplified to further characterize the chemical bond between the Cu and the matrix, as shown in Fig. 3B. Compared with the FTIR spectrum of bare CDs as shown in Fig. S3,† the new peaks at 1060 and 990 cm−1 can be assigned to N–Cu–N stretching vibrations, further confirming the formation of Cu coordination complexes in Cu-doped CDs.33
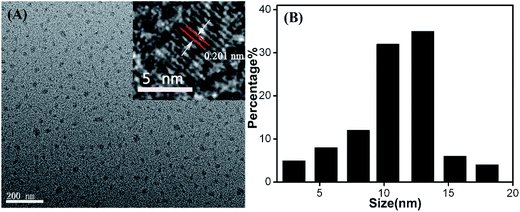 | ||
| Fig. 2 (A) TEM and HRTEM (inset) images of Cu-doped CDs. (B) Size distribution of Cu-doped CDs analyzed from multiple images. | ||
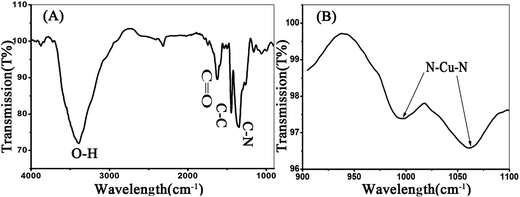 | ||
| Fig. 3 (A) FTIR spectrum of Cu-doped CDs. (B) Amplified FTIR spectrum at the region of 900 to 1100 cm−1. | ||
To confirm the composition of the Cu-doped CDs, X-ray spectroscopy (EDS) measurements were performed. EDS spectrum of Cu-doped CDs (Fig. S4†) presents the four elements of C, O, N, Cu from 0 to 1.5 keV. For a better insight, X-ray photoelectron spectroscopy (XPS) in the range of 0–980 eV was carried out. As shown in Fig. 4, the as-prepared CDs contain the elements of C, O, N, Cu with the percentage of 61.93%, 24.17%, 11.14% and 2.76%, respectively. The appearance of the C 1s peak (Fig. 4A) at 284.6, 285.7 and 287.1 eV, are attributed to C–C/C![[double bond, length as m-dash]](https://www.rsc.org/images/entities/char_e001.gif) C, C–O and C
C, C–O and C![[double bond, length as m-dash]](https://www.rsc.org/images/entities/char_e001.gif) O/C
O/C![[double bond, length as m-dash]](https://www.rsc.org/images/entities/char_e001.gif) N, respectively. And the O 1s spectrum (Fig. 4B) consisting of three peaks at 532.1, 532.6 and 533.8 eV, can be ascribed to C–O, C
N, respectively. And the O 1s spectrum (Fig. 4B) consisting of three peaks at 532.1, 532.6 and 533.8 eV, can be ascribed to C–O, C![[double bond, length as m-dash]](https://www.rsc.org/images/entities/char_e001.gif) O/N
O/N![[double bond, length as m-dash]](https://www.rsc.org/images/entities/char_e001.gif) O and O–C
O and O–C![[double bond, length as m-dash]](https://www.rsc.org/images/entities/char_e001.gif) O.34 In addition, the high-resolution N 1s spectrum (Fig. 4C) was mainly divided into three peaks at 398.2, 399.5 and 401.6 eV, which may be assigned to pyridinic, pyrrolic and quaternary-like environments. Compared with the XPS of bare CDs (Fig. S5†), the detailed Cu 2p spectrum (Fig. 4D) shows the presence of Cu in Cu-doped CDs (932.5, 952.5 eV) with corresponding to the spin–orbit splitting of Cu 2p3/2 and Cu 2p1/2, respectively, indicating the existence of CuII in as-prepared Cu-doped CDs.35,36
O.34 In addition, the high-resolution N 1s spectrum (Fig. 4C) was mainly divided into three peaks at 398.2, 399.5 and 401.6 eV, which may be assigned to pyridinic, pyrrolic and quaternary-like environments. Compared with the XPS of bare CDs (Fig. S5†), the detailed Cu 2p spectrum (Fig. 4D) shows the presence of Cu in Cu-doped CDs (932.5, 952.5 eV) with corresponding to the spin–orbit splitting of Cu 2p3/2 and Cu 2p1/2, respectively, indicating the existence of CuII in as-prepared Cu-doped CDs.35,36
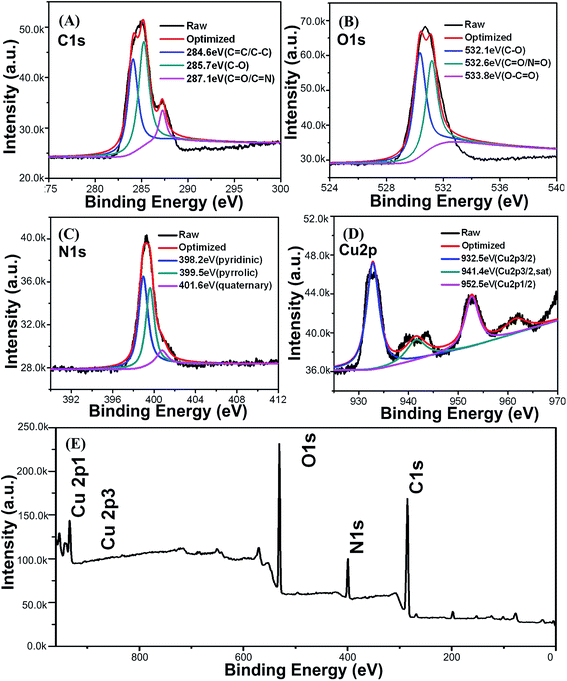 | ||
| Fig. 4 XPS high-resolution survey of C 1s (A), O 1s (B), N 1s (C), Cu 2p (D) and entirety (E) of the Cu-doped CDs. | ||
3.2 Catalytic activity and indication process for catalytic reduction of p-nitrophenol
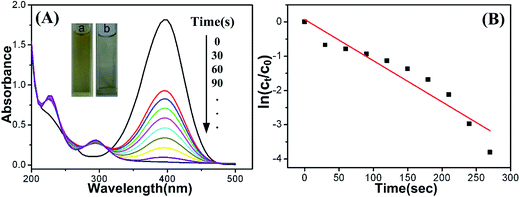
The catalytic reduction of p-nitrophenol to p-aminophenol in the presence of NaBH4 was chosen as a model reaction to investigate bifunctionality with catalytic activity and indication performance of the as-obtained Cu-doped CDs. The initial concentrations of p-nitrophenol and NaBH4 were kept at 1.0 × 10⁻⁴ and 1.0 × 10⁻² mol L−1, respectively, in all the reactions. p-Nitrophenol disappearance and p-aminophenol generation were monitored by UV-vis absorption spectra. Meanwhile, the fluorescence spectra of the Cu-doped CDs were in situ tracked during the reaction process. As shown in Fig. S6,† the original absorption peak of p-nitrophenol is centered at 317 nm and shifts to 400 nm after the addition of freshly prepared NaBH4 solution, indicating that the sodium p-nitrophenolate ions are formed.37 The peak at 400 nm is constant and no new peak at 300 nm is appeared in a period time, which indicates that the reduction reaction does not take place in the absence of catalyst. However, when a small amount of as-synthesized Cu-doped CDs were added, 30 seconds later, the reaction system becomes stable. Afterward the absorption peak at 400 nm was gradually decreased with the concomitant intensity increase of new peak at ca. 295 nm (Fig. 5A), and the yellow color of the reaction mixture was faded within 5 min (inset of Fig. 5A), demonstrating the occurrence of the reduction reaction and the formation of p-aminophenol.38–40 But the absorption peak at 400 nm was unchanged by using the bare CDs as the catalyst (Fig. S7A†), suggesting that the reduction could not be occurred in the absence of Cu.The reduction of p-nitrophenol to p-aminophenol can be treated as a pseudo-first-order reaction because the concentration of NaBH4 is higher than that of p-nitrophenol which can be considered as a constant during the reaction period.41 The values of the rate constants of the above catalytic reactions were calculated from the plot of ln(ct/c0) versus time t. Here, ct presents the concentration of p-nitrophenol at time t, and c0 is the initial concentration of p-nitrophenol. The ct/c0 is measured from the relative intensity of absorbance (At/A0) at 400 nm. The relationship of ln(ct/c0) versus time (t) was presented in Fig. 5B. The rate constant for p-nitrophenol reduction is calculated to be 1.23 × 10⁻² s−1. Although Cu-doped CDs exhibit a high catalytic activity for the reduction reaction of p-nitrophenol to p-aminophenol, the bare CDs was found to be inactive (Fig. S7B†). The reason may be attributed to their heterostructures and electronic junction effect,42 which indicates that the element of Cu play a vital role in the reduction of p-nitrophenol. Scheme 1 shows a proposed catalytic mechanism for p-nitrophenol reduction by Cu-doped CDs in the presence of NaBH4. Each Cu atom includes unpaired electrons, these unpaired electrons could interact with the adsorbed p-nitrophenol by forming a chemical adsorption bond upon adsorption.43 During the hydrogenation reduction of p-nitrophenol, the generated p-nitrophenolate ions and BH4− were adsorbed on the electronic hole in the surface of the Cu via chemical adsorption and immediately followed by the formation of p-aminophenol through hydrogenation reduction of p-nitrophenol on the surface of Cu. In order to confirm that the CDs can absorb the electron negative p-nitrophenol, p-nitrophenolate ions and BH4−, zeta potential of Cu-doped-CDs in Tris–HCl buffer solution (0.01 mol L−1, pH 4.0) was measured, which is ∼16.1 mV. Moreover, with the reduction of p-nitrophenol proceeding, zeta potential gradually becomes negative. In addition, CDs with graphite-like structure should be beneficial for enhancing conductivity in the electron-transfer process.32,44 Thus, the synergistic effect of Cu/graphitic carbon nanocatalysts finally exhibits highly catalytic performance for the hydrogenation reduction of p-nitrophenol to p-aminophenol with the rate constant of 1.23 × 10⁻² s−1. In Table 1, we compare our rate constant result to those reported in the literatures on the Cu-contained catalyst. The reasons why Cu is frequently chosen as the doped metal for the researches may be that (i) copper is very cheap and abundantly available in the crust of Earth and, (ii) Cu owns good electron accepting and donating abilities, which are beneficial for its application in catalytic reaction. As seen in the Table, our result is comparable with and even superior to other Cu-based catalysts. Due to lack of impetus of electron transfer, it is difficult for bare CD to absorb p-nitrophenol onto the catalysts, resulting in inactivity toward reduction of p-nitrophenol.
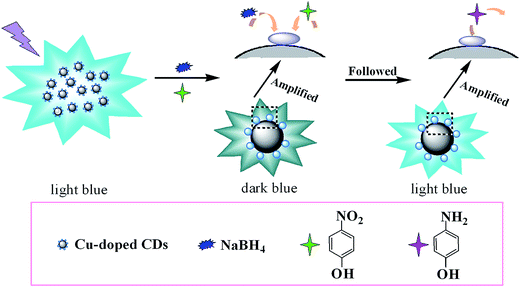 | ||
| Scheme 1 Schematic layout of reduction reaction mechanism and processing indication of p-nitrophenol to p-aminophenol catalyzed by the fabricated Cu-doped CDs. | ||
| Catalysts | Rate constant k (s−1) | Reference |
|---|---|---|
| Cu NPs | 3.7 × 10⁻⁴ | 45 |
| CuO | 1.1 × 10⁻³ | 46 |
| Cu/RGO | 2.8 × 10⁻³ | 47 |
| Cu/CCMs | 1.85 × 10⁻³ | 48 |
| Cu/porous silicon | 1.67 × 10⁻² | 49 |
| Cu@SBA-15 | 1.73 × 10⁻² | 50 |
| Cu-DENs | 1.59–2.43 × 10⁻² | 51 |
| P(AMPS)-Cu(0) hydrogel | 1.72 × 10⁻³ | 52 |
| Cu-P(NIOAM-co-AAc) | 1.73–9.0 × 10⁻³ | 53 |
| Cu-CDs | 1.23 (1.26) × 10−2 | This work |
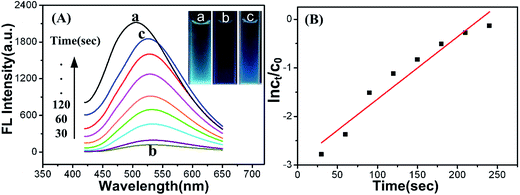
In the meantime, we measured the fluorescence behavior of Cu-doped CDs in above catalytic reduction reaction from p-nitrophenol to p-aminophenol in the presence of NaBH4 (Fig. 6). When the as-prepared Cu-doped CDs were added into the mixture of p-nitrophenol and NaBH4, in the beginning, the fluorescence of Cu-doped CDs was weakened dramatically, which was accompanied by dark blue color of the reaction mixture (inset of Fig. 6A). After the reaction system reached stable in 30 seconds, the fluorescence of Cu-doped CDs was gradually enhanced with the reappearance of light blue color (inset of Fig. 6A), corresponding to the decrease of absorption peak at 400 nm and the increase of new absorption peak at ca. 300 nm in UV-vis absorption spectra (Fig. 5A), which is the generation of p-aminophenol accompanying with the consumption of p-nitrophenol. The recovery of fluorescence signal could give an indicator for quantitative monitoring of p-nitrophenol. In order to comprehend the mechanism of fluorescence changes of the Cu-doped CDs, the excitation spectra of Cu-doped CDs were found to overlap with the absorption spectra of p-nitrophenol in the presence of NaBH4 (Fig. S8†). The IFE is due to the absorption of the excitation or emission light by absorbers in the detection system when the absorption spectra of the absorbers overlaps with the fluorescence excitation or emission spectra of fluorophores.54,55 During the reduction of p-nitrophenol, its concentration decreases gradually accompanied by the decline of absorbance, resulting in the IFE weakening, thus, the fluorescence of Cu-doped CDs was recovered gradually. To further understand the effect of p-nitrophenol concentration on the fluorescence intensity of Cu-doped CDs, various concentrations of p-nitrophenol from 1.0 × 10⁻⁴ to 5.0 × 10⁻⁴ mol L−1 were added into Tris–HCl buffer solution (0.1 M, pH 8.0) containing the Cu-doped CDs. The fluorescence spectra of the Cu-doped CDs were recorded after adding different amount of p-nitrophenol. As expected, the fluorescence intensity was decreased with the concentration of p-nitrophenol increasing, which corresponds to enhance of absorbance at 400 nm, as depicted in Fig. S9.† Also, the fluorescence of Cu-doped CDs was recovered with the decrease of absorption at 400 nm in the process of catalytic reaction, in agreement with the above phenomenon. Therefore, the fluorescence quenching or recovery of the Cu-doped CDs due to p-nitrophenol can be interpreted by the IFE of fluorescence.
Moreover, the rate constants of the above catalytic reactions were calculated from the fluorescence spectra of the Cu-doped CDs catalysts. The plot of ln(ct/c0) versus time t was shown in Fig. 6B (the ct/c0 was provided from the relative fluorescence intensity (It/I0) of Cu-doped CDs at maximum emission). From the linear relationship of ln(ct/c0) versus time (t), the values of the rate constants of p-nitrophenol reduction is 1.26 × 10⁻² s−1, which approximately agrees with the values calculated from relative intensity of absorbance. All of the results suggest that catalytic process can be monitored by the fluorescence behavior of luminescent catalyst itself. Therefore, it undoubtedly provides convenience for a class of reaction without specific spectrophotometric characteristics of the substrates.
4. Conclusion
In conclusion, the Cu-doped CDs have been successfully synthesized by a one-step hydrothermal carbonization using CuCl2·2H2O and EDTA as precursors. The catalytic reduction of p-nitrophenol in the presence of NaBH4 was chosen as a model reaction to investigate the catalytic activity and fluorescence indication performance of the obtained Cu-doped CDs. The synergistic effect of Cu and graphitic carbon can result in highly catalytic performance and IFE leads to fluorescence change of the Cu-doped CDs catalyst in the process of catalytic reduction reaction. The values of the rate constants for the hydrogenation reduction of p-nitrophenol to p-aminophenol calculated from the absorbance change of p-nitrophenol are consistent with that from the fluorescence intensity change of Cu-doped CDs. Our results indicate that the process of catalytic reduction reaction of p-nitrophenol can be monitored by the fluorescence property of catalyst itself. These unique properties would provide an ideal platform to monitor the catalytic process with IFE of fluorescence.Acknowledgements
This work was financially supported by the National Natural Science Foundation of China (No. 21175003 and 21375003).References
- K. M. Choi, K. Na, G. A. Somorjai and O. M. Yaghi, J. Am. Chem. Soc., 2015, 137, 7810–7816 CrossRef CAS PubMed.
- J. Deng, P. Ren, D. Deng and X. Bao, Angew. Chem., Int. Ed., 2015, 54, 2100–2104 CrossRef CAS PubMed.
- D. Jampaiah, T. S. Reddy, A. E. Kandjani, P. Selvakannan, Y. M. Sabri, V. E. Coyle, R. Shukla and S. K. Bhargava, J. Mater. Chem. B, 2016, 4, 3874–3885 RSC.
- W. Zhang, Z. Zhou, X. Shan, R. Xu, Q. Chen, G. He, X. Sun and H. Chen, New J. Chem., 2016, 40, 4769–4774 RSC.
- X. Guo, Y. Wang, F. Wu, Y. Ni and S. Kokot, Analyst, 2015, 140, 1119–1126 RSC.
- J. Mu, Y. He and Y. Wang, Talanta, 2016, 148, 22–28 CrossRef CAS PubMed.
- S. Xu, J. Li, X. Li, M. Su, Z. Shi, Y. Zeng and S. Ni, Microchim. Acta, 2016, 183, 667–673 CrossRef CAS.
- X. Yi, W. Dong, X. Zhang, J. Xie and Y. Huang, Anal. Bioanal. Chem., 2016, 1–8 CAS.
- M. E. Amato, G. Ansanelli, S. Fisichella, R. Lamanna, G. Scarlata, A. P. Sobolev and A. Segre, J. Agric. Food Chem., 2004, 52, 823–831 CrossRef CAS PubMed.
- K. Tanaka, N. Kitamura, K. Naka and Y. Chujo, Chem. Commun., 2008, 6176–6178 RSC.
- R. Purbia and S. Paria, Biosens. Bioelectron., 2016, 79, 467–475 CrossRef CAS PubMed.
- L.-M. Shen, Q. Chen, Z.-Y. Sun, X.-W. Chen and J.-H. Wang, Anal. Chem., 2014, 86, 5002–5008 CrossRef CAS PubMed.
- H. Li, W. Kong, J. Liu, N. Liu, H. Huang, Y. Liu and Z. Kang, Carbon, 2015, 91, 66–75 CrossRef CAS.
- H. Tao, K. Yang, Z. Ma, J. Wan, Y. Zhang, Z. Kang and Z. Liu, Small, 2012, 8, 281–290 CrossRef CAS PubMed.
- R. C. Green, L. S. Schneider, D. A. Amato, A. P. Beelen, G. Wilcock, E. A. Swabb, K. H. Zavitz and T. P. S. Group, J. Am. Med. Assoc., 2009, 302, 2557–2564 CrossRef CAS PubMed.
- C.-W. Lai, Y.-H. Hsiao, Y.-K. Peng and P.-T. Chou, J. Mater. Chem., 2012, 22, 14403–14409 RSC.
- Y. Li, Y. Zhao, H. Cheng, Y. Hu, G. Shi, L. Dai and L. Qu, J. Am. Chem. Soc., 2011, 134, 15–18 CrossRef PubMed.
- W. Shi, Q. Wang, Y. Long, Z. Cheng, S. Chen, H. Zheng and Y. Huang, Chem. Commun., 2011, 47, 6695–6697 RSC.
- Z. Ma, H. Ming, H. Huang, Y. Liu and Z. Kang, New J. Chem., 2012, 36, 861–864 RSC.
- W. Yang, T. Huang, M. Zhao, F. Luo, W. Weng, Q. Wei, Z. Lin and G. Chen, Talanta, 2017, 164, 1–6 CrossRef CAS PubMed.
- B. C. M. Martindale, G. A. M. Hutton, C. A. Caputo and E. Reisner, J. Am. Chem. Soc., 2015, 137, 6018–6025 CrossRef CAS PubMed.
- A. B. Bourlinos, A. Bakandritsos, A. Kouloumpis, D. Gournis, M. Krysmann, E. P. Giannelis, K. Polakova, K. Safarova, K. Hola and R. Zboril, J. Mater. Chem., 2012, 22, 23327–23330 RSC.
- Q. Xu, Y. Liu, R. Su, L. Cai, B. Li, Y. Zhang, L. Zhang, Y. Wang, Y. Wang, N. Li, X. Gong, Z. Gu, Y. Chen, Y. Tan, C. Dong and T. S. Sreeprasad, Nanoscale, 2016, 8, 17919–17927 RSC.
- W. Wu, L. Zhan, W. Fan, J. Song, X. Li, Z. Li, R. Wang, J. Zhang, J. Zheng, M. Wu and H. Zeng, Angew. Chem., 2015, 127, 6640–6644 CrossRef.
- H. Li, Z. Kang, Y. Liu and S.-T. Lee, J. Mater. Chem., 2012, 22, 24230–24253 RSC.
- S. N. Baker and G. A. Baker, Angew. Chem., Int. Ed., 2010, 49, 6726–6744 CrossRef CAS PubMed.
- W. Lu, X. Qin, S. Liu, G. Chang, Y. Zhang, Y. Luo, A. M. Asiri, A. O. Al-Youbi and X. Sun, Anal. Chem., 2012, 84, 5351–5357 CrossRef CAS PubMed.
- J. Zhou, Z. Sheng, H. Han, M. Zou and C. Li, Mater. Lett., 2012, 66, 222–224 CrossRef CAS.
- B. De and N. Karak, RSC Adv., 2013, 3, 8286–8290 RSC.
- S.-L. Hu, K.-Y. Niu, J. Sun, J. Yang, N.-Q. Zhao and X.-W. Du, J. Mater. Chem., 2009, 19, 484–488 RSC.
- T. Shao, P. Zhang, L. Tang, S. Zhuo and C. Zhu, Microchim. Acta, 2015, 182, 1431–1437 CrossRef CAS.
- J. Lu, J.-x. Yang, J. Wang, A. Lim, S. Wang and K. P. Loh, ACS Nano, 2009, 3, 2367–2375 CrossRef CAS PubMed.
- J. Xia, S. Yuan, Z. Wang, S. Kirklin, B. Dorney, D.-J. Liu and L. Yu, Macromolecules, 2010, 43, 3325–3330 CrossRef CAS.
- H. C. Schniepp, J.-L. Li, M. J. McAllister, H. Sai, M. Herrera-Alonso, D. H. Adamson, R. K. Prud'homme, R. Car, D. A. Saville and I. A. Aksay, J. Phys. Chem. B, 2006, 110, 8535–8539 CrossRef CAS PubMed.
- P. Gayathri and A. Senthil Kumar, Langmuir, 2014, 30, 10513–10521 CrossRef CAS PubMed.
- M. Röckert, M. Franke, Q. Tariq, S. Ditze, M. Stark, P. Uffinger, D. Wechsler, U. Singh, J. Xiao and H. Marbach, Chem.–Eur. J., 2014, 20, 8948–8953 CrossRef.
- Z. Niu, Q. Peng, M. Gong, H. Rong and Y. Li, Angew. Chem., 2011, 123, 6439–6443 CrossRef.
- J. Li, C.-y. Liu and Y. Liu, J. Mater. Chem., 2012, 22, 8426–8430 RSC.
- P. Zhang, C. Shao, Z. Zhang, M. Zhang, J. Mu, Z. Guo and Y. Liu, Nanoscale, 2011, 3, 3357–3363 RSC.
- M. Zhu, C. Wang, D. Meng and G. Diao, J. Mater. Chem. A, 2013, 1, 2118–2125 CAS.
- Y.-g. Wu, M. Wen, Q.-s. Wu and H. Fang, J. Phys. Chem. C, 2014, 118, 6307–6313 CAS.
- Z. Jiang, J. Xie, D. Jiang, X. Wei and M. Chen, CrystEngComm, 2013, 15, 560–569 RSC.
- F. Xia, V. Perebeinos, Y.-m. Lin, Y. Wu and P. Avouris, Nat. Nanotechnol., 2011, 6, 179–184 CrossRef CAS PubMed.
- N. Liu, F. Luo, H. Wu, Y. Liu, C. Zhang and J. Chen, Adv. Funct. Mater., 2008, 18, 1518–1525 CrossRef CAS.
- P. Deka, R. C. Deka and P. Bharali, New J. Chem., 2014, 38, 1789–1793 RSC.
- A. Bhattacharjee and M. Ahmaruzzaman, Mater. Lett., 2015, 161, 79–82 CrossRef CAS.
- R. Krishna, D. M. Fernandes, J. Ventura, C. Freire and E. Titus, Int. J. Hydrogen Energy, 2016, 41, 11608–11615 CrossRef CAS.
- X. Cheng, A. Fu, H. Li, Y. Wang, P. Guo, J. Liu, J. Zhang and X. S. Zhao, ACS Sustainable Chem. Eng., 2015, 3, 2414–2422 CrossRef CAS.
- M. Halim, W. Tan, N. Bakar and M. Bakar, Materials, 2014, 7, 7737 CrossRef.
- B. K. Ghosh, S. Hazra, B. Naik and N. N. Ghosh, Powder Technol., 2015, 269, 371–378 CrossRef CAS.
- M. Nemanashi and R. Meijboom, J. Colloid Interface Sci., 2013, 389, 260–267 CrossRef CAS PubMed.
- N. Sahiner and O. Ozay, Curr. Nanosci., 2012, 8, 367–374 CrossRef CAS.
- H. F. Zahoor, T. Sakhawat, R. Khan Shanza, F. Kanwal, M. Usman and R. Begum, Materials Science-Poland, 2015, 33, 185–192 Search PubMed.
- G. Gabor and D. R. Walt, Anal. Chem., 1991, 63, 793–796 CrossRef CAS.
- D. M. Jordan, D. R. Walt and F. P. Milanovich, Anal. Chem., 1987, 59, 437–439 CrossRef CAS.
Footnote |
| † Electronic supplementary information (ESI) available. See DOI: 10.1039/c7ra05383e |
| This journal is © The Royal Society of Chemistry 2017 |

