
 Open Access Article
 This Open Access Article is licensed under a Creative Commons Attribution-Non Commercial 3.0 Unported Licence
Fabrication and characterization of mid-infrared emission of Pr3+ doped selenide chalcogenide glasses and fibres
Zijun Liu ab,
Junyi Bianab,
Yan Huangab,
Tiefeng Xuab,
Xunsi Wangab and
Shixun Dai*ab
ab,
Junyi Bianab,
Yan Huangab,
Tiefeng Xuab,
Xunsi Wangab and
Shixun Dai*ab
aLaboratory of Infrared Material and Devices, Advanced Technology Research Institute, Ningbo University, Ningbo, 315211, China. E-mail: daishixun@nbu.edu.cn
bKey Laboratory of Photoelectric Materials and Devices of Zhejiang Province, Ningbo, 315211, China
First published on 25th August 2017
Abstract
A series of Pr3+-doped selenide glasses was prepared by a melt-quenching method. The Pr3+ doped fibre optic preform was fabricated using extrusion and was successfully drawn into a low optical loss, step-index fibre. Intense mid-infrared (2.8–5.5 μm) fluorescence spectra were achieved at different concentrations of Pr3+ doped selenide glass with a pump of 2.0 μm. A comparison of the emission spectra of bulk glass and the fibres is presented under 2.0 μm wavelength excitation. The strongest emission was achieved due to the dispersion effect of Ga by forming bonds of Pr3+–Se–Ga. Based on the measured absorption spectra, the Judd–Ofelt parameters were calculated, discussed and compared with other host glasses. Given these properties, this system has the potential to be a good gain material for further development to realize both fibre lasers and amplified spontaneous emission fibre sources in the mid-infrared region.
Introduction
The mid-infrared (MIR) covers the important atmospheric window of 3–5 μm and is one of the most intensively developing subjects in photonics at present. Besides, new wavelengths for laser machining and welding materials are of interest. For example, human tissue cutting and welding, neurosurgery, dermatology and bio-imaging are of international interest.1–4 Mid-IR fibre laser machining and welding of polymers will be facilitated by resonance between the laser light frequency and the vibrational absorption of the polymer chemical bonding. To exploit the mid-IR region effectively requires the development of a raft of new active mid-infrared materials, including mid-IR fibre lasers.Rare-earth ions are known to offer numerous transitions from 3 to 10 μm for potential exploitation in a glass fibre laser format. Up to now, the longest wavelength of the fibre laser is 3.95 μm obtained in a Ho3+-doped ZBLAN fibre with liquid nitrogen cooling.5 But beyond 3 μm, the multiphonon relaxation rates of fluoride glasses compete with the sharp-line luminescence. So other vitreous or crystalline materials with lower phonon energies must be sought as the host materials.
Chalcogenide glasses (ChG) have several properties that make them attractive as hosts for rare-earth ions.6–8 The primary advantage for choosing a chalcogenide host is its smaller phonon energy as compared to ZBLAN (∼565 cm−1) and silicate (∼1100 cm−1) glass hosts. This smaller phonon energy, 400–450 cm−1 for sulphide and 350 cm−1 for selenide glass, results in a smaller multiphonon transition probability, thereby activating many mid-IR transitions for rare-earth ions which are normally quenched in hosts with larger phonon energies.9 The high index and low phonon energy of the host ChG result in larger oscillator strengths and higher quantum efficiencies for RE ion transitions than in silica or fluoride glass.9
One promising selenium host glass is the Ge–As–Ga–Se (GAGS) glass system.10 This host provides a low tendency to crystallize, higher mechanical properties and improved solubility of the RE-ions. The increased solubility of the RE-ions is due to the fact that the incorporation of Ga provides compensation for the negative charge of free Se2− ions by forming chemical bonds with RE-ions.11–15
A significant research effort has been put into studying the photoluminescence of lanthanide doped GAGS glasses and fibres. Cole et al.12 (1999) investigated the mid-IR emission of Pr3+ doped (200 ppmw) GAGS glasses and fibres. The emission spectrum was taken from one end of a fibre having a length of approximately 30 cm. Shiryaev et al.16 (2014) provided a new vapour phase transport approach of metallic Ga transfer in a GaI3 flow, developed to purify and add the batch of metallic gallium into the silica glass reactor for the GAGS glass synthesis. The content of residual impurities is: hydrogen 0.15 ppm, oxygen <1 ppm, and transition metals less than 0.1 ppm. Sójka et al.17 (2014) fabricated and characterized Pr3+ doped (500 ppmw) GAGS core/GAGS clad step-index fibre. It was found that the mid-IR emission 3H5 → 3H4 efficiency was determined to be close to 100% based on J–O analysis. Hu et al.18 (2015) computationally investigated cascaded amplification in a three-level mid-infrared (IR) Pr3+-doped GAGS fibre amplifier. High gain and low noise are achieved simultaneously at 4.5 μm. This shows that 45% of the pump power that is injected at 2 μm can be shifted to 4.5 μm. The authors set the Pr3+ ion density equal to 2 × 1019 cm−3, which corresponds to 0.1 wt% or 1000 ppmw Pr3+-doped GAGS glass fibres. The equivalent atomic percentage of the Pr3+ is 0.055 mol%. However, the Pr3+ doping concentration of the reported GAGS fibre is less than 1000 ppmw. Therefore, we selected the GAGS glass as the host glass for investigating the effect of Ga3+ and Pr3+ dopant concentrations on luminescence.
In this paper, the successful fabrication of Pr3+-doped Ge10As24Ga4Se62 (Pr3+:GAGS) glass and fibre with a doping concentration of Pr3+ up to 2050 ppmw (0.1 mol%) was reported. Pr3+ has a very wide MIR emission band from 3.0–5.5 μm and was calculated to have a better amplification performance in a lower phonon energy host such as ChG. The optical properties of the Pr3+-doped ChG were investigated. The emission and absorption spectra were recorded and analysed. The amorphous nature of the Pr3+:GAGS glasses was studied by X-ray diffraction (XRD) and the J–O intensity parameters are presented. Besides, the MIR fluorescence properties of Pr3+:GAGS glass and fibre pumped under 2 μm lasers are compared and discussed.
Experimental
Glass preparation
A series glasses of Ge10As24Ga4Se62Prx, denoted as GAGS-x (x = 0, 0.05, 0.1, 0.15, 0.2, 0.3, 0.4), was prepared by a melt-quenching method. Ge (5N purity), As (5N purity), Ga (6N purity), Se (5N purity) and Pr (3N purity, batched inside a glove-box) were heated firstly in a silica glass ampoule under vacuum (10−3 Pa) to remove the volatile impurities, then the ampoule was sealed and melted for 18 hours at 750 °C, followed by quenching and annealing at the transition temperature.16 After being cooled to the ambient slowly, the glasses were cut and polished for subsequent measurements.Fibre fabrication
The preforms were fabricated by a modified chalcogenide preform fabrication approach: isolated stacked extrusion. For details of the preparation process refer to the published work.19 The extruded preforms were drawn into fibres of a few hundred micron diameters in the fibre drawing tower (SG Controls, UK).The fibres were drawn to a diameter of 250 μm at a rate of 0.5 m min−1, a temperature of 300 °C with a viscosity of about 104 to 105 Pa s. The 0.1 mol% Pr3+-doped GAGS step-fibre had an outside diameter of 250 μm. Numerical apertures (NA) of 0.19 were calculated for the fibre at a 4.5 μm wavelength. Numerical apertures were calculated from refractive indices (ncore = 2.608, nclad = 2.601) measured using an IR VASE mid-infrared Ellipsometer (J.A. Woollam Co., Inc.) at room temperature. During the drawing, the preform was protected in an inert gas atmosphere.
Physical and optical measurements
The absorption spectra were collected using a PerkinElmer-Lambda 950UV/VIS/NIR spectrophotometer, in the range of 400–2500 nm. XRD patterns (X-ray diffraction) were collected under ambient conditions using a Bruker D2 X-ray diffractometer. MIR fluorescence spectra in the range of 2800–5500 nm were recorded by an InSb detector combined with a FLS980 fluorescence spectrometer at room temperature. A solid-state laser at 2.0 μm was used as the excitation source. The fibre loss was measured by the cut-back method using a FTIR spectrometer (Thermo Scientific, Nicolet 5700, USA). The FTIR light was coupled into the fibre whose cross sections had been handled through the ZnSe lens with a NA of 0.67 and a focal length of 12.7 mm. The output terminal was connected to the liquid nitrogen cooled MCT detector. Adjusting the light path and measuring the output spectrum enabled the receiving light intensity of the detector to reach the maximum. We then cut off the fibre and measured the output spectrum again with the front end of the fibre fixed. To make the results comparable, a fixed configuration between the sample, laser, and detector was employed and carefully used. All the measurements were performed at room temperature.Results and discussion
Effect of Ga on MIR
Fig. 1 shows the emission bands centred at 2.9 μm and 3.3 μm corresponding to the transitions of 1G4 → 3F3 and 1G4 → 3F4. The broad emission band between 3.7 μm and 5.5 μm is attributed to the overlap of five transitions (3F4 → 3F2/3H6, 3F3 → 3H6, 3F2 → 3H5, 3H6 → 3H5, 3H5 → 3H4). The legends of GAS-Gax in Fig. 1 are abbreviations for Ge–As–Se–Gax (x = 1.0, 2.0, 3.0, 4.0, 5.0 mol%, respectively). All the samples exhibited in Fig. 1 have the same concentration of Pr3+ (0.1 mol%) and different concentrations of Ga3+. It is shown from the emission spectra excited by a 2000 nm LD laser that the MIR emission intensity was enhanced with the increase of Ga3+ ions from 1.0 to 4.0 mol%. Further increases of the Ga3+ concentration (5.0 mol%) decreased the fluorescence intensity.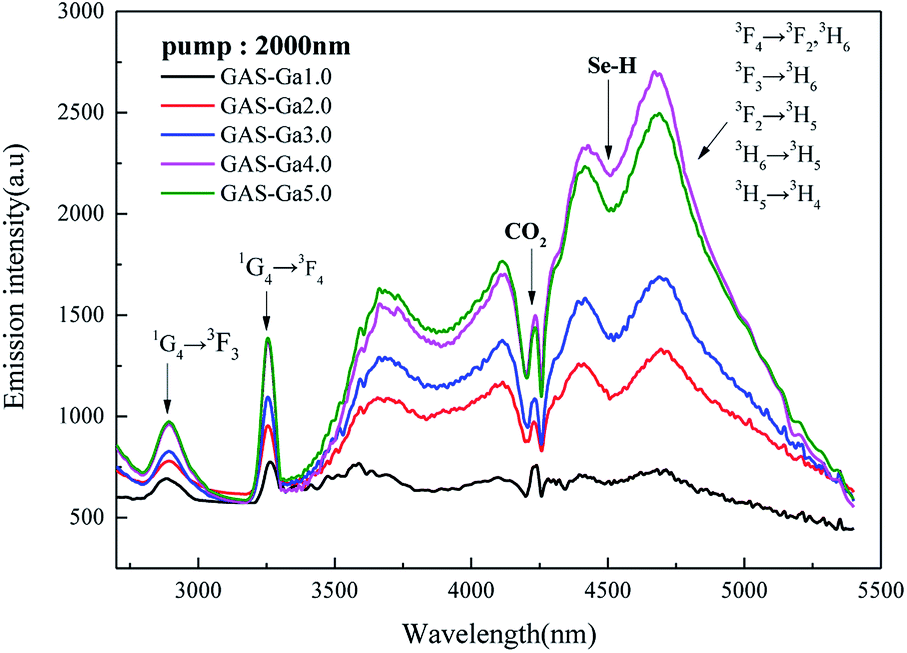 | ||
| Fig. 1 Emission spectra of 0.1 mol% Pr3+ doped GAGS glasses with varying Ga3+ concentration (1.0, 2.0, 3.0, 4.0, 5.0 mol%, respectively) when pumped by a 2000 nm CW laser. | ||
In the past decade, several different approaches have been used to identify the chemical environment of REI ions in chalcogenide glasses and glass-ceramics. It is suggested that there are preferential spatial correlations between REI and the GaS4 tetrahedral even at low Ga-doping levels.20 Furthermore, the phenomenon that Ga complexes the RE-ions by forming [RE3+–S–GaIII] type species has already been confirmed.21 Therefore, according to the experience mentioned above and combined with the increase of the MIR intensity of Pr3+ ions shown in Fig. 1, it can be supposed that the introduction of Ga to the GeAsSe structure has dispersed Pr3+ ions in the glass.
Absorption spectra and J–O analysis
The absorption spectra of 0.05–0.4 mol% Pr3+:Ge10As24Ga4Se62 glasses were measured in the wavelength region of 800–2250 nm (Fig. 2). The absorption bands with peaks located at 1005 nm, 1491 nm, 1605 nm and 2037 nm correspond to the transitions of the ground-state 3H4 to the excited levels 1G4, 3F4, (3F3, 3F4) and 3F2, respectively. The cut-off edge at the short-wavelength of about 800 nm is due to the band gap absorption, which means the absorption band near 606 nm cannot be observed.22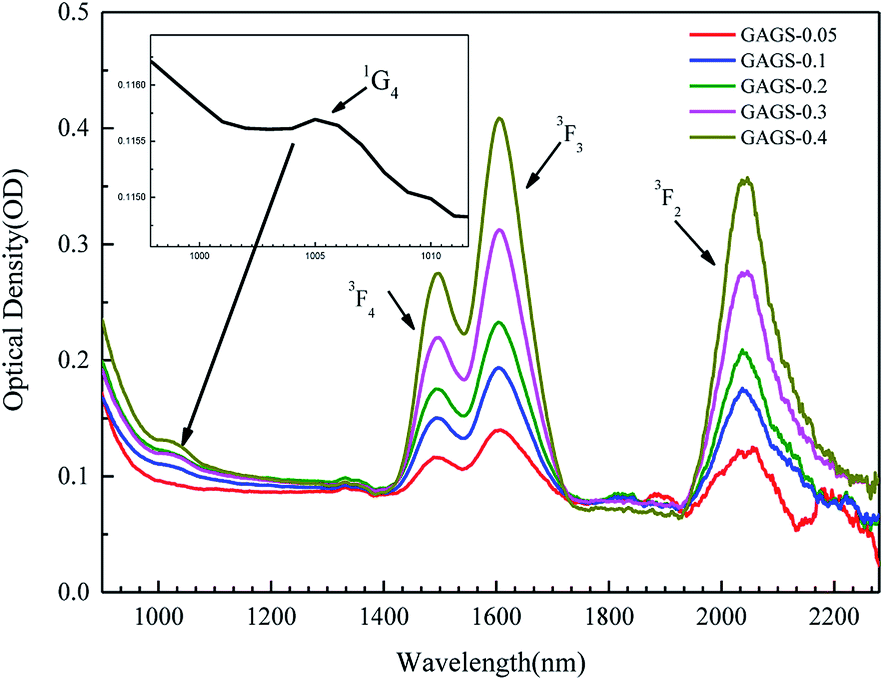 | ||
| Fig. 2 Absorption spectra of 0.05–0.4 mol% Pr3+:GAGS glasses in the range of 800–2250 nm obtained by UV/VIS/NIR spectrophotometer. | ||
The intensity parameters Ωt (t = 2, 4, 6) are significant for the analysis of electron transitions within the 4f shell of RE-ions in solids.23–27 The values of Ω2 are related to the local environment of the RE-ions which is sensitive to the variation of the glass composition. The ratio of Ω4/Ω6 is a radiative transition quality factor. As shown in Table 1, the calculated values of Judd–Ofelt (J–O) intensity parameters, Ωt (t = 2, 4, 6), have an obvious mutation when the concentration of Pr3+ ion is up to 0.3 mol%. This is most likely due to crystallization, although the peaks of crystallization were not found in the XRD patterns (Fig. 3).
| Glass sample | Ω2 (×10−20 cm2) | Ω4 (×10−20 cm2) | Ω6 (×10−20 cm2) | Ω4/Ω6 (×10−20 cm2) |
|---|---|---|---|---|
| GAGS-0.05 | 2.01 | 17.74 | 8.65 | 2.05 |
| GAGS-0.1 | 1.99 | 11.92 | 8.07 | 1.48 |
| GAGS-0.2 | 1.99 | 10.34 | 7.47 | 1.38 |
| GAGS-0.3 | 3.08 | 4.92 | 5.24 | 0.94 |
| GAGS-0.4 | 3.24 | 4.56 | 5.01 | 0.91 |
 | ||
| Fig. 3 XRD patterns of 0–0.4 mol% Pr3+:GAGS glasses. The peaks on the "GAGS-0.4" curve are the diffraction peak of PrSe2 compared with JCPDS card no. 19–1011. | ||
Though the PrSe2 crystalline phase peaks appeared as the concentration of the Pr3+ increased to 0.4 mol%, the crystal nucleus may be formed at 0.3 mol% and be too small to be detected by the XRD patterns. This indicated that the Pr3+ ions clustered to share the limited non-bridging selenium with the bonds changed from Pr3+–Se–Ga to Pr3+–Se–Pr3+ as the concentration of the Pr3+ increased to 0.3 mol%, which corresponds to the change in symmetry and local structure of Pr3+ ions. Thus, the J–O intensity parameters changed suddenly at a concentration of 0.3 mol% Pr3+. The ratio of Ω4/Ω6 decreased monotonously with the increase of Pr3+ concentration, shown in Table 2. It is obvious that the RE-ions of Pr3+:GAGS glasses result in Pr3+ clusters as well as non-clustered Pr3+ ions. The parts with clustered Pr3+ ions had no or little contribution to the MIR emission. With the increase of Pr3+ concentration, the clusters of Pr3+ ions became more and more serious, so the radiative transition quality factor (Ω4/Ω6) became smaller.
| GAGS | GAGS | Tellurite | Bismuthate | Oxyfluoride | ZBLAN | ||
|---|---|---|---|---|---|---|---|
| J–O intensity parameters Ωt/(×10−20, cm2) | Ω2 | 2.01 | 9.05 | 0.264 | 1.30 | 0.13 | 0.94 |
| Ω4 | 17.74 | 7.26 | 8.067 | 3.29 | 4.09 | 6.54 | |
| Ω6 | 8.65 | 7.28 | 5.884 | 2.13 | 6.33 | 3.84 | |
| Ω4/Ω6 | 2.05 | 1 | 1.37 | 1.54 | 0.65 | 1.7 | |
| Measured oscillator strengths fcal/(×10−6) | 3H4 → 1G4 | 1.004 | — | 0.35 | 0.63 | 0.18 | 3.14 |
| 3F4 | 12.170 | — | 3.88 | 5.29 | 11.98 | 4.05 | |
| 3F3 | 23.561 | — | 7.82 | 8.24 | 11.98 | 2.09 | |
| 3F2 | 12.836 | — | 3.63 | 1.63 | 3.39 | 0.99 | |
| Reference | Current work | 17 | 28 | 29 | 30 | 31 | |
Table 2 shows the values of the oscillator strengths and J–O intensity parameters Ωt, calculated from our Pr3+:GAGS sample and other hosts. Compared to other host glasses, the large refractive index and high degree of covalent bonding in the ChG results in oscillator strengths and radiative transition probabilities greater than in other host materials. Thus, the GAGS glass has the largest oscillator strengths, Ω2 and Ω4/Ω6, as shown in Table 2. These properties indicate that the GAGS glass is a better host for MIR emission of Pr3+ ions.
Amorphicity of Pr3+:GAGS glasses
Fig. 3 shows the X-ray diffraction patterns of 0–0.4 mol% Pr3+:GAGS glasses. The absence of diffraction peaks in patterns of samples with concentrations of Pr3+ ions ≤0.3 mol% indicates an amorphous character (no crystallization). As the concentration of Pr3+ ions increased to 0.4 mol%, diffraction peaks were observed which can be assigned to the PrSe2 crystalline phase (JCPDS card no. 19-1011). This reveals that no more RE-ions can be dissolved in the GAGS matrix. The higher concentration can affect the degree of symmetry of the Pr3+ local environment and result in clustering or inhomogeneous distribution. The devitrification of the heavy doping samples is due to the large coordination number of Pr3+ ions; with the increased Pr3+ ion concentration, there is not enough non-bridging selenium to separate them from each other. Then, Pr3+ ions will get together to share the non-bridging selenium or even to form clusters.Mid-IR luminescence
The mid-IR emission spectra ranging from 2.8 μm to 5.5 μm of the 0.05–0.4 mol% Pr3+:GAGS glasses with the pump of a 2.0 μm laser are shown in Fig. 4. As shown in Fig. 4, the emission bands centred at 2.9 μm and 3.3 μm correspond to the transitions of 1G4 → 3F3 and 1G4 → 3F4 with a pump of 2.0 μm. This is because the excited state absorption (ESA) occurred in the transition of 3F2 → 1G4 when pumped by a 2.0 μm laser, as shown in Fig. 5.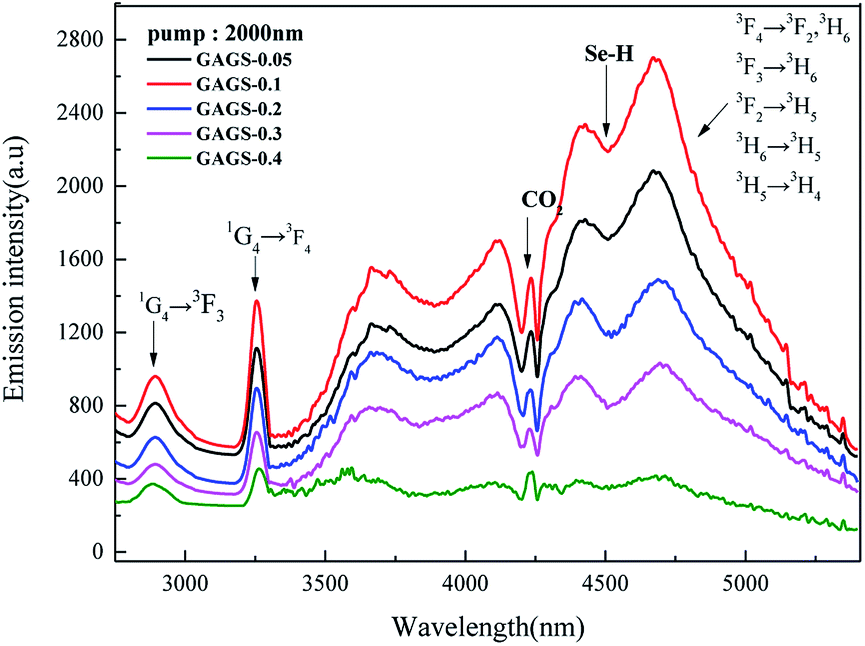 | ||
| Fig. 4 Emission spectra of Pr3+ doped GAGS glasses with varying Pr3+ concentrations (0.05, 0.1, 0.2, 0.3, 0.4 mol%, respectively) when pumped by a 2000 nm CW laser. | ||
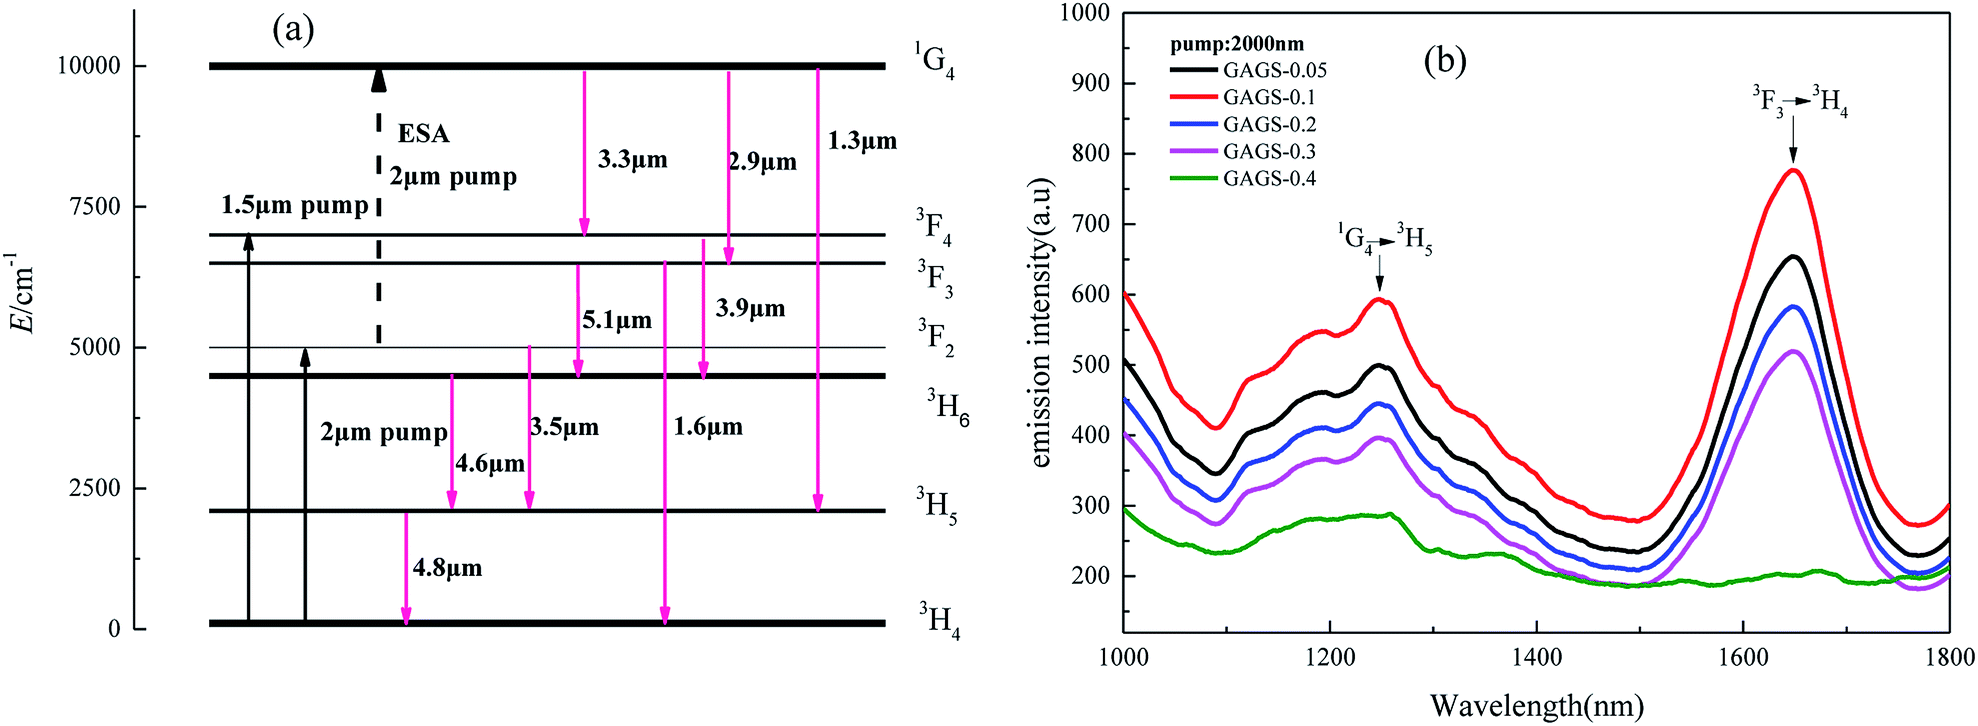 | ||
| Fig. 5 Energy levels of Pr3+ with possible emission transitions shows the concept of ESA and NIR transitions in (a). The emission wavelengths were simply calculated from the energy gap between the 4f energy levels. (b) Shows the NIR emission spectra of the 0.05–0.4 mol% Pr3+:GAGS glass pumped by a 2000 nm CW laser. | ||
The broad emission band between 3.7 μm and 5.5 μm that appears in Fig. 4 is attributed to the overlap of five transitions (3F4 → 3F2/3H6, 3F3 → 3H6, 3F2 → 3H5, 3H6 → 3H5, 3H5 → 3H4). The dips observed in both fluorescence spectra at 4.26 and 4.5 μm can be attributed to ambient CO2 absorption in the optical path and impurities absorption of the Se–H bond, respectively.
The schematic energy-level diagram of Pr3+ ion for ESA and NIR transitions is shown in Fig. 5(a).32 The NIR spectrum is shown in Fig. 5(b), which consists of the emission bands at 1.3 and 1.6 μm corresponding to the 1G4 → 3H5 and 3F3 → 3H4 transitions, respectively. It can be seen that ESA exists in the transition of 3F2 → 1G4 when excited at 2.0 μm, which is in agreement with Fig. 4.
From both Fig. 4 and 5(b), it is clear that the 0.1 mol% Pr3+-doped glass has the highest emission intensity and the intensity monotonously decreases for higher Pr3+ concentrations. At low Pr3+ concentrations, the dopants can be distributed uniformly by bonding to non-bridge selenium atoms forming the Pr3+–Se–Ga bonds.
As the Pr3+ concentration increases, the Pr3+ ions must share the limited non-bridging selenium and then the clusters are formed through Pr3+–Se–Pr3+ bonding. Therefore, the local concentration of non-clustered Pr3+ become lower and the emission intensity become worse. Clustering facilitates the energy migration and fluorescence quenching by depopulating the excited states.
This process develops as the inter-ionic distance between the Pr3+ ions decreased in the lattice. In addition, the PrSe2 crystalline phase appeared in Pr3+:GAGS glasses and made the Pr valence state change from trivalence to tetravalence, which decreased the emission intensity as well.
For laser applications, the values of the emission cross-section are of great interest. The effective line-width of the fluorescence band, Δλeff, is defined by:
 | (1) |
 represents the effective area of the peak and Imax is the maximum intensity at each fluorescence emission peak. The stimulated emission cross-section has been calculated using the flowing equation:
 | (2) |
The effective line-width of the fluorescence band, Δλeff, and the stimulated emission cross-section σemi of a sample with 0.1 mol% Pr3+ are listed in Table 3. Examining Table 3, we see that the transitions are characterized by high cross-sections, long upper state lifetimes, and good branching ratios. These values indicate that many of the transitions are viable for MIR fibre lasers and amplifiers. The high cross-sections can be attributed to the enhancement of the local field factor due to the high index of chalcogenide glass.
| Transition | λemi (μm) | Δλeff (nm) | β% | τ (ms) | σemi (×10−20 cm2) |
|---|---|---|---|---|---|
| 1G4 → 3F4 | 2.90 | 120 | 19.82 | 5.95 | 0.46 |
| 3H6 → 3H5 | 4.60 | 749 | 56.74 | 4.47 | 1.14 |
| 3H5 → 3H4 | 4.80 | 752 | 100 | 10.74 | 1.30 |
Fibre loss and MIR emission
The optical loss spectrum of the 250/125 μm cladding diameter/core diameter, 0.1 mol% Pr3+ step-index glass fibre exhibited a lowest loss of 3.5 dB m−1 at a 6.9 μm wavelength (Fig. 6). The absorption band at 2.9 μm is assigned to O–H impurity vibrational absorption. The absorption band observed at 4.5 μm is attributed to the ground state electronic absorption band 3H5–3H4, and also encompasses Se–H extrinsic impurity vibrational absorption. The absorption bands at 6.3 μm and 7.8 μm are assigned to H2O and oxygen related (As–O and Ge–O) impurity vibrational absorption.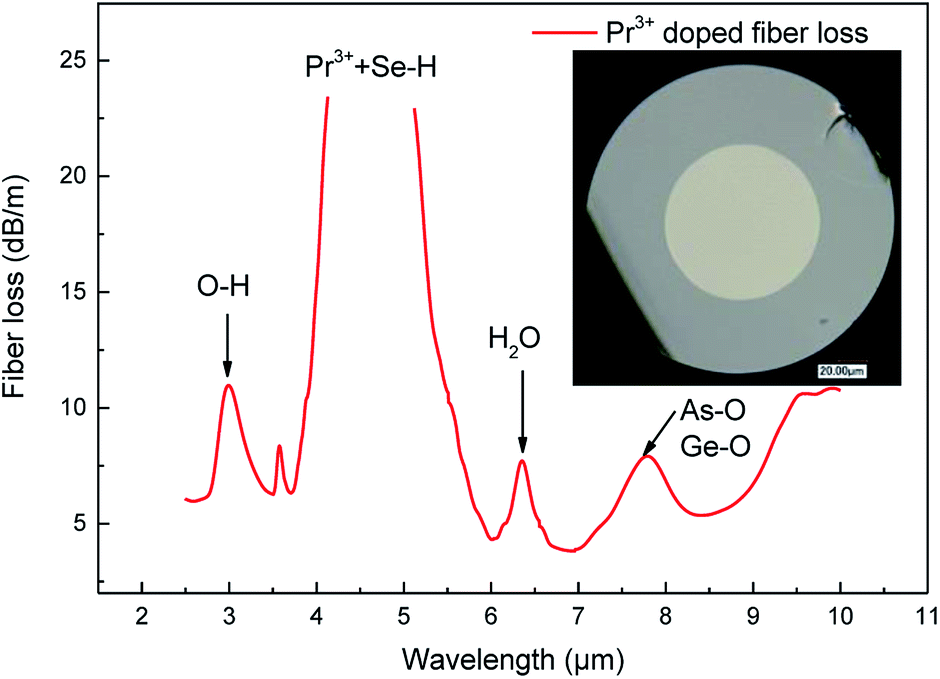 | ||
| Fig. 6 Optical loss spectrum of the 0.1 mol% Pr3+:GeAsGaSe core/GeAsGaSe clad. Step-index glass fibre drawn from the co-extruded core/clad preform. The inset is the optical photomicrograph of the fibre end face. | ||
Fig. 7 shows the photoluminescence intensity of the 0.1 mol% Pr3+ for both bulk sample and fibre (80 mm) together in order to compare their band-shapes. For convenience, the emission spectra have been normalized. It can be seen that the fibre sample exhibits a greater proportion of its observed emission intensity at wavelengths >4800 nm, compared to the bulk sample. This is due to the long interaction length in optical fibres. For emission in the fibre, the shorter wavelength emission overlaps the absorption transition of 3H5 → 3H4. Therefore, the shorter wavelength emission is self-absorbed to be subsequently re-emitted at longer wavelengths.
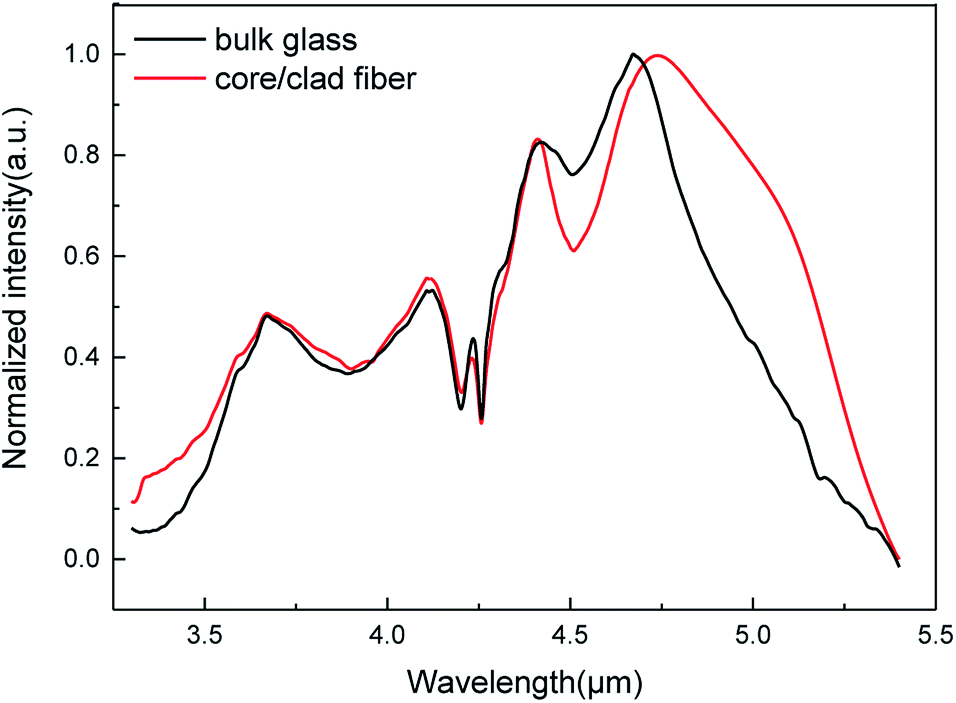 | ||
| Fig. 7 Measured mid-IR emission spectrum of 0.1 mol% Pr3+ doped bulk glass GeAsGaSe sample and 0.1 mol% Pr3+:GeAsGaSe core/GeAsGaSe clad step-index ChG fibre with preamplifier and 2000 nm CW laser excitation. Spectra are normalized at the peak wavelength. | ||
It can be observed that the bandwidths of the luminescence in this selenide glass are much broader than those in sulphide glasses; this may due to the relatively higher stark splitting of Pr3+ ions generated by the larger oscillator strengths and asymmetry polyhedra in Pr3+:GAGS glasses. Besides, the stimulated emission cross-section and branching ratio of the emission transition at 4.8 μm is the largest. Furthermore, the radiative lifetime of the 3H5 state is much larger than that the of 3H6 state, so the transition of 3H6 → 3H5 is a self-terminating transition. Meanwhile, the state of 3H5 can also be populated by reabsorption of the (3F2, 3H6) → 3H5 emission. Thanks to these interactions between the excited states of Pr3+, an easy population inversion can be anticipated for the broad emissions out of the 3H5 state when the gain medium has a long interaction length such as in optical fibres. Due to these parameters, the GAGS glasses with 0.1 mol% Pr3+ have a potential for application in lasers and amplifiers working at 4.8 μm.
Conclusions
A series of Pr3+:GAGS glasses as potential gain materials for MIR laser devices were prepared and optically characterized. The 0.1 mol% Pr3+ doped step-index fibre has been successfully fabricated and its spectroscopic properties characterized. The J–O intensity parameters Ωt and oscillator strengths were calculated. Compared to other host glasses, the Pr3+:GAGS glasses possessed the largest oscillator strengths, Ω2 and Ω4/Ω6. The values of Ωt have a sudden jump when the concentration of Pr3+ ions increases to 0.3 mol%. This indicates that as the concentration of Pr3+-ions increases, the ratio of clustered Pr3+ ions to non-clustered Pr3+ ions becomes bigger and the emission intensity becomes weak. Mid-infrared (2.8–5.5 μm) fluorescence spectra of bulk glass and fibre were observed and compared under the pump of a 2.0 μm laser. The highest emission intensity was obtained in GAGS-0.1 glass and the intensity substantially decreases for higher Pr3+ concentrations. The ESA occurred in the transition of 3F2 → 1G4 when using an excitation wavelength of 2.0 μm which contributed to the NIR-emissions of 1.3, 1.6, 2.9 and 3.3 μm.Acknowledgements
This work was supported by the Fund of the National Natural Science Foundation of China (61605095); Natural Science Foundation of Zhejiang Province (Q15F050003); Natural Science Foundation of Ningbo (2015A610038); the Scientific Research Foundation of Ningbo University (xkx11433, XYL15012); the Open Fund of the Guangdong Engineering Technology Research and Development Center of Special Optical Fibre Materials and Devices (South China University of Technology) (2016-4); and the K. C. Wong Magna Fund at Ningbo University.References
- L. Bachmann, K. Rosa, P. A. D. Ana, D. M. Zezell, A. F. Craievich and G. Kellermann, Laser Phys. Lett., 2009, 6, 159–162 CrossRef CAS.
- H. Jelínková, O. Kőhler, M. Němec, P. Kora, J. Šulc, V. Kubeček, P. Drlík, M. Miyagi, Y. W. Shi and Y. Matsuura, Laser Phys. Lett., 2004, 1, 143–146 CrossRef.
- A. B. Seddon, Int. J. Appl. Glass Sci., 2011, 2, 177–191 CrossRef CAS.
- A. B. Seddon, Phys. Status Solidi B, 2013, 250, 1020–1027 CrossRef CAS.
- S. D. Jackson, Nat. Photonics, 2012, 6, 423–431 CrossRef CAS.
- E. M. Dianov, V. G. Plotnichenko, Y. N. Pyrkov, I. V. Smol'Nikov, S. A. Koleskin, G. G. Devyatykh, M. F. Churbanov, G. E. Snopatin, I. V. Skripachev and R. M. Shaposhnikov, Inorg. Mater., 2003, 39, 627–630 CrossRef CAS.
- M. F. Churbanov, V. S. Shiryaev, A. I. Suchkov, A. A. Pushkin, V. V. Gerasimenko, R. M. Shaposhnikov, E. M. Dianov, V. G. Plotnichenko, V. V. Koltashev and Y. N. Pyrkov, Inorg. Mater., 2007, 43, 441–447 CrossRef CAS.
- Z. Tang, N. C. Neate, D. Furniss, S. Sujecki, T. M. Benson and A. B. Seddon, J. Non-Cryst. Solids, 2011, 357, 2453–2462 CrossRef CAS.
- L. B. Shaw, B. Cole, P. A. Thielen, J. S. Sanghera and I. D. Aggarwal, IEEE J. Quantum Electron., 2001, 37, 1127–1137 CrossRef CAS.
- S. Q. Gu, D. A. Turnbull and S. G. Bishop, IEEE Photonics Technol. Lett., 1996, 8, 260–262 CrossRef.
- E. R. Barney, Z. Tang, A. Seddon, D. Furniss, S. Sujecki, T. Benson, N. Neate and D. Gianolio, RSC Adv., 2014, 4, 42364–42371 RSC.
- B. Cole, L. B. Shaw, P. C. Pureza, R. Mossadegh, J. S. Sanghera and I. D. Aggarwal, J. Non-Cryst. Solids, 1999, 256, 253–259 CrossRef.
- A. B. Seddon, Z. Tang, D. Furniss, S. Sujecki and T. M. Benson, Opt. Express, 2010, 18, 26704–26719 CrossRef PubMed.
- C. Lin, S. Dai, C. Liu, B. A. Song, Y. Xu, F. Chen and J. Heo, Appl. Phys. Lett., 2012, 100, 113107–113108 CrossRef.
- T. H. Lee, S. I. Simdyankin, J. Hegedus, J. Heo and S. R. Elliott, Phys. Rev. B: Condens. Matter Mater. Phys., 2010, 81, 760–762 Search PubMed.
- V. S. Shiryaev, A. P. Velmuzhov, Z. Q. Tang, M. F. Churbanov and A. B. Seddon, Opt. Mater., 2014, 37, 18–23 CrossRef CAS.
- L. Sójka, Z. Tang, D. Furniss, H. Sakr, A. Oladeji, E. Bereś-Pawlik, H. Dantanarayana, E. Faber, A. Seddon and T. Benson, Opt. Mater., 2014, 36, 1076–1082 CrossRef.
- J. Hu, C. R. Menyuk, C. Wei, L. B. Shaw, J. S. Sanghera and I. D. Aggarwal, Opt. Lett., 2015, 40, 3687–3690 CrossRef CAS PubMed.
- Y. Sun, S. Dai, P. Zhang, X. Wang, Y. Xu, Z. Liu, F. Chen, Y. Wu, Y. Zhang and R. Wang, Opt. Express, 2015, 23, 23472 CrossRef CAS PubMed.
- T. H. Lee, S. I. Simdyankin, J. Hegedus, J. Heo and S. R. Elliott, Phys. Rev. B: Condens. Matter Mater. Phys., 2010, 81, 760–762 Search PubMed.
- Y. Shpotyuk, A. Ingram, O. Shpotyuk, C. Boussardpledel, V. Nazabal and B. Bureau, RSC Adv., 2016, 6, 22797–22802 RSC.
- C. Lu, H. Guo, Y. Xu, C. Hou, M. Lu, X. He, P. Wang, W. Li and B. Peng, Mater. Res. Bull., 2014, 60, 391–396 CrossRef CAS.
- B. R. Judd, Phys. Rev., 1962, 127, 750–761 CrossRef CAS.
- G. S. Ofelt, J. Chem. Phys., 1962, 37, 511–520 CrossRef CAS.
- W. T. Carnall, P. R. Fields and K. Rajnak, J. Chem. Phys., 1968, 49, 4450–4455 CrossRef CAS.
- B. M. Walsh, N. P. Barnes and B. D. Bartolo, J. Appl. Phys., 1998, 83, 2772–2787 CrossRef CAS.
- Ł. Sójka, Z. Tang, H. Zhu, E. Bereśpawlik, D. Furniss, A. B. Seddon, T. M. Benson and S. Sujecki, Opt. Mater. Express, 2012, 2, 1632–1640 CrossRef.
- L. R. Moorthy, M. Jayasimhadri, A. Radhapathy and R. V. S. S. N. Ravikumar, Mater. Chem. Phys., 2005, 93, 455–460 CrossRef CAS.
- I. Pal, A. Agarwal, S. Sanghi and M. P. Aggarwal, J. Alloys Compd., 2011, 509, 7625–7631 CrossRef CAS.
- R. T. Génova, I. R. Martín, U. R. Rodríguez-Mendoza, F. Lahoz, A. D. Lozano-Gorrín, P. Núñez, J. González-Platas and V. Lavín, J. Alloys Compd., 2004, 380, 167–172 CrossRef.
- K. Binnemans, D. Verboven, C. Görller-Walrand, J. Lucas, N. Duhamel-Henry and J. L. Adam, J. Alloys Compd., 1997, 250, 321–325 CrossRef CAS.
- G. H. Dieke and H. M. Crosswhite, Appl. Opt., 1963, 2, 675–686 CrossRef CAS.
| This journal is © The Royal Society of Chemistry 2017 |