
 Open Access Article
 This Open Access Article is licensed under a
 Creative Commons Attribution 3.0 Unported Licence
Synthesis of a core–shell magnetic Fe3O4–NH2@PmPD nanocomposite for efficient removal of Cr(VI) from aqueous media†
Hongshan Zhu‡
ab,
Jin Wu‡a,
Ming Fang*c,
Liqiang Tana,
Changlun Chenade,
Njud S. Alharbid,
Tasawar Hayate and
Xiaoli Tan *ab
*ab
aInstitute of Plasma Physics, Chinese Academy of Sciences, Hefei, Anhui 230031, P. R. China. E-mail: tanxl@ipp.ac.cn
bUniversity of Science and Technology of China, Hefei, Anhui 230026, P. R. China
cDepartment of Chemical and Material Engineering, Hefei University, Hefei, Anhui, 2300601, P. R. China. E-mail: mfang@issp.ac.cn
dDepartment of Biological Sciences, Faculty of Science, King Abdulaziz University, Jeddah 21589, Saudi Arabia
eNAAM Research Group, King Abdulaziz University, Jeddah 21589, Saudi Arabia
First published on 20th July 2017
Abstract
The synthesis of reclaimable adsorbents with satisfactory adsorption performance and easy separation properties is necessary for environment-related applications. In this study, novel amine-functionalized magnetic Fe3O4 (Fe3O4–NH2) nanoparticles coated with poly(m-phenylenediamine) (Fe3O4–NH2@PmPDs) were synthesized successfully via oxidation polymerization. The as-prepared Fe3O4–NH2@PmPDs with a well-defined core–shell structure were characterized, and their extraordinary Cr(VI) removal capability was investigated. Fe3O4–NH2@PmPDs exhibit high adsorption capacity (508 mg g−1) and fast adsorption rate towards Cr(VI). The abundant nitrogen-containing functional groups on the surface of Fe3O4–NH2@PmPDs greatly contribute to the adsorption/reduction of Cr(VI). Moreover, the intraparticle diffusion model can be used to provide a good explanation of every stage of the process. The calculated thermodynamic parameters suggest that the adsorption of Cr(VI) onto Fe3O4–NH2@PmPDs is endothermic and spontaneous. Fe3O4–NH2@PmPDs can be easily separated, and the regenerated adsorbents still maintain high adsorption capacity. The results imply that Fe3O4–NH2@PmPDs can be regarded as a suitable material for the treatment of Cr(VI) from contaminated water.
1. Introduction
The existence of hazardous metals in the aquatic environment has attracted extensive attention because these metals can pose serious health problems via the food chain.1 Chromium (Cr), resulting from various industrial process such as electroplating, steel making, pigment manufacturing, and wood preservation, is the second most abundant inorganic groundwater contaminant.2,3 In the aquatic environment, Cr is present in the main valence states as Cr(III) and Cr(VI).4 Cr(VI) is a hypertoxic pollutant for humans due to its high water solubility, mobility, and carcinogenicity.2,5 Cr(III), on the other hand, is hypotoxic, slightly soluble, has poor mobility, and is easy to be precipitated as hydroxide.6 In accordance with the World Health Organization (WHO), the contaminant concentration for Cr(VI) in potable and surface waters should be less than 0.05 and 0.1 mg L−1, respectively. To remedy the Cr(VI) pollution, there is an urgent necessity to dispose Cr(VI) before pouring it into river or sea.Various methods including adsorption, biological degradation, membrane separation, ion exchange, filtration, etc. are employed to dispose metal ions from contaminated solutions.7–10 Among these, adsorption is regarded as an efficient way to remove metal ions from the trade effluent because this method is most economically favorable and has simple operation and high efficiency.4 Moreover, different adsorbents such as clays, modified activated carbon, Fe0 and iron oxides, organic–inorganic composites, etc. have been applied for the disposal of Cr(VI).11–17 However, most traditional materials are still far beyond satisfactory for the treatment of Cr(VI) from aqueous medium due to their low adsorption performance, secondary pollution, and complicated preparation methods. Therefore, the design and investigation of new materials with high performance for wastewater treatment are still necessary. In this regard, a number of researchers have tried their best to fabricate new materials with more active sites for Cr(VI) adsorption. Moreover, if Cr(VI) could be reduced to Cr(III), the toxicity might be efficiently reduced. Thus, endowing the adsorbents with reduction property may greatly enhance their Cr(VI) removal capability.
Due to its outstanding reducing property and abundant active functional groups, poly(m-phenylenediamine) (PmPD) nanoparticles seem to be one of the most prospective high-molecular polymer adsorbents.16–18 Nitrogen atoms of amine in PmPD (Fig. S1†.) have a lone pair of electrons that can improve its the adsorption capacity towards Cr(VI) via complexation and reducing action.2 However, few studies have been carried out on their application in Cr(VI) treatment because the PmPD nanoparticles are not easy to be separated from an aqueous solution. Magnetic nanoparticles, especially Fe3O4, have attracted significant attention for their facile separation property and avoidance of precipitation with costly and vast sludge.19–22 However, easy aggregation, presence of less active sites, and difficult control in the nanoscale range for Fe3O4 nanoparticles may cause their low adsorption capacity for Cr(VI) removal (46.79 mg g−1).9,23–26 The magnetic-core and polymer-shell structure synergistically combining the advantages of PmPD and Fe3O4 can efficiently overcome the abovementioned problems. Functional groups are expected to be coated on Fe3O4 for their ability to coordinate Cr(VI/III) ions.20,25–29 Moreover, many magnetic nanocomposites have been fabricated for Cr(VI) removal.20,29–31 However, their adsorption capability is far from being satisfactory. Thus, the development of core–shell magnetic nanocomposites with high adsorption capability for Cr(VI) removal is still a great challenge.
Therefore, the present study was aimed at the controllable preparation of Fe3O4 by grafting amine-functional groups from 1,6-hexanediamine via one-pot solvothermal method; this controllable preparation could impede the nanoparticles against aggregation without disturbing their desirable properties and enhance the nitrogen compounds. Then, the amine-functionalized magnetic Fe3O4 (Fe3O4–NH2) nanoparticles decorated by PmPD (Fe3O4–NH2@PmPDs) can further improve the nitrogen-containing functional groups for Cr(VI) adsorption and reduction. The Fe3O4–NH2@PmPD composites can be easily separated from the contaminated media. Their adsorption behavior towards Cr(VI) was evaluated, showing exceptionally high adsorption performance and sensational recycling. Moreover, detailed investigation of the Cr(VI) adsorbed onto Fe3O4–NH2@PmPDs implies that Cr(VI) is reduced to Cr(III) by benzenoid amine groups on Fe3O4–NH2@PmPDs. In conclusion, the design of Fe3O4–NH2@PmPDs provides a novel insight into the use of core–shell nanoparticles for the Cr(VI) removal, and these Fe3O4–NH2@PmPDs exhibit tremendous potential for Cr(VI) removal from Cr-contaminated wastewater.
2. Materials and methods
2.1 Materials
Sodium citrate (NaC6H5O7), anhydrous sodium acetate (CH3COONa), ferric chloride hexahydrate (FeCl3·6H2O), ethylene glycol (HOCH2)2, sodium persulfate (Na2S2O8), 1,6-hexanediamine, and m-phenylenediamine were purchased as analytical reagents from Sinopharm Chemical Reagent Co. Ltd. and used without any purification. Storing solution including 360 mg L−1 Cr(VI) was provided by dissolving K2Cr2O7. Milli-Q water was used for the preparation of solutions in the experiment.2.2 Preparation of Fe3O4–NH2 and Fe3O4–NH2@PmPDs
Fe3O4–NH2 nanoparticles were synthesized utilizing one-pot solvothermal method via the morphology-mediated (1,6-hexanediamine) and the precursor (FeCl3·6H2O), which were different from those reported in some previous studies.21,22 1,6-Hexanediamine (8 g), NaC6H5O7 (6 g), and FeCl3·6H2O (2 g) were dissolved in (HOCH2)2 (60 mL) under ultrasonication, and the mixture was homogenized via magnetic stirring for several hours. Then, the mixture was placed in a Teflon-lined autoclave and heated at 200 °C for 10 h. The obtained sample was ultrasonically washed several times with water and ethanol and then dried in vacuum.Fe3O4–NH2@PmPD nanocomposites were synthesized by a modified ice-water bath method. Briefly, Fe3O4–NH2 (0.3 g) was added to the aqueous solution (300 mL) under ultrasonication for 20 min. After this, the suspension was intensely stirred at 0 °C for 10 min. Then, m-phenylenediamine and Na2S2O8 were placed in the suspension while maintaining the state for 5 h. Finally, the as-prepared composites were washed with water and ethanol and dried in vacuum at 60 °C. Fe3O4–NH2 nanoparticles in different mass ratios with respect to m-phenylenediamine (4![[thin space (1/6-em)]](https://www.rsc.org/images/entities/char_2009.gif) :1, 1:1, and 1:4) were fabricated, which were named as 4:1Fe3O4–NH2@PmPDs, 1:1Fe3O4–NH2@PmPDs, and 1:4Fe3O4–NH2@PmPDs, respectively.
:1, 1:1, and 1:4) were fabricated, which were named as 4:1Fe3O4–NH2@PmPDs, 1:1Fe3O4–NH2@PmPDs, and 1:4Fe3O4–NH2@PmPDs, respectively.
000 and 30000 Oe. The core–shell nanoparticles were also investigated via Raman spectroscopy (RAMANLOG 6, SPEX company, USA) at room temperature.2.3 Batch experiments
The adsorption experiments were performed in 10 mL polythene centrifuge tubes. Different volume of adsorbents (1.5 g L−1) and Cr(VI) (360 mg L−1) were added to the suspensions with the desired concentrations of the solid/solution = 0.15 g L−1, [Cr(VI)] = 60 mg L−1. The suspensions were also mixed with NaCl (0.001, 0.01 or 0.1 mol L−1) for ionic strength investigation. Moreover, the desired pH of the suspensions was adjusted using negligible amounts of 0.1 M HCl or NaOH. For isotherm and kinetics experiments, pH was controlled at 2.0 and the temperature was set at 313 K. To achieve the adsorption equilibrium, the suspensions were shaken for at least 12 h, and then, a magnet was used to separate the solid from the solid–liquid mixed phase. Finally, the concentration of Cr(VI) was detected via the spectrophotometric method (λmax = 540 nm) using diphenylcarbazide as the chromogenic reagent.Recycling of Fe3O4–NH2@PmPDs was tested using a 0.5 M NaOH solution as the desorbing agent at room temperature. The adsorbents were added to the NaOH solution under ultrasonication (1 h), intensely stirred (10 h), obtained via magnetic separation, and washed several times with water. The recycled adsorbents can be extracted and used for the disposal of Cr(VI) again.
The concentration of Cr(VI) adsorbed on Fe3O4–NH2 or Fe3O4–NH2@PmPDs was determined via the differences between the original concentration (C0, mg L−1) and final concentration (Ce, mg L−1). Accordingly, the removal% representing the percentage of Cr(VI) removal as compared to the initial concentration of Cr(VI), distribution coefficient (Kd), and the adsorption capacity (Cs, mg g−1) were expressed as follows:17,27
 | (1) |
 | (2) |
 | (3) |
3. Results and discussion
3.1 Characterization of Fe3O4–NH2 and Fe3O4–NH2@PmPDs
The TEM images of the as-prepared Fe3O4–NH2 and Fe3O4–NH2@PmPD nanoparticles are shown in Fig. 1. The Fe3O4–NH2 nanoparticles have a mean diameter of ∼50 nm and a rough surface. Moreover, they are transparent materials due to the presence of a specific ligand (–NH2) on the surface of nanoparticles. The TEM image clearly shows that the core–shell Fe3O4–NH2 nanoparticles are coated with PmPD. The average thicknesses of PmPD on the surface of 4:1Fe3O4–NH2@PmPDs, 1:1Fe3O4–NH2@PmPDs, and 1:4Fe3O4–NH2@PmPDs are approximately 10, 30, and 45 nm, respectively. An HRTEM analysis indicates that the lattice spacing of 0.484 nm is well coincident with the (111) lattice plane of Fe3O4,20 which is the crystallographic plane with the highest energy and preferential for oriented attachment. The energy dispersive X-ray spectroscopy (EDS) spectra of 4:1Fe3O4–NH2@PmPDs, 1:1Fe3O4–NH2@PmPDs, and 1:4Fe3O4–NH2@PmPDs show that the mass ratios of Fe and N (Fe:N) are 8.2, 2.6, and 1.2 for 4:1Fe3O4–NH2@PmPDs, 1:1Fe3O4–NH2@PmPDs, and 1:4Fe3O4–NH2@PmPDs (Table S1†), respectively.
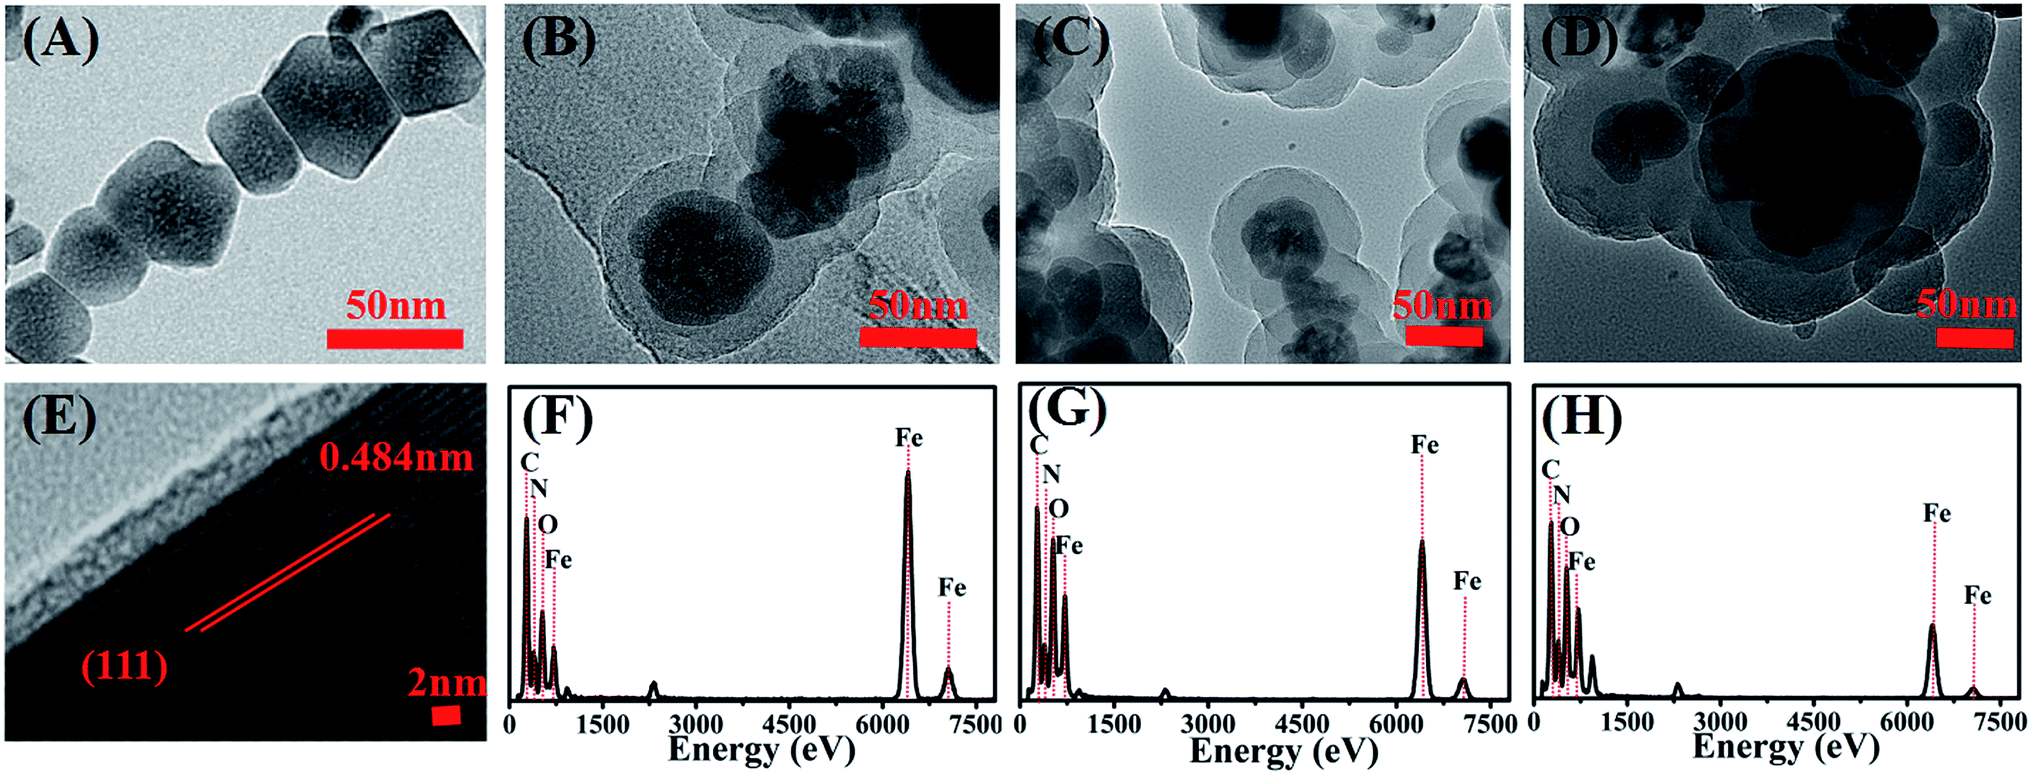 | ||
| Fig. 1 Representative TEM, HRTEM, and EDS images. Fe3O4–NH2 (A and E), 4:1Fe3O4–NH2@PmPDs (B and F), 1:1Fe3O4–NH2@PmPDs (C and G), and 1:1Fe3O4–NH2@PmPDs (D and H). | ||
The XRD peaks of Fe3O4–NH2 and Fe3O4–NH2@PmPDs (Fig. 2A) at 18.35, 30.14, 35.52, 43.12, 53.42, 57.06, and 62.68° are specified to the indices (111), (220), (311), (400), (422), (511), and (440) of Fe3O4 by MDI jade 6.0, indicating the magnetite phase with a face-centered cubic structure.32 After polymerization, the characteristic diffraction peaks are well preserved; this suggests that the structure of Fe3O4 is not affected by the oxidation polymerization of PmPD.
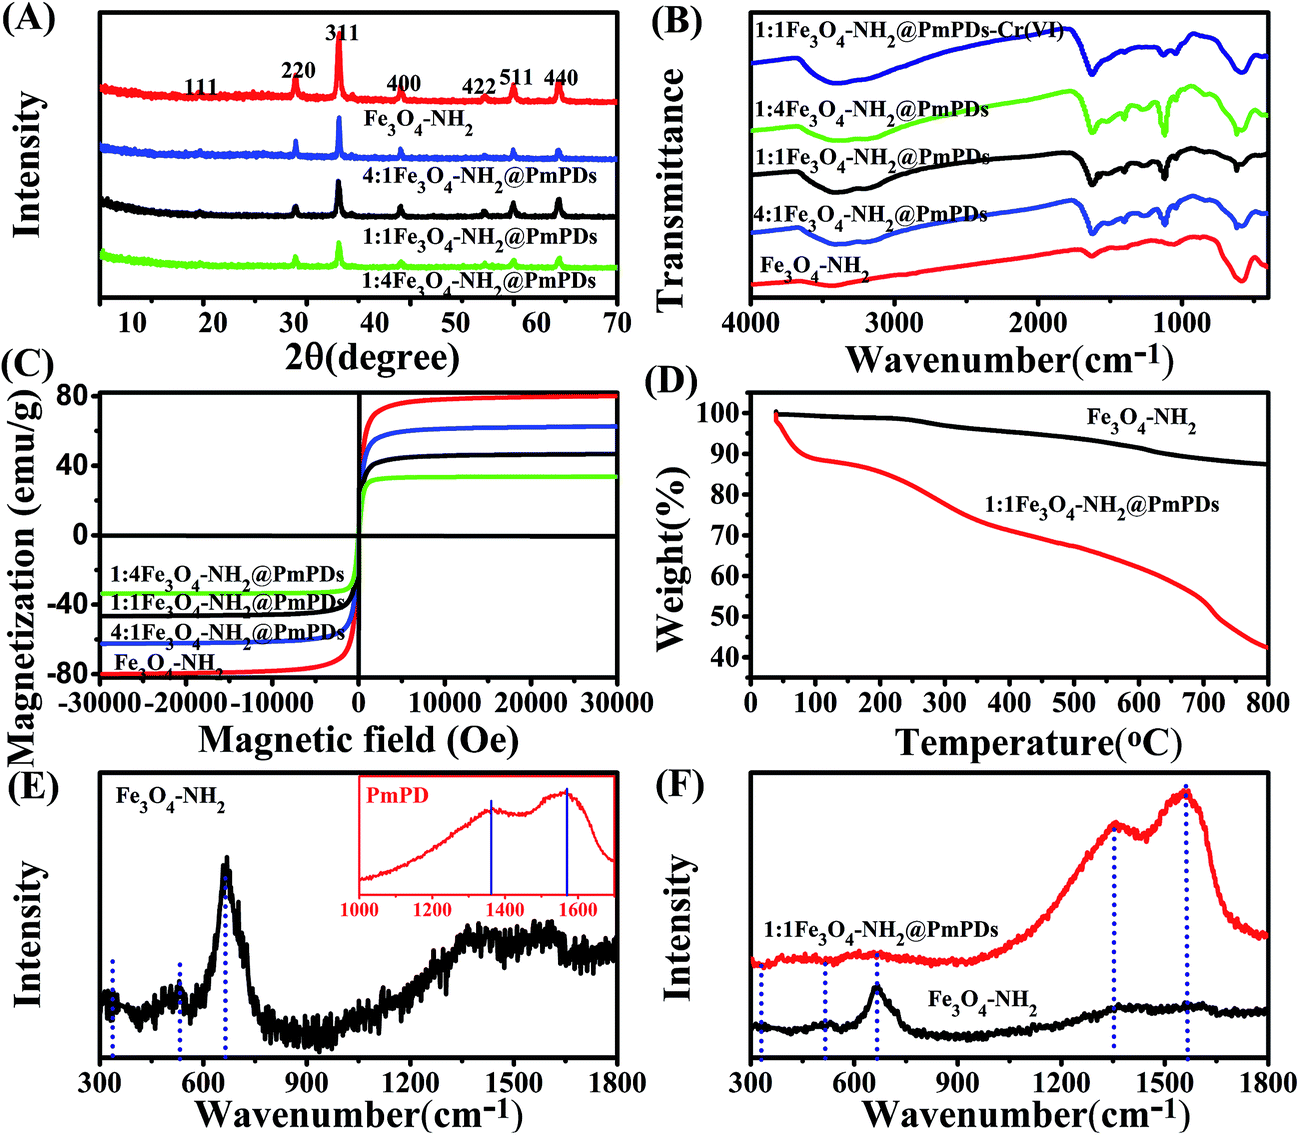 | ||
| Fig. 2 XRD patterns (A), FT-IR spectra (B), magnetic hysteresis loop (C), TGA (D), and Raman spectra (E and F) of Fe3O4–NH2 and 1:1Fe3O4–NH2@PmPDs. | ||
To verify the chemical components and functional groups in Fe3O4–NH2 and Fe3O4–NH2@PmPDs, FT-IR spectroscopy was performed. For Fe3O4–NH2 nanoparticles, as shown in Fig. 2B, the peaks are attributed to the Fe–O lattice model of Fe3O4 (582 cm−1) and N–H stretching vibration (874, 1626, and 3436 cm−1).33,34 The results imply that the amino groups were successfully grafted on the surface of Fe3O4. Moreover, new peaks appear in the FT-IR spectra of Fe3O4–NH2@PmPDs, which are ascribed to the C–N stretching vibration (1270 cm−1), quinoid ring stretching (1620 cm−1), and benzenoid ring stretching (1500 cm−1), confirming the coated PmPD on Fe3O4–NH2 nanoparticles.35 The abundant nitrogen-containing functional groups on Fe3O4–NH2@PmPDs can greatly contribute to Cr(VI) adsorption. After Cr(VI) adsorption (Fe3O4–NH2@PmPDs-Cr), the peaks at 874 and 1500 cm−1 of Fe3O4–NH2@PmPDs-Cr become weaker; this suggests that Cr(VI) interacts with the nitrogen-containing functional groups. The relative intensity of quinoid imine (1620 cm−1) increases due to the oxidation of benzenoid amine to quinoid imine during the reduction of Cr(VI).20
The magnetization hysteresis loops were employed to investigate the saturation magnetization of the adsorbents at room temperature (Fig. 2C). The saturation magnetizations of Fe3O4–NH2, 4:1Fe3O4–NH2@PmPDs, 1:1Fe3O4–NH2@PmPDs, and 1:4Fe3O4–NH2@PmPDs are 80.02, 66.60, 54.46, and 33.65 emu, respectively, implying a satisfactory magnetic property of the adsorbents.14 Therefore, the Fe3O4–NH2@PmPD composites can be easily separated from the contaminated media.
The PmPD-coated Fe3O4–NH2 nanoparticles were further confirmed via TGA under a N2 atmosphere. The curve of the Fe3O4–NH2 nanoparticles shows the slight weight loss (1.1%) in the range from 50 to 150 °C due to the removal of moisture and ethanol in the first step (Fig. 2D); the second weight loss (2.5%) in the range from 150 to 320 °C is due to the phase transformation of Fe3O4; the third weight loss (9%) from 320 to 750 °C due to the decomposition of organic moieties indicates that the surface of Fe3O4 is covered with abundant amino groups. For 1:1Fe3O4–NH2@PmPDs, the TGA presents a weight loss (9.3%) due to the removal of moisture below 150 °C and a rapid weight loss (43.4%) from 320 to 800 °C due to the decomposition of PmPD. After heating to 320 °C, the weight of the residues for Fe3O4–NH2 is greater than that for 1:1Fe3O4–NH2@PmPDs; this confirms that PmPD is successfully grafted on the surface of Fe3O4–NH2.
Raman spectra of the synthesized Fe3O4–NH2 and PmPD are presented in Fig. 2E. The characteristic peaks of 331, 524, and 670 cm−1 confirm that Fe3O4 is composed of the magnetite phase.36 The peaks in the range from 1300 to 1700 cm−1 for Fe3O4–NH2 can be attributed to the in-plane bond-stretching of sp2 hybridized carbon atoms, the presence of defects, and the specific ligand (–NH2) on the surface of Fe3O4–NH2.37 The characteristic peaks at ∼1573 and ∼1352 cm−1 for PmPDs are attributed to the benzenoid and quinoid bands, respectively.38 As observed from Fig. 2F, the characteristic peaks of Fe3O4 decrease or completely disappear (especially 670 cm−1) in the spectrum of 1:1Fe3O4–NH2@PmPDs; this indicates that Fe3O4–NH2 is surrounded by PmPDs. This phenomenon is similar to the change in the other core/shell nanostructures.39
3.2 Effects of mass ratios and adsorbent contents on the Cr(VI) removal
Cr(VI) adsorbed on Fe3O4–NH2@PmPDs with different mass ratios (Fe3O4–NH2:PmPD) is shown in Fig. 3A. The adsorption capacity of Fe3O4–NH2@PmPDs is much higher than that of Fe3O4–NH2. With the increase of the PmPD loading ratio, the adsorption capacity of Fe3O4–NH2@PmPDs increases. The more the addition of PmPD, the more the adsorption increase for Cr(VI); however, the addition of PmPD does not favor the magnetic property. It should be noted that the saturation magnetization of adsorbents gradually decreases with the coating of PmPD; thus, the mass of PmPD should be reasonably controlled. Based on these reasons, 1:1Fe3O4–NH2@PmPDs should be a suitable adsorbent. To further investigate the performance of the adsorbent, 1:1Fe3O4–NH2@PmPDs were chosen as adsorbents in the following experiments.
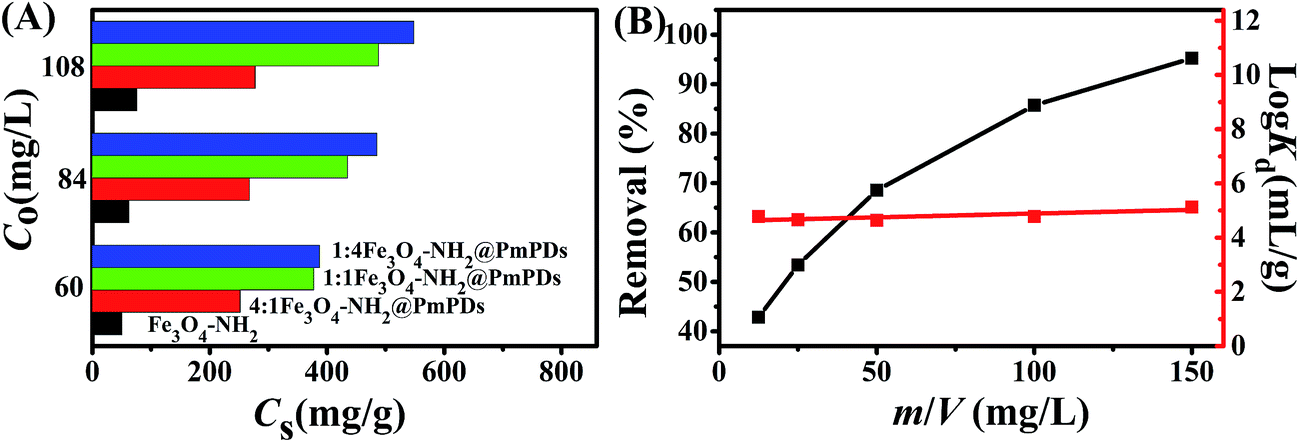 | ||
| Fig. 3 Adsorbents with different mass ratios for Cr(VI) removal (A); the adsorption of Cr(VI) on 1:1Fe3O4–NH2@PmPDs as a function of adsorbent content (B). m/V = 0.15 g L−1, time = 12 h. [Cr(VI)] = 60 mg L−1. | ||
For a fixed initial concentration of an adsorbate, the adsorbent content is a vital factor that determines the adsorption performance of the adsorbent. Fig. 3B depicts the dependence of Cr(VI) adsorption on 1:1Fe3O4–NH2@PmPDs as a function of adsorbent contents ranging from 1.25 to 150 mg L−1 with other variables kept constant. A meaningful result can be found that the adsorption percentage quickly increases with the increasing content of 1:1Fe3O4–NH2@PmPDs. The phenomenon is interpreted as follows: the increased 1:1Fe3O4–NH2@PmPDs lead to abundant active sites for Cr(VI) adsorption.27 The distribution coefficient Kd is generally employed to research the affinity of the adsorbent for the adsorbate. The affinity of 1:1Fe3O4–NH2@PmPDs for Cr(VI) ions is almost hardly dependent on the 1:1Fe3O4–NH2@PmPD contents ranging from 1.25 to 150 mg L−1. Moreover, the 1:1Fe3O4–NH2@PmPDs have logKd values above 4.5 mL g−1, implying the high affinity of 1:1Fe3O4–NH2@PmPDs for Cr(VI).17 Thereby, 1:1Fe3O4–NH2@PmPDs can be considered as an applicable material for the treatment of Cr(VI) from large quantities of polluted water.
3.3 Effect of pH and ion strength
The as-prepared 1:1Fe3O4–NH2@PmPDs were employed to study the Cr(VI) removal at various pH values. It can be seen in Fig. 4A that as the pH increases from 2.0 to 9.0, the adsorption capacity of Cr(VI) on 1:1Fe3O4–NH2@PmPDs decreases from approximately 380 to 40 mg g−1 at C0 (60 mg L−1), and its adsorption versus pH trend is consistent with previously reported research.2 The adsorption process for Cr(VI) can be explained by the physicochemical properties of 1:1Fe3O4–NH2@PmPDs and the speciation distribution of Cr(VI) in water solutions in a specific pH range. The existing state of Cr(VI) is sensitive to the pH of the solution, as shown in Fig. 4B. At 2.0 < pH < 4.5, the main existing form is HCrO4− (nearly 100%). When pH > 4.5, as the HCrO4− species reduces, the CrO42− species increases and goes up to nearly 100% at pH 9.0. The other species maintain a small amount without changing obviously in the range of pH from 2.0 to 9.0. The zeta potential of 1:1Fe3O4–NH2@PmPDs, depending on the property of the particles surface, was investigated, as shown in Fig. 4C. The zeta potentials > +30 mV at pH 2.0–3.0 suggest the excellent stability of 1:1Fe3O4–NH2@PmPDs.40 The point of zero charge (pHzpc) value of 1:1Fe3O4–NH2@PmPDs is ∼6.4. The surface of 1:1Fe3O4–NH2@PmPDs is positive at pH < pHzpc and negative at pH > pHzpc. Cr(VI) removal by 1:1Fe3O4–NH2@PmPDs decreases with the pH values increasing from 2.0 to 9.0 due to surface complexation and reduction reaction. When pH < 6.4, Cr(VI) ions can be easily adsorbed on the surface of 1:1Fe3O4–NH2@PmPDs due to the negatively charged Cr(VI) ions that are deemed to show a strong attraction for the positively charged 1:1Fe3O4–NH2@PmPD surface. Moreover, the complexation of Cr(VI) by amine groups accompanied by the reduction of Cr2O72− to Cr3+ also contributes to the Cr(VI) removal. When pH > 6.4, CrO42− would be repelled from the negatively charged surface, and the poor adsorption performance is caused by the lack of electrostatic affinity and the less amount of Cr2O72− reduced by benzenoid amine. Therefore, Cr(VI) removal could reach the maximum value at low pH in this study. It can be seen from Fig. 4D that the solution pH increases after Cr(VI) is adsorbed on 1:1Fe3O4–NH2@PmPDs. It is mainly due to the consumption of H+ during the protonation of amine groups (–NH2) to –NH3+ form for the complexation of Cr(VI).41,42 Moreover, the reduction of Cr(VI) by benzenoid amine occurs along with the consumption of H+ or generation of OH− in the reduction phase, and the reaction equations can be shown as follows:17| Cr2O72− + 14H+ + 6e → 2Cr3+ + 7H2O | (4) |
| Cr2O72− + 7H2O + 6e → 2Cr(OH)3(aq) + 8OH− | (5) |
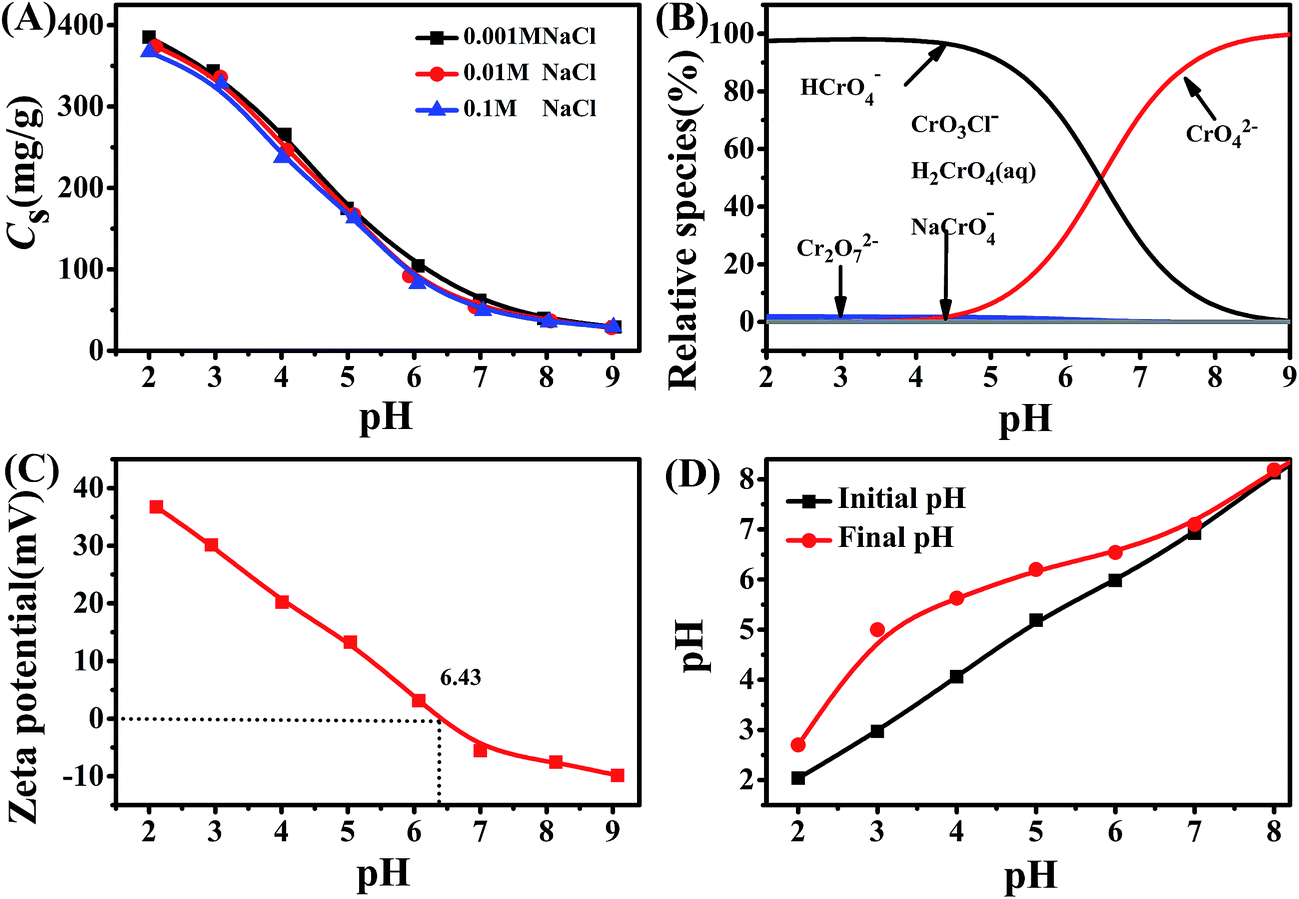 | ||
| Fig. 4 Effect of pH on Cr(VI) adsorption on 1:1Fe3O4–NH2@PmPDs at different ionic strengths (A); distribution of Cr(VI) species in aqueous solutions (B); zeta potentials of 1:1Fe3O4–NH2@PmPDs at various solution pH values (C); and the change of initial pH and final pH (D). m/V = 0.15 g L−1, time = 12 h, [Cr(VI)] = 60 mg L−1. | ||
Investigation of ionic strength is conducive to verify the practical usability of 1:1Fe3O4–NH2@PmPDs for the treatment of Cr(VI)-contaminated water. The ionic strength has an effect on the electrostatic attraction for changing the electric double layer thickness and interface potential, which can be interpreted by outer-sphere or inner-sphere surface complexation.43 The outer-sphere complexation, including electrostatic interaction, is sensitive to ionic strength, but the inner-sphere complexation is insensitive to ionic strength due to the formation of strong chemical bonds between the adsorbate and functional groups.44 The weak interaction of foreign ions for Cr(VI) adsorption indicates that the adsorption process accords to the inner-sphere surface complexation. In conclusion, the results suggest that the complexation of Cr(VI) by the nitrogen-containing groups and the reduction of Cr(VI) to Cr(III) via amine groups are the principal factors promoting the adsorption.
3.4 Adsorption isotherm
The adsorption isotherm is regarded as one of the fundamental information about the adsorption process. The adsorption isotherms of Cr(VI) onto the 1:1Fe3O4–NH2@PmPDs at 298, 313, and 328 K were obtained and are displayed in Fig. 5A. Obviously, the adsorption capacity is highest at 328 K and lowest at 298 K, implying that the increase in temperature is beneficial to Cr(VI) removal via 1:1Fe3O4–NH2@PmPDs.
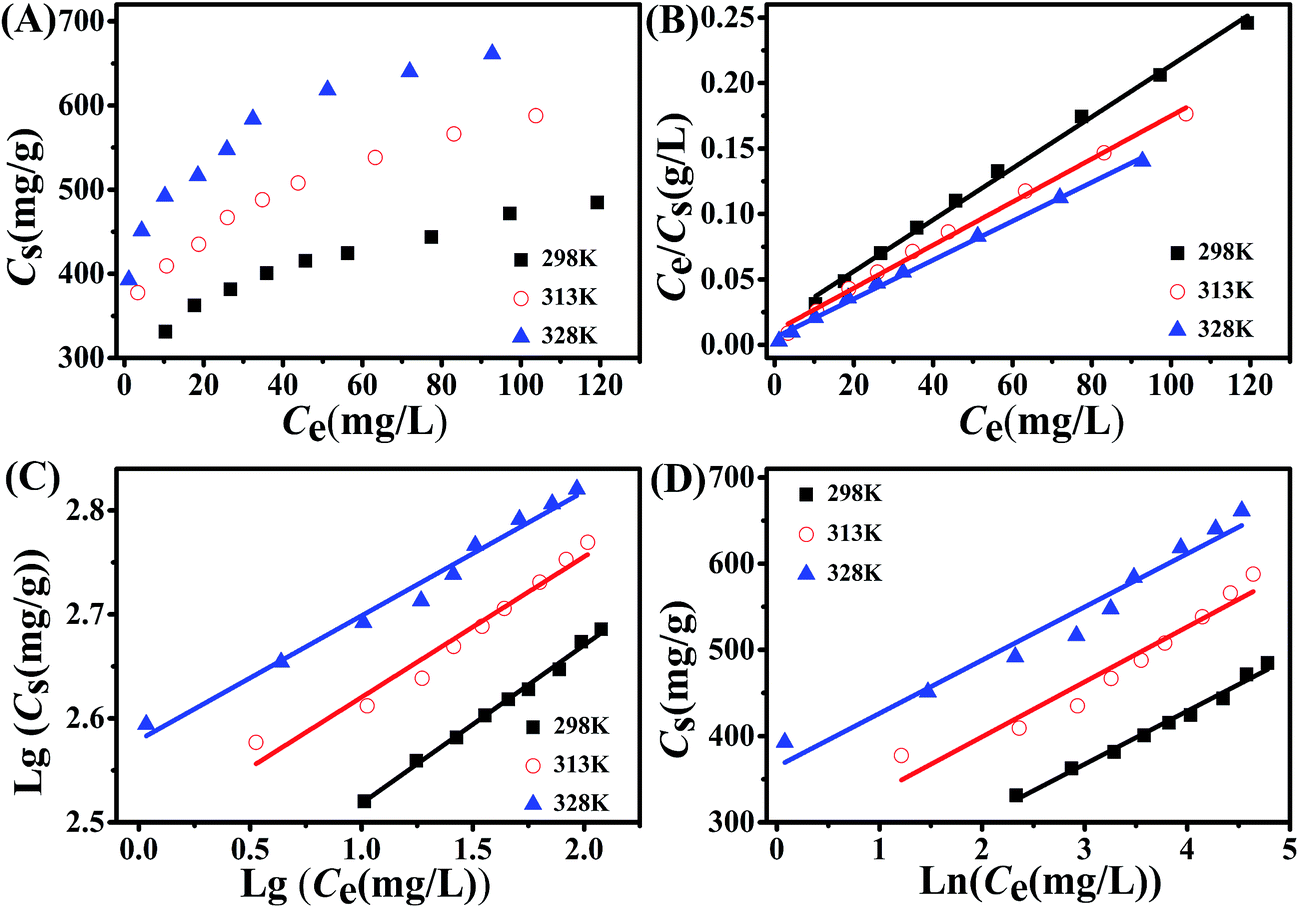 | ||
| Fig. 5 The adsorption isotherms of Cr(VI) on 1:1Fe3O4–NH2@PmPDs (A) and the simulations with Langmuir (B), Freundlich (C), and Temkin (D) models at three different temperatures. m/V = 0.15 g L−1, time = 12 h. | ||
The Langmuir, Freundlich, and Temkin models were used to fit the isotherm data.29,45,46 These equations are represented as follows:
Langmuir equation:
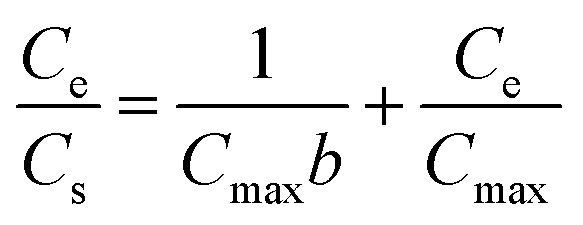 | (6) |
Freundlich equation:
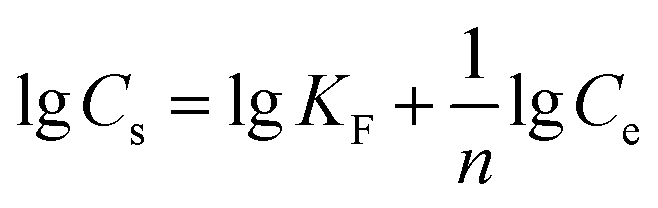 | (7) |
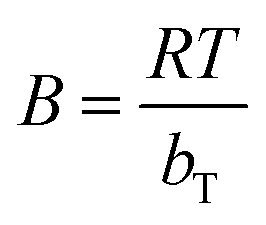
Temkin equation:
|
Cs = BlnKT + BlnCe
| (8) |
 | (9) |
:1Fe3O4–NH2@PmPDs. KF and 1/n reflect the adsorption performance and the adsorption intensity. B represents the heat of adsorption. R is 8.314 J (mol K)−1 and T (K) represents the temperature. KT and bT are related to the maximum binding energy and heat of adsorption, respectively. The obtained parameters calculated from the isotherm equations are given in Table 1. The correlation coefficients R2 of the Langmuir model are higher than those of other models for three different temperature conditions, indicating that the Langmuir model can satisfactorily depict the adsorption process. The calculated maximum adsorption capacities are 675, 610, and 508 mg g−1 at 328, 313, and 298 K, respectively. The maximum adsorption capacities for 4:1Fe3O4–NH2@PmPDs, 1:1Fe3O4–NH2@PmPDs, and 1:4Fe3O4–NH2@PmPDs were also investigated (Fig. S2 and Table S1†). Especially, the maximum mass ratios between the adsorbed Cr(VI) and the N-based group are about 3.68, 3.65, and 2.79 for 4:1Fe3O4–NH2@PmPDs, 1:1Fe3O4–NH2@PmPDs, and 4:1Fe3O4–NH2@PmPDs, respectively. Compared with those of other magnetic adsorbents, as shown in Table 2, the adsorption capacity of 1:1Fe3O4–NH2@PmPDs is significantly better. The excellent adsorption performance can be attributed to the abundant nitrogen-containing groups on the Fe3O4 surface. The 1:1Fe3O4–NH2@PmPDs can offer more active sites than the reported adsorbents, and the adsorption–reduction method is a good strategy for the removal of Cr(VI).30,31,47 The Freundlich model and Temkin equation can also show some available information with high credibility in mathematics. From the Freundlich model, the values of 1/n in the range between 0 and 1 demonstrate that the adsorption process is an advantageous and chemisorption process,48 and the values of KF increasing in the wake of increasing temperature suggest an endothermic process.49 The values of KT and bT highly confirm the strong interaction between Cr(VI) and 1:1Fe3O4–NH2@PmPDs and the adsorption process corresponding to the chemical reaction process.
:1Fe3O4–NH2@PmPDs
| Model | Langmuir | Freundlich | Temkin | ||||||
|---|---|---|---|---|---|---|---|---|---|
| T (K) | Cmax (mg g−1) | b (L mg−1) | R2 | KF | 1/n | R2 | KT (L mg−1) | bT (J mol−1) | R2 |
| 298 | 508 | 0.116 | 0.996 | 232 | 0.152 | 0.994 | 19.42 | 40.22 | 0.986 |
| 313 | 610 | 0.156 | 0.995 | 306 | 0.135 | 0.959 | 70.97 | 40.82 | 0.933 |
| 328 | 675 | 0.267 | 0.996 | 379 | 0.120 | 0.981 | 368.2 | 44.18 | 0.956 |
:1Fe3O4–NH2@PmPDs with those of other adsorbents
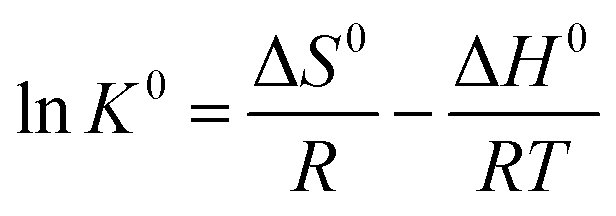
The thermodynamic parameters of Gibbs free energy change (ΔG0), enthalpy change (ΔH0), and entropy change (ΔS0) were employed to explore the thermal properties of the adsorption process. The functions are represented as follows:
|
ΔG0 = −RTlnK0
| (10) |
 | (11) |
K0 is calculated via plotting lnKd versus Ce with extrapolating Ce to 0. The thermodynamic parameters of Cr(VI) adsorption on 1:1Fe3O4–NH2@PmPDs are shown in Table 3. The positive values of ΔH0 increase as the temperature increases; this implies an endothermic adsorption process of Cr(VI) adsorption on 1:1Fe3O4–NH2@PmPDs. The values of ΔG0 also become more negative as the temperature increase; this indicates that Cr(VI) is beneficial to be adsorbed at high temperatures, and the process is spontaneous. Moreover, the positive ΔS0 suggests that the randomness increases at the solid/solution interface with Cr(VI) adsorbed on 1:1Fe3O4–NH2@PmPDs.
:1Fe3O4–NH2@PmPDs
| T (K) | ΔG0 (kJ mol−1) | ΔS0 (J (mol K)−1) | ΔH0 (kJ mol−1) |
|---|---|---|---|
| 298 | −5.736 | 203.1 | 54.79 |
| 313 | −6.204 | 57.37 | |
| 328 | −6.645 | 59.97 |
3.5 Adsorption kinetics
The kinetics of Cr(VI) removal by 1:1Fe3O4–NH2@PmPDs is presented in Fig. 6A. The Cr(VI) adsorption is rapid within 200 min, in which about 80% of Cr(VI) is disposed of by 1:1Fe3O4–NH2@PmPDs; this is attributed to the abundant surface active sites for the Cr(VI) surface adsorption/reduction reaction.2 Then, the Cr(VI) removal considerably slow down until it reaches equilibrium at 500 min, as well as approximately 10% Cr(VI) is adsorbed due to the relatively low residual Cr(VI) interacting with the Cr-coated 1:1Fe3O4–NH2@PmPDs. In a practical application, the optimal contact time can be selected according to the adsorption kinetics.
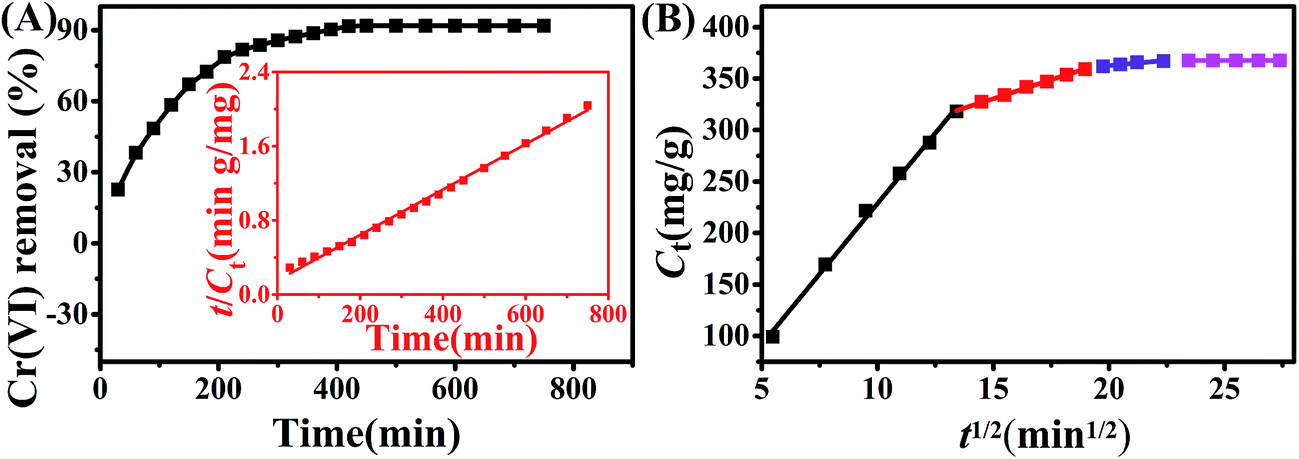 | ||
| Fig. 6 The effect of contact time on adsorption capacity of 1:1Fe3O4–NH2@PmPDs and fitting of the pseudo-second-order kinetic model (A) and intraparticle diffusion model (B). m/V = 0.15 g L−1, [Cr(VI)] = 60 mg L−1. | ||
To further investigate the underlying kinetics of Cr(VI) adsorption onto 1:1Fe3O4–NH2@PmPDs, the pseudo-second-order kinetic and the intraparticle diffusion model were employed to simulate these experimental kinetic data.20,49 Moreover, the parameters for kinetic equations are shown in Table 4. Among them, the correlation coefficients suggest that the pseudo-second-order kinetic equation can commendably depict the entire adsorbent systems. The adsorption of Cr(VI) on 1:1Fe3O4–NH2@PmPDs is mostly chemisorption involving the complexation of Cr(VI) and then reduction of Cr(VI) to Cr(III) through amine groups.43 Some of the forefathers' research also confirm that the Cr(VI) removal can be well described by the pseudo-second-order kinetic model.2,17
:1Fe3O4–NH2@PmPDsa
| Model | Equation | Parameters | 1:1Fe3O4–NH2@PmPDs |
|---|---|---|---|
| a k2, kid, and A are the constants of the kinetic equations. Ce and Ct are the amount of Cr(VI) adsorption onto 1:1Fe3O4–NH2@PmPDs at equilibrium and at time t. |
|||
| Pseudo second order |  |
k2 (g (mg min)−1) | 0.000037 |
| Ce (mg g−1) | 417 | ||
| R2 | 0.996 | ||
| Intraparticle diffusion | Ct = kidt1/2 + A | The first stage | |
| kid (g (mg min)−1) | 27.37 | ||
| A (mg g−1) | −44.91 | ||
| Rid2 | 0.995 | ||
| The second stage | |||
| kid (g (mg min)−1) | 7.32 | ||
| A (mg g−1) | 220.63 | ||
| Rid2 | 0.998 | ||
| The third stage | |||
| kid (g (mg min)−1) | 2.04 | ||
| A (mg g−1) | 321 | ||
| Rid2 | 0.936 | ||
| The fourth stage | |||
| kid (g (mg min)−1) | 0 | ||
| A (mg g−1) | 368 | ||
| Rid2 | 1 | ||
The removal of Cr(VI) on 1:1Fe3O4–NH2@PmPDs may undergo many steps during the whole reaction process. Thus, the intraparticle diffusion model was employed to simulate these experimental kinetic data aiming at distinguishing the different stages.50 As observed from Fig. 6B, adsorption is not the sole step of the rate-limiting reaction because the plots of qt versus t1/2 do not yield a straight line passing through the origin.20 The whole adsorption process can be divided into four sections as follows: (i) Cr(VI) rapidly reaches the external surface of 1:1Fe3O4–NH2@PmPDs on account of abundant active sites for Cr(VI) instantaneous adsorption; (ii) the adsorption slows down because the rate-limiting step for Cr(VI) diffusion into the pore microstructure or the interspace of nanoparticles;20,41 (iii) the intraparticle diffusion slows down considerably due to the low residual Cr(VI) and the interaction with the consumed functional groups; and (iv) Cr(VI) adsorption reaches equilibrium in the final stage, which is excellently stable.
3.6 Adsorption mechanism
XPS was employed to accurately analyze the surface chemical compositions of 1:1Fe3O4–NH2@PmPDs before and after Cr(VI) adsorption. In the survey spectra, the peaks including C 1s, O 1s, N 1s, and Cr 2p can be observed (Fig. 7A). New peaks emerge nearby the binding energy of 577.5 eV, corresponding to the photoelectron spectra of Cr 2p, suggesting Cr(VI) adsorption on the near surface of 1:1Fe3O4–NH2@PmPDs. Moreover, the spectra of Cr 2p shows two peaks: Cr 2p3/2 (577.8) and Cr 2p1/2 (587.0) via the high-resolution XPS spectrum (Fig. 7B). The broad peak of Cr 2p3/2 can be divided into two peaks at the binding energies of 578.1 and 576.3 eV, corresponding to the features of Cr(VI) and Cr(III), respectively.50 Moreover, it indicates that part of adsorbed Cr(VI) has been reduced to Cr(III) on the surface of 1:1Fe3O4–NH2@PmPDs. For comparison, the mass rates of Cr(III) and Cr(VI) adsorbed onto the surface of 1:1Fe3O4–NH2@PmPDs are calculated to be 53.3% and 46.7%, respectively. The changes of N 1s were also investigated by the high-resolution XPS spectra (Fig. 7C and D). Before Cr(VI) adsorption, the broad peak of N 1s can be divided into two peaks at the binding energies of 399.0 eV, corresponding to the benzenoid amine groups (–N![[double bond, length as m-dash]](https://www.rsc.org/images/entities/char_e001.gif) , 12%), and 399.79 eV, corresponding to the quinoid imine groups (–NH–, 88%), indicative of the grafted PmPD on the surface of Fe3O4.20 In addition, the mass fractions of benzenoid amine groups and quinoid imine groups for 1:1Fe3O4–NH2@PmPDs are about 2.01% and 14.70%, respectively (Table S1†). New peak appears at the binding energy of 400.58 eV, corresponding to –N+ (35%) after Cr(VI) adsorption. The phenomenon indicates that the increased –N can be produced by –NH– during the course of reduction of Cr(VI) to Cr(III). Moreover, –N+ is derived from the in situ doping of H+ and positive Cr(III) on quinoid imine. The consumption of H+ also contributes to the increase of solution pH after Cr(VI) adsorption. The results agree well with the FT-IR analysis results stating that the adsorption of Cr(VI) occurs via the nitrogen-containing functional groups, and then, Cr(VI) is reduced to Cr(III) following the oxidation of benzenoid amine to quinoid imine.
, 12%), and 399.79 eV, corresponding to the quinoid imine groups (–NH–, 88%), indicative of the grafted PmPD on the surface of Fe3O4.20 In addition, the mass fractions of benzenoid amine groups and quinoid imine groups for 1:1Fe3O4–NH2@PmPDs are about 2.01% and 14.70%, respectively (Table S1†). New peak appears at the binding energy of 400.58 eV, corresponding to –N+ (35%) after Cr(VI) adsorption. The phenomenon indicates that the increased –N can be produced by –NH– during the course of reduction of Cr(VI) to Cr(III). Moreover, –N+ is derived from the in situ doping of H+ and positive Cr(III) on quinoid imine. The consumption of H+ also contributes to the increase of solution pH after Cr(VI) adsorption. The results agree well with the FT-IR analysis results stating that the adsorption of Cr(VI) occurs via the nitrogen-containing functional groups, and then, Cr(VI) is reduced to Cr(III) following the oxidation of benzenoid amine to quinoid imine.
 | ||
| Fig. 7 XPS wide spectra of 1:1Fe3O4–NH2@PmPDs before and after Cr(VI) adsorption (A), Cr 2p (B), N 1s XPS spectra of 1:1Fe3O4–NH2@PmPDs (C) and 1:1Fe3O4–NH2@PmPDs with Cr(VI) adsorbed (D). | ||
Based on the abovementioned analyses and discussion, the Cr(VI) adsorption mechanism is illustrated in Fig. 8. The Cr(VI) adsorption involves the following steps: (i) Cr(VI) species are adsorbed by the abundant surface active sites from –NH2 and PmPD via the inner-sphere surface complexation; (ii) Cr(VI) is reduced to Cr(III) by benzenoid amine groups from PmPD; and (iii) Cr(III) readily interacts with imino groups through coordination.
 | ||
| Fig. 8 The schematic of Cr(VI) adsorption and reduction mechanisms. | ||
3.7 Recycle and desorption performance
The recycle performance of 1:1Fe3O4–NH2@PmPDs is a principal factor to assess the cost-effectiveness of the adsorbents. Desorption of the adsorbed Cr(VI) from 1:1Fe3O4–NH2@PmPDs was carried out with NaOH (1mol L−1) because the affinity of 1:1Fe3O4–NH2@PmPDs gradually weakened with the increasing pH. As observed from the Fig. 9, the adsorption capacities of five cycles are 389, 367, 343, 337, and 332 mg g−1, respectively. The results indicate that the adsorption capacity still retains a high level during the repeated adsorption and desorption operations. The recovered nitrogen-containing functional groups and the remaining imino groups of Fe3O4–NH2@PmPDs can act as the surface active sites for the adsorption of Cr(VI) in the next cycle. The inset image of the separation using an external magnet suggests that Fe3O4–NH2@PmPDs can be easily separated from the solution.
 | ||
| Fig. 9 Recycling of 1:1Fe3O4–NH2@PmPDs for Cr(VI) removal using 0.01 mol L−1 NaOH. | ||
4. Conclusions
In this study, Fe3O4–NH2@PmPDs were successfully synthesized with a uniform well-defined core–shell structure for the removal of Cr(VI) from the Cr-contaminated solutions. The as-prepared Fe3O4–NH2@PmPDs enable a rapid magnetic separation and exhibit abundant nitrogen-containing functional groups towards Cr(VI) adsorption/reduction. The adsorption capacity (508 mg g−1) of Fe3O4–NH2@PmPDs at 298 K suggests an efficient Cr(VI) removal than those of other magnetic adsorbents, and the thermodynamic experiments reveal that the adsorption process is spontaneous and endothermic. The whole adsorption process follows the intraparticle diffusion model, which can be divided into four reaction stages. The adsorption of Cr(VI) on the surface active sites of Fe3O4–NH2@PmPDs and the reduction of Cr(VI) to Cr(III) via benzenoid amine are suitable to explain the removal of Cr(VI) by Fe3O4–NH2@PmPDs. Recycle experiments suggest that the adsorption capacity of Fe3O4–NH2@PmPDs still maintains a high level for Cr(VI) removal. Therefore, Fe3O4–NH2@PmPDs could be a promising potential candidate for the treatment of Cr(VI)-contaminated water.Conflict of interest
The authors declare no competing financial interest.Acknowledgements
The financial support received from the National Natural Science Foundation of China (U1607102, 21377132, 21577032), the Priority Academic Program Development of Jiangsu Higher Education Institutions, and the Collaborative Innovation Center of Radiation Medicine of Jiangsu Higher Education Institutions is acknowledged.References
- G. Bayramoğlu and M. Y. Arica, Chem. Eng. J., 2008, 139, 20–28 CrossRef.
- W. T. Yu, L. Y. Zhang, H. Y. Wang and L. Y. Chai, J. Hazard. Mater., 2013, 260, 789–795 CrossRef CAS PubMed.
- J. Hu, C. L. Chen, X. X. Zhu and X. K. Wang, J. Hazard. Mater., 2009, 162, 1542–1550 CrossRef CAS PubMed.
- Z. P. Chen, Y. R. Li, M. Guo, F. Y. Xu, P. Wang, Y. Du and P. Na, J. Hazard. Mater., 2016, 310, 188–198 CrossRef CAS PubMed.
- Y. Gao, C. Chen, X. Tan, H. Xu and K. Zhu, J. Colloid Interface Sci., 2016, 476, 62–70 CrossRef CAS PubMed.
- N. Shevchenko, V. Zaitsev and A. Walcarius, Environ. Sci. Technol., 2008, 42, 6922–6928 CrossRef CAS PubMed.
- X. Ren, C. Chen, M. Nagatsu and X. Wang, Chem. Eng. J., 2011, 170, 395–410 CrossRef CAS.
- T. Wen, Q. Fan, X. Tan, Y. Chen, C. Chen, A. Xu and X. Wang, Polym. Chem., 2016, 7, 785–794 RSC.
- M. Liu, T. Wen, X. Wu, C. Chen, J. Hu, J. Li and X. Wang, Dalton Trans., 2013, 42, 14710–14717 RSC.
- V. Gomez and M. P. Callao, Trends Anal. Chem., 2006, 25, 1006–1015 CrossRef CAS.
- X. Huang, X. Hou, F. Song, J. Zhao and L. Zhang, Environ. Sci. Technol., 2016, 50, 1964–1972 CrossRef CAS PubMed.
- B. Sarkar, R. Naidu, G. S. Krishnamurti and M. Megharaj, Environ. Sci. Technol., 2013, 47, 13629–13636 CrossRef CAS PubMed.
- S. Fan, Y. Wang, Y. Li, J. Tang, Z. Wang, J. Tang, X. Li and K. Hu, RSC Adv., 2017, 7, 7576–7590 RSC.
- Z.-H. Diao, X.-R. Xu, H. Chen, D. Jiang, Y.-X. Yang, L.-J. Kong, Y.-X. Sun, Y.-X. Hu, Q.-W. Hao and L. Liu, J. Hazard. Mater., 2016, 316, 186–193 CrossRef CAS PubMed.
- B. Geng, Z. Jin, T. Li and X. Qi, Chemosphere, 2009, 75, 825–830 CrossRef CAS PubMed.
- T. Wen, Q. Fan, X. Tan, Y. Chen, C. Chen, A. Xu and X. Wang, Polym. Chem., 2016, 7, 785–794 RSC.
- K. Zhu, Y. Gao, X. Tan and C. Chen, ACS Sustainable Chem. Eng., 2016, 4, 4361–4369 CrossRef CAS.
- E. A. Zaragoza-Contreras, C. A. Hernandez-Escobar and A. Vega-Rios, Colloid Polym. Sci., 2015, 293, 2635–2645 CAS.
- G. Liu, Q. Deng, H. Wang, S. Kang, Y. Yang, D. H. L. Ng, W. Cai and G. Wang, Chem.–Eur. J., 2012, 1(1), 13418–13426 CrossRef PubMed.
- T. Wang, L. Zhang, C. Li, W. Yang, T. Song, C. Tang, Y. Meng, S. Dai, H. Wang, L. Chai and J. Luo, Environ. Sci. Technol., 2015, 49, 5654–5662 CrossRef CAS PubMed.
- M. Srivastava, J. Singh, M. Yashpal, D. K. Gupta, R. K. Mishra, S. Tripathi and A. K. Ojha, Carbohydr. Polym., 2012, 89, 821–829 CrossRef CAS PubMed.
- M. Srivastava, A. K. Ojha, S. Chaubey, J. Singh, P. K. Sharma and A. C. Pandey, J. Alloys Compd., 2010, 500, 206–210 CrossRef CAS.
- F. Zhang, J. Jin, X. Zhong, S. Li, J. Niu, R. Li and J. Ma, Green Chem., 2011, 13, 1238–1243 RSC.
- H. Gu, S. B. Rapole, J. Sharma, Y. Huang, D. Cao, H. A. Colorado, Z. Luo, N. Haldolaarachchige, D. P. Young, B. Walters, S. Wei and Z. Guo, RSC Adv., 2012, 2, 11007–11018 RSC.
- S. Thatai, P. Khurana, J. Boken, S. Prasad and D. Kumar, Microchem. J., 2014, 116, 62–76 CrossRef CAS.
- A. N. Baghani, A. H. Mahvi, M. Gholami, N. Rastkari and M. Delikhoon, J. Environ. Health Sci. Eng., 2016, 14, 11 CrossRef PubMed.
- X.-L. Wu, Y. Shi, S. Zhong, H. Lin and J.-R. Chen, Appl. Surf. Sci., 2016, 378, 80–86 CrossRef CAS.
- J. Zhang, S. Zhai, S. Li, Z. Xiao, Y. Song, Q. An and G. Tian, Chem.–Eur. J., 2013, 215–216, 461–471 CAS.
- S. Venkateswarlu and M. Yoon, ACS Appl. Mater. Interfaces, 2015, 7, 25362–25372 CAS.
- Y.-M. Hao, M. Chen and Z.-B. Hu, J. Hazard. Mater., 2010, 184, 392–399 CrossRef CAS PubMed.
- L. Wang, J. Bao, L. Wang, F. Zhang and Y. Li, Chem.–Eur. J., 2006, 12, 6341–6347 CrossRef CAS PubMed.
- K. Li, D. Guo, F. Lin, Y. Wei, W. Liu and Y. Kong, Electrochim. Acta, 2015, 166, 47–53 CrossRef CAS.
- H. Wang, X. Zhao, X. Han, Z. Tang, S. Liu, W. Guo, C. Deng, Q. Guo, H. Wang, F. Wu, X. Meng and J. P. Giesy, Sci. Total Environ., 2017, 586, 817–826 CrossRef CAS PubMed.
- R. Zhang, H. Ma and B. Wang, Ind. Eng. Chem. Res., 2010, 49, 9998–10004 CrossRef CAS.
- D. Setyono and S. Valiyaveetti, J. Hazard. Mater., 2015, 302, 120–128 CrossRef PubMed.
- X. An, D. Cheng, L. Dai, B. Wang, H. J. Ocampo, J. Nasrallah, X. Jia, J. Zou, Y. Long and Y. Ni, Appl. Catal., B, 2017, 206, 53–64 CrossRef CAS.
- R. Hatel, M. Goumri, B. Ratier and M. Baitoul, Mater. Chem. Phys., 2017, 193, 156–163 CrossRef CAS.
- L. Zhang, T. Wang, H. Wang, Y. Meng, W. Yu and L. Chai, Chem. Commun., 2013, 49, 9974–9976 RSC.
- S. Kumar, A. K. Ojha and R. K. Singh, J. Raman Spectrosc., 2014, 45, 717–722 CrossRef CAS.
- S. Yu, X. Wang, Z. Chen, X. Tan, H. Wang, J. Hu, A. Alsaedi, N. S. Alharbi, W. Guo and X. Wang, Chem. Eng. J., 2016, 302, 77–85 CrossRef CAS.
- C. Ding, W. Cheng, X. Wang, Z. Wu, Y. Sun, C. Chen, X. Wang and S. Yu, J. Hazard. Mater., 2016, 313, 253–261 CrossRef CAS PubMed.
- M. Bhaumik, A. Maity, V. V. Srinivasu and M. S. Onyango, J. Hazard. Mater., 2011, 190, 381–390 CrossRef CAS PubMed.
- T. Wen, X. Wu, X. Tan, X. Wang and A. Xu, ACS Appl. Mater. Interfaces, 2013, 5, 3304–3311 CAS.
- E. S. Dragan, D. F. A. Loghin and A. I. Cocarta, ACS Appl. Mater. Interfaces, 2014, 6, 16577–16592 CAS.
- S. Rajput, C. U. Pittman Jr and D. Mohan, J. Colloid Interface Sci., 2016, 468, 334–346 CrossRef CAS PubMed.
- Y. Wang, Y. Zhang, C. Hou and M. Liu, J. Taiwan Inst. Chem. Eng., 2016, 61, 292–298 CrossRef CAS.
- X. B. Fang, Z. Q. Fang, P. K. E. Tsang, W. Cheng, X. M. Yan and L. C. Zheng, Appl. Surf. Sci., 2014, 314, 655–662 CrossRef CAS.
- Y. Gao, C. Chen, H. Chen, R. Zhang and X. Wang, Dalton Trans., 2015, 44, 8917–8925 RSC.
- W. Song, X. Wang, Q. Wang, D. Shao and X. Wang, Phys. Chem. Chem. Phys., 2015, 17, 398–406 RSC.
- S. Deng and Y. P. Ting, Environ. Sci. Technol., 2005, 39, 8490–8496 CrossRef CAS PubMed.
Footnotes |
| † Electronic supplementary information (ESI) available: The chemical structure of PmPD and the mass ratio for Cr(VI) and the N-based group are presented. See DOI: 10.1039/c7ra05314b |
| ‡ Hongshan Zhu and Jin Wu contributed equally to this paper. |
| This journal is © The Royal Society of Chemistry 2017 |