 Open Access Article
Creative Commons Attribution 3.0 Unported Licence
Curcumin-like compounds designed to modify amyloid beta peptide aggregation patterns†
Antonella Battisti abc,
Antonio Palumbo Piccionello
 *d,
Antonella Sgarbossa
 *ac,
Silvia Vilasi
 b,
Caterina Ricci
 e,
Francesco Ghetti
 ac,
Francesco Spinozzi
 e,
Antonella Marino Gammazza
 f,
Valentina Giacaloned,
Annamaria Martoranad,
Antonino Lauria
 d,
Claudio Ferrerog,
Donatella Bulone
 b,
Maria Rosalia Mangione
 b,
Pier Luigi San Biagio
 b and
Maria Grazia Ortore
 *e
*e
aNEST, Scuola Normale Superiore and NANO-CNR, Pisa, Italy. E-mail: antonella.sgarbossa@nano.cnr.it
bIBF, CNR, Palermo, Italy
cIBF, CNR, Pisa, Italy
dSTEBICEF, Universitá di Palermo, Palermo, Italy. E-mail: antonio.palumbopiccionello@unipa.it
eDiSVA, Universitá Politecnica delle Marche, Ancona, Italy. E-mail: m.g.ortore@univpm.it
fBiomedicina Sperimentale e Neuroscienze Cliniche, Universitá di Palermo, Palermo, Italy
gEuropean Synchrotron Radiation Facility, Grenoble, France
First published on 21st June 2017
Abstract
Curcumin is a natural polyphenol able to bind the amyloid beta peptide, which is related to Alzheimer’s disease, and modify its self-assembly pathway. This paper focuses on a multi-disciplinary study that starts from the design of curcumin-like compounds with the key chemical features required for inhibiting amyloid beta aggregation, and reports the effects of these compounds on the in vitro aggregation of amyloid beta peptides. Chemoinformatic screening was performed through the calculation of molecular descriptors that were able to highlight the drug-like profile, followed by docking studies with an amyloid beta peptide fibril. The computational design underlined two different scaffolds that were easily synthesized in good yields. In vitro experiments, ranging from fluorescence spectroscopy and confocal microscopy up to small angle X-ray scattering, provided evidence that the synthesized compounds are able to modify the aggregation pattern of amyloid beta peptides both in the secondary structures, and in terms of the overall structure dimensions. The cytotoxic potential of the synthesized compounds was finally tested in vitro with a model neuronal cell line (LAN5). The overall view of this study suggests new concepts and potential difficulties in the design of novel drugs against diverse amyloidoses, including Alzheimer’s disease.
1 Introduction
Alzheimer’s Disease (AD) represents a fundamental challenge for public health in the 21st century.1 Current AD therapies focus largely on symptomatic aspects of the clinical pathology, but they still have yet to demonstrate any major impact on the progression of the disease.2 The amyloid β (Aβ) peptide is considered one of the most important etiological agents and pathogenic hallmarks of AD, due to its tendency to aggregate through β-sheet motifs, from small oligomers to fibrils and finally to amyloid plaques,3 causing loss of neuronal functions.4 However, oligomeric species formed in the initial state of the aggregation process seem to be the essential cause of the toxic effects toward neurons.5,6 Therefore, one strategy to fight AD could be the development of neuro-protective agents that are able to reduce the aggregation process and to induce the formation of non-toxic oligomers.7 In this field, many natural products have been considered, in particular polyphenols8 such as quercetin,9 ferulic acid,10,11 and curcumin.12Curcumin is a widely studied chemical scaffold for the treatment of AD,13 however its poor metabolic stability and blood–brain barrier (BBB) penetration do not grant a real therapeutic perspective,14 encouraging the research of suitable delivery systems for its effective therapeutic use.15 Therefore it is necessary to synthesize compounds with the same ability shown by curcumin to bind the Aβ peptide, without its stability and bio-availability issues, to allow real applicability for the treatment of AD. In this context, the replacement of the 1,3-dicarbonilic portion with heterocyclic isosteres is a promising strategy, which has already enabled the identification of isoxazole,16 pyrazole, pyrimidine,17 and pyridine13 derivatives capable of binding Aβ in the same manner as curcumin. Accordingly, on the basis of an a priori chemoinformatic evaluation, we synthesized systems carrying other heterocyclic nuclei, in particular azoles and azines, which can provide the completion of the chemical space and possibly lead to the identification of promising novel drugs.
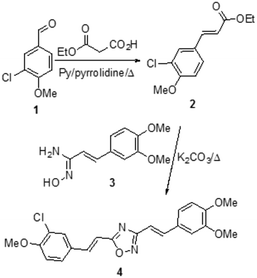
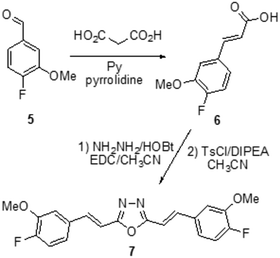
In this study, two new compounds were designed and synthesized (Schemes 1 and 2) and their inhibitor effect on Aβ aggregation was tested by means of biophysical experimental techniques. Aβ aggregation kinetics were monitored using spectrofluorometric measurements, small angle X-ray scattering, and confocal microscopy. All experiments proved that both of the newly synthesized compounds are able to interfere with the protein by selecting different aggregation pathways, but with different results in the two cases. Finally, the cytotoxic potential of these compounds was tested in vitro with a model neuronal cell line.
2 Materials and methods
2.1 In silico studies
The challenge of the initial ligand sampling step is to generate at least one reasonably docked pose for the ligand (independent from the score it receives), because without a plausible initial guess for the ligand pose, any attempt to predict reorganization of the protein structure is unlikely to succeed in the context of a limited allotment of CPU time. The main goal of the protein sampling step is to predict the low energy receptor conformation for a correct ligand pose, starting from the plausible initial guess previously generated. The ligand resampling step is focused on the generation of low energy conformations when presented with the correct receptor conformation. The composite score used for final ranking of compounds is given by GlideScore + 0.05 PrimeEnergy. This definition implies that in most cases the GlideScore term is dominant, however the small contribution of the PrimeEnergy score is sufficient to eliminate predicted protein structures for which the energy gap is large enough to overcome the energy noise introduced by minor steric clashes. In fact, if the gap in the composite scores between top ranked structures is below 0.2, indicating isoenergetic solutions, the entire IFD protocol is repeated for the top ranked solutions using the results from the first IFD as input for a further cycle. Before the docking run, each complex was prepared by adding hydrogens and charges, in particular setting the ionization state of charged residues to physiological conditions. The induced fit parameters were set as follows. During the initial Glide docking a van der Waals radius scaling of 0.50 Å was kept for both ligand and receptor atoms, and the top 20 poses were recorded. For the Prime refinement step, all of the residues within 5 Å of the active site were kept free to move, and the side chains were further minimized. Finally, in the Glide redocking step, all the conformations within 30 kcal mol−1 of the best one were accepted. The accuracy level was set to the extra-precision mode (XP) available in Glide, combining a powerful sampling protocol with the use of a custom scoring function to identify ligand poses expected to have unfavourable energies. This is designed as a refinement tool for use only on good ligand poses.
2.2 Synthesis
The melting points were determined on a hot-stage device and are uncorrected. 1H NMR and 13C NMR spectra were recorded at the frequencies indicated in the next sections, using the residual solvent peak as a reference. Chromatography was performed using silica gel (0.040–0.063 mm) and mixtures of ethyl acetate and petroleum ether (fraction boiling in the range of 40–60 °C) in various v/v ratios. All solvents and reagents were used as received, unless otherwise stated. The compounds 626 and E-3,4-dimethoxycinnamonitrile27 were obtained as previously reported.![[double bond, length as m-dash]](https://www.rsc.org/images/entities/char_e001.gif) CH– trans), 6.96–7.07 (m, 3H, overlapped), 7.15 (d, J = 1 Hz, 1H, Ar), 9.68 (s, 1H, NOH).
CH– trans), 6.96–7.07 (m, 3H, overlapped), 7.15 (d, J = 1 Hz, 1H, Ar), 9.68 (s, 1H, NOH).![[double bond, length as m-dash]](https://www.rsc.org/images/entities/char_e001.gif) CH– trans), 6.98 (d, 1H, J = 16 Hz, –CH
CH– trans), 6.98 (d, 1H, J = 16 Hz, –CH![[double bond, length as m-dash]](https://www.rsc.org/images/entities/char_e001.gif) CH– trans), 6.90–7.03 (m, 2H, Ar), 7.18 (d, 2H, J = 7.8 Hz, Ar), 7.50 (dd, J1 = 8.8 Hz, J2 = 2 Hz, 1H, Ar), 7.70 (d, 1H, J = 16.0 Hz, –CH
CH– trans), 6.90–7.03 (m, 2H, Ar), 7.18 (d, 2H, J = 7.8 Hz, Ar), 7.50 (dd, J1 = 8.8 Hz, J2 = 2 Hz, 1H, Ar), 7.70 (d, 1H, J = 16.0 Hz, –CH![[double bond, length as m-dash]](https://www.rsc.org/images/entities/char_e001.gif) CH– trans), 7.77 (d, 1H, J = 16.2 Hz, –CH
CH– trans), 7.77 (d, 1H, J = 16.2 Hz, –CH![[double bond, length as m-dash]](https://www.rsc.org/images/entities/char_e001.gif) CH– trans). 13C NMR (75 MHz, CDCl3) δ: 55.9, 56.0, 56.3, 109.1, 109.2, 110.8, 111.1, 112.1, 121.6, 123.4, 128.0, 128.1, 128.4, 129.3, 138.8, 140.9, 149.2, 150.4, 156.7, 168.3, 174.4.
CH– trans). 13C NMR (75 MHz, CDCl3) δ: 55.9, 56.0, 56.3, 109.1, 109.2, 110.8, 111.1, 112.1, 121.6, 123.4, 128.0, 128.1, 128.4, 129.3, 138.8, 140.9, 149.2, 150.4, 156.7, 168.3, 174.4.![[double bond, length as m-dash]](https://www.rsc.org/images/entities/char_e001.gif) CH– trans), 7.12–7.20 (m, 6H, Ar), 7.55 (d, 2H, J = 16.5 Hz, –CH
CH– trans), 7.12–7.20 (m, 6H, Ar), 7.55 (d, 2H, J = 16.5 Hz, –CH![[double bond, length as m-dash]](https://www.rsc.org/images/entities/char_e001.gif) CH– trans). 13C NMR (75 MHz, CDCl3) δ: 56.3, 109.7, 111.6, 116.6 (d, J = 20 Hz), 121.1 (d, J = 7.1 Hz), 131.4 (d, J = 3.9 Hz), 138.1, 148.2 (d, J = 11.2 Hz), 153.6 (d, J = 250.1 Hz), 163.6.
CH– trans). 13C NMR (75 MHz, CDCl3) δ: 56.3, 109.7, 111.6, 116.6 (d, J = 20 Hz), 121.1 (d, J = 7.1 Hz), 131.4 (d, J = 3.9 Hz), 138.1, 148.2 (d, J = 11.2 Hz), 153.6 (d, J = 250.1 Hz), 163.6.2.3 Sample preparation: Aβ and compounds
The lyophilized synthetic peptide Aβ1–40 (Anaspec) was solubilized in NaOH 5 mM (Sigma-Aldrich), pH 10, and sonicated and lyophilized according to the Fezoui et al. protocol.28 The lyophilized peptide was then dissolved in PBS (pH 7.4) and filtered through two filters in series with diameters of 0.20 μm (Millex-Lg) and 0.02 μm (Whatman), in order to eliminate large aggregates. The sample preparation was aseptically operated in a cold room at 4 °C. The Aβ1–40 concentration was determined using tyrosine absorption at 276 nm using an extinction coefficient of 1390 cm−1 M−1. Compounds 7 and 4 were dissolved in DMSO. Absorption and fluorescence spectra for compounds 7 and 4 were registered at different times in order to assess their stability and the absence of fluorescence interference for the following spectroscopic measurements.The final samples containing Aβ1–40 and curcumin compounds were obtained by appropriate aseptic mixing of the solutions and were used immediately for the aggregation kinetics experiment.
2.4 Small angle X-ray scattering
Small Angle X-ray Scattering (SAXS) experiments were carried out at the BM29 beamline in ESRF – the European Synchrotron Radiation Facility in Grenoble, France.31 Protein samples were carried in ice, and freshly prepared with the desired amount of curcumin-like compound, as described in Section 2.3. Aβ1–40 concentration was spectrophotometrically checked to be 270 μM. Each sample was measured at 37 °C. SAXS patterns were recorded using a bidimensional Pilatus 1 M detector. The sample cell used is a 1.0 mm diameter quartz capillary, with a few tens of microns wall thickness. On BM29, data collection on protein solutions is possible in a wide temperature range via an automated sample changer. After each measurement protein samples are stored at 37 °C, without stirring. To minimize the dose and the consequent radiation damage, protein solutions were only irradiated during data collection using a fast experimental shutter located 4 m upstream of the sample, thus controlling the acquisition time. The transmitted intensity is monitored with a diode integrated in the beamstop and the intensity measured during data acquisition is used for normalization. The modulus Q of the scattering vector Q is defined as Q = 4π![[thin space (1/6-em)]](https://www.rsc.org/images/entities/char_2009.gif) sin(2Θ)/λ, where 2Θ is the scattering angle and λ = 0.8 Å, the X-ray wavelength. Since the sample–detector distance was fixed at 2.867 m, the Q values ranged from 0.01 to 0.45 Å−1. SAXS macroscopic differential scattering cross sections dΣ/dΩ(Q) (briefly referred to as scattering intensities) were obtained on an absolute scale (cm−1) by calibrating via a water sample, subtracting the proper buffer contribution for each investigated condition, and correcting for the protein volume fraction, as previously described.32 Each measurement lasted 1 s, followed by a dead time of 6 s in order to avoid radiation damage, and was repeated at least 10 times. The averaged SAXS patterns were analysed as reported in Section 3.
sin(2Θ)/λ, where 2Θ is the scattering angle and λ = 0.8 Å, the X-ray wavelength. Since the sample–detector distance was fixed at 2.867 m, the Q values ranged from 0.01 to 0.45 Å−1. SAXS macroscopic differential scattering cross sections dΣ/dΩ(Q) (briefly referred to as scattering intensities) were obtained on an absolute scale (cm−1) by calibrating via a water sample, subtracting the proper buffer contribution for each investigated condition, and correcting for the protein volume fraction, as previously described.32 Each measurement lasted 1 s, followed by a dead time of 6 s in order to avoid radiation damage, and was repeated at least 10 times. The averaged SAXS patterns were analysed as reported in Section 3.
2.5 Confocal microscopy
Images of Aβ1–40 fibril bundles, and compound 4-Aβ1–40 and compound 7-Aβ1–40 complexes stained with ThT, were obtained using a Leica TCS SP5 inverted laser scanning confocal microscope (Leica Microsystems AG, Wetzlar, Germany) interfaced with an Ar laser for excitation at 458 nm and adopting a 63 × 1.4 numerical aperture oil immersion objective (Leica Microsystems) in oil immersions. Fibril bundles, and compound 4-Aβ1–40 and compound 7-Aβ1–40 complexes were left to settle for 20 min from the initial solution in 3.5 cm glass bottomed Petri dishes (WillCo-Dish, WillCo Wells, Amsterdam, the Netherlands) and then imaged therein. The excitation power was 50–200 μW at the objective, the line scanning speed was set to 400 Hz, and the wavelength collection range was between 470–515 nm. Transmission images were obtained in differential image contrast mode (Nomarski image) using the same laser source.2.6 Biological evaluation
The cytotoxicity of the compounds and their effect on Aβ1–40 aggregation in vitro, were studied on the LAN5 neuroblastoma cell line through an MTT assay, by adapting a previously reported procedure.33 Cells were treated with both compounds 4 and 7 at 1 and 5 μM doses, respectively. Taking into account the cytotoxicity potential of Aβ1–40 in aggregated species, LAN5 cells were treated using aliquots taken during Aβ1–40 aggregation kinetics at 50 μM in the absence and presence of the oxadiazoles 4 and 7, each one at 5 μM. Aβ1–40 aliquots were sampled after different incubation times. The experiments were carried out under the same conditions as the Rayleigh experiment, but using an Aβ1–40 concentration of 50 μM.The Aβ amyloid aggregation kinetics were followed at a controlled temperature (37 °C) and under stirring (200 rpm) at 50 μM. The samples for cytotoxicity assays were collected at the beginning, after 30 minutes, and after two hours of kinetics experiments, and were diluted in a medium at 5 μM of Aβ. To assess cell viability after 24 h of treatment, the MTT (3-(4,5-dimethylthiazol-2-yl-2,5-diphenyl tetrazolium bromide)) assay (Sigma-Aldrich) was performed as previously reported.34
3 Results and discussion
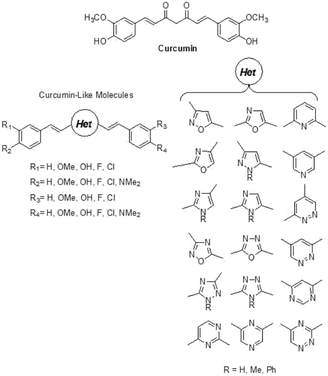
The in silico study was performed by replacing the central di-ketonic core of the lead-compound curcumin with various aromatic portions, in order to discover novel scaffolds able to target Aβ oligomers. In particular, the database of compounds was built with structures endowed with a more stable and planar heterocycle. Thus, a large library with novel curcumin-like structured compounds was generated (see Fig. 1). The virtual screening was accomplished using the software suite Maestro Schrödinger. In particular, the first approach was focused on the calculation of molecular descriptors able to highlight the drug-like profile of the newly designed molecules.20 The selection was based on Lipinski’s rules (rule of five) and by taking into account the molecular descriptors such as log![[thin space (1/6-em)]](https://www.rsc.org/images/entities/char_2009.gif) BB, which allows the evaluation of BBB permeation ability. Actually, log
BB, which allows the evaluation of BBB permeation ability. Actually, log![[thin space (1/6-em)]](https://www.rsc.org/images/entities/char_2009.gif) BB is defined as the calculated ratio of the concentration of the compound in the brain to the concentration of the compound in the blood at steady state (log([brain]/[blood])) and the cut-off we chose for the selection of candidate molecules was set at the optimal value of log
BB is defined as the calculated ratio of the concentration of the compound in the brain to the concentration of the compound in the blood at steady state (log([brain]/[blood])) and the cut-off we chose for the selection of candidate molecules was set at the optimal value of log![[thin space (1/6-em)]](https://www.rsc.org/images/entities/char_2009.gif) BB > −0.3.36 From this screening, the list of candidates was reduced to about 700 compounds showing the required features. These compounds were used for the following step of molecular docking with the biological target, a pentamer of Aβ (PDB entry: 2BEG).18 The analysis of molecular docking poses revealed the preference of curcumin to interact with the lateral oligomer region, near the 17–21 amino acid residues (see Fig. 2), as was previously experimentally observed for curcumin as well as for other aggregation inhibitors.37
BB > −0.3.36 From this screening, the list of candidates was reduced to about 700 compounds showing the required features. These compounds were used for the following step of molecular docking with the biological target, a pentamer of Aβ (PDB entry: 2BEG).18 The analysis of molecular docking poses revealed the preference of curcumin to interact with the lateral oligomer region, near the 17–21 amino acid residues (see Fig. 2), as was previously experimentally observed for curcumin as well as for other aggregation inhibitors.37
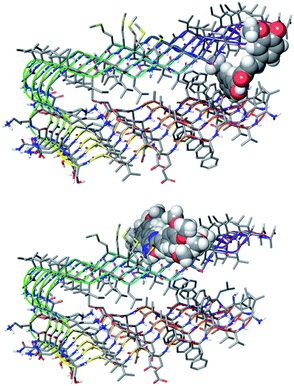 | ||
| Fig. 2 Docking poses for curcumin (top) and for selected compounds (bottom) binding at the saddle near Met35. | ||
From the restricted list, 50 compounds showed a docking score higher than curcumin. In detail, curcumin and curcumin-like compounds showed two different binding sites, again the 17–21 region and the saddle near methionine 35, Met35 (Fig. 2). The latter was of particular interest, considering the role of Met35 in modulating Aβ aggregation38 and the supposed role of this region as a secondary binding site for curcumin.39 In general, we considered this binding site of potential interest to avoid the protein–protein interactions in this zone that are responsible for the hierarchical assembly of amyloid fibers.40 However, hindering the 17–21 region could only reduce fiber elongation along the major axis. We consequently focused our attention on six compounds binding the Met35 region with higher scores (see Fig. S1 in the ESI†). By further evaluating the synthetic feasibility and preliminary attempted synthesis, the focus was restricted to only two compounds. These compounds are two different oxadiazole regio-isomers, two heterocyclic nuclei widely studied for AD treatment.33,41 Oxazole derivatives were not considered, due to unproductive preliminary synthetic attempts. In particular, following Scheme 1, the 1,2,4-oxadiazole derivative 4, was obtained by adopting the conventional amidoxime route,42 starting from the ester 2 and amidoxime 3. In turn, 2 was obtained through classical Knoevenagel condensation27 employing the commercial aldehyde 1. The 1,3,4-oxadiazole regio-isomer 7, from Scheme 2, was obtained from the one-pot construction of a diacylhydrazine intermediate, followed by cyclization and starting from the cinnamic acid analogue 6.43 In turn, 6 was again obtained through a classical Knoevenagel condensation employing the commercial aldehyde 5.26 All compounds were regioselectively obtained in E geometry in good overall yields. In order to assess whether compound 4 and compound 7 were able to directly interact with Aβ1–40 and to influence its aggregation process, we monitored the self-assembly kinetics in the presence and in the absence of either compound.
The aggregation process was firstly monitored by following the increase in the Rayleigh scattering peak for samples incubated under amyloid protocol conditions. The excitation and the emission monochromators were set at 405 nm and light diffusion was measured at 90°.29,30 Indeed, since the light scattering intensity is proportional to the size of all of the species in solution, Rayleigh scattering is a suitable tool to study the time evolution of protein assemblies. Fig. 3 shows the time course of the Rayleigh peak intensity during the aggregation kinetics of 75 μM Aβ1–40 incubated at 45 °C, alone or in the presence of either 7.5 μM of compound 4 or compound 7. The Aβ1–40 peptide aggregation kinetics follow a typical nucleation–polymerization process, described by a sigmoidal profile (see triangular symbols in Fig. 3). In the first phase, called the lag-phase, initial aggregation nuclei form and a very low value for the Rayleigh light intensity is detected. Afterwards, other molecules bind to the initial nuclei and a drastic exponential elongation phase follows, indicating a rapid increase of the fibril concentration.44 The plateau corresponds to the completion of the aggregation process, and its limit value is related to the properties of the aggregates formed at the end of the process. In the presence of compound 4 (see blue symbols in Fig. 3), no significant change of the light scattering intensity can be observed for the sample up to 3 hours from the beginning of the process, suggesting that the aggregation is inhibited by the compound, even if the formation of Low Molecular Weight Oligomers (LMWO) cannot be excluded. The effect is different when the sample is incubated in the presence of compound 7 (see green symbols in Fig. 3). In this case the aggregation inhibition, as confirmed by Rayleigh scattering, is not so strong. However, the assembly rate and the final amount of aggregates are significantly reduced. In addition, no lag-phase can be observed, thus suggesting that in the presence of compound 7 the aggregation route of Aβ1–40 is different from the one in the presence of compound 4. Actually, even the value of light scattering at time 0 is different in the presence of compound 7, suggesting that the compound produces its effect immediately after mixing.
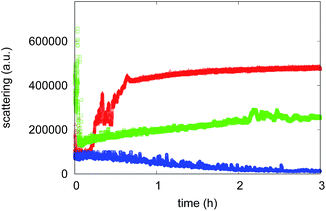 | ||
| Fig. 3 Aggregation kinetics obtained by Rayleigh scattering of 75 μM Aβ1–40 alone (red) and in the presence of 7.5 μM of compound 4 (blue) or compound 7 (green). | ||
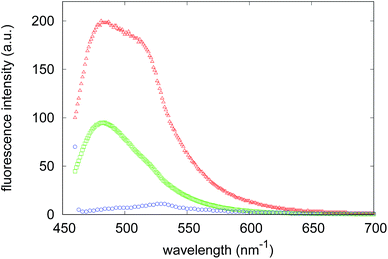
Light scattering, together with X-ray scattering, has the important advantage of monitoring the aggregation process in the absence of fluorescent probes and therefore avoiding the typical pitfalls that may affect the validity of tests on anti-aggregation agents.45 In particular, the strong absorptive and fluorescent properties of some exogenous compounds, like curcumin, were found to bias the fluorescence of ThT, one of the most used dyes for following fibrillogenesis kinetics.46 However, since ThT is a fluorescent dye widely used to detect the specific formation of the linear array of β-strand aggregates in amyloid fibrils,47,48 it was used, only at the end of the aggregation process, to verify the presence of on-pathway amyloid species in samples incubated with the two compounds. Therefore, we registered the fluorescence spectrum of the ThT bound to Aβ1–40 (Fig. 4) at the end of the fibrillogenesis kinetics experiment in the absence of synthesized compounds, and then we observed the variations of this spectrum when the dye is added at the end of the aggregation process to the Aβ1–40 species formed in the presence of compound 4 or compound 7. A significant reduction in the ThT emission can be detected with species formed in the presence of compound 4, whereas a less marked reduction in the fluorescence maximum is registered in the presence of compound 7. The consistency of these results with the light scattering experiments corroborates the test’s reliability. Both of these experimental results indicate that while compound 4 is able to strongly inhibit the aggregation of Aβ1–40 peptides towards the formation of amyloid aggregates, compound 7 probably alters the aggregation pattern.
To investigate at a molecular level the effect of each compound on the aggregation kinetics of Aβ1–40, SAXS curves of 270 μM Aβ1–40 in the absence and in the presence of compound 4 or compound 7 (both in a 1![[thin space (1/6-em)]](https://www.rsc.org/images/entities/char_2009.gif) :
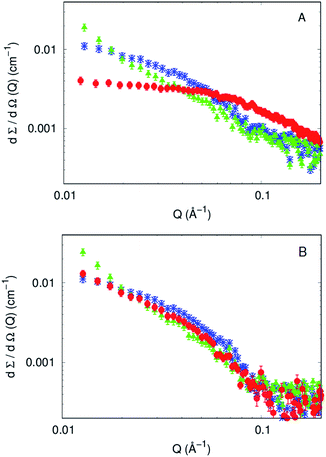
:![[thin space (1/6-em)]](https://www.rsc.org/images/entities/char_2009.gif) 1 molar ratio) were recorded immediately after their fresh preparation (time 0) and 100, 150 and 200 min after preparation. The experimental curves corresponding to fresh preparations of Aβ1–40 with and without the two compounds are shown in Fig. 5A. The differential scattering cross sections can be considered as different fingerprints of each sample. It can be noticed that the scattering intensity at Q ≃ 0 increases when compounds are present in the solution. Because at the same protein weight concentration values, the cross section is proportional to the molecular weight of the average particles in solution (see eqn (10) in ref. 49), it is clear that both the compounds induce an aggregation of the Aβ1–40 peptide. Also, the overall shape of the SAXS curve is different in the presence of the compounds and is even different between compounds 4 and 7.
1 molar ratio) were recorded immediately after their fresh preparation (time 0) and 100, 150 and 200 min after preparation. The experimental curves corresponding to fresh preparations of Aβ1–40 with and without the two compounds are shown in Fig. 5A. The differential scattering cross sections can be considered as different fingerprints of each sample. It can be noticed that the scattering intensity at Q ≃ 0 increases when compounds are present in the solution. Because at the same protein weight concentration values, the cross section is proportional to the molecular weight of the average particles in solution (see eqn (10) in ref. 49), it is clear that both the compounds induce an aggregation of the Aβ1–40 peptide. Also, the overall shape of the SAXS curve is different in the presence of the compounds and is even different between compounds 4 and 7.
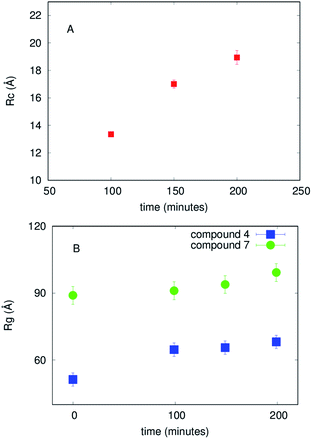
The SAXS curve of the freshly prepared Aβ1–40 sample (corresponding to time 0) was also fitted in the whole Q range by the worm-like form factor developed by Pedersen and Schurtenberger.50 This model is indeed suitable to describe the intrinsically disordered chain of monomeric proteins. To take into account the finite thickness of the chain and the presence of a hydration shell with a possibly higher scattering length density (SLD) with respect to that of bulk water, the worm-like form factor was multiplied by the form factor of a core–shell circular cross section, according to eqn (6) reported by Ortore et al.,51 keeping the thickness of the external hydration shell fixed at the standard value of 3 Å. Since the electron density and the dry volume of the Aβ1–40 monomer can be easily determined using amino acid literature data,52 the fitting parameters of the model reduce to the contour length L of the chain, the statistical Kuhn length b (which represents the separation between two adjacent rigid segments of the chain), the core radius Rw of the circular cross-section, and the relative mass density dw of the hydrating water. The fixed estimated value V1 = 5400 Å3 for the dry volume of the Aβ1–40 monomer implies the constraint V1 = πRw2L. The best fit curve is reported in Fig. S6A in the ESI† (continuous line among blue dots) and was obtained with b = 20 ± 5 Å, Rw = 4.1 ± 0.1 Å, and dw ≃ 1.05%, confirming that Aβ1–40 contains disordered single chains resulting from an ensemble of possible conformations. The overall shape of the SAXS curves of Aβ1–40 noticeably changes with increasing time after the sample preparation. These SAXS curves, when represented according to the cross-sectional Guinier plots ( vs. Q2), show a linear trend at low Q (see ESI,† Fig. S4). This feature is compatible with the form factor of rigid rod-like particles, implying the formation of elongated cylindrical structures and thus confirming the expected presence of protofibrils and fibrils in solution. Consequently, SAXS curves corresponding to in-solution Aβ1–40 during its aggregation were fitted in their low Q-range by adopting the Guinier approach for infinite rods,53
 | (1) |
On the other side, SAXS data of compounds 4 and 7, in a molar ratio 1![[thin space (1/6-em)]](https://www.rsc.org/images/entities/char_2009.gif) :
:![[thin space (1/6-em)]](https://www.rsc.org/images/entities/char_2009.gif) 1 with Aβ1–40 monomers, evidence a sudden modification and a different kinetic pattern of the peptide aggregation state. The final stage of the Aβ1–40 peptide aggregation in the presence and absence of the compounds shows noticeable differences, as shown in Fig. 5B. In more detail, while the SAXS curve of the peptide alone 100 min after preparation was best fitted according to the Guinier approach for long cylinders, representative of fibrillar species, this approximation failed at fitting the corresponding data in the presence of both compounds at any time. However, the standard Guinier approximation,
1 with Aβ1–40 monomers, evidence a sudden modification and a different kinetic pattern of the peptide aggregation state. The final stage of the Aβ1–40 peptide aggregation in the presence and absence of the compounds shows noticeable differences, as shown in Fig. 5B. In more detail, while the SAXS curve of the peptide alone 100 min after preparation was best fitted according to the Guinier approach for long cylinders, representative of fibrillar species, this approximation failed at fitting the corresponding data in the presence of both compounds at any time. However, the standard Guinier approximation,
 | (2) |
 vs. Q2, as reported in ESI,† Fig. S5. The best fit Guinier radii Rg are reported in Fig. 6; in the presence of both compounds we observe that the average dimensions of the particles in solution are increasing versus time.
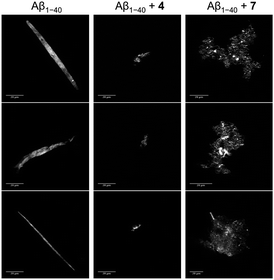
These model-free approaches enabled us to evaluate that both compounds 4 and 7 immediately modify the Aβ1–40 aggregation state and provided the average dimensions of the particles in solution in each specific case. However, model-free methods do not provide a complete description of the species present in solution. An analysis of the whole of the SAXS curves considering the presence of multiple species in solution (such as disordered chains and/or compact objects like cylinders and/or spheres) was inspired by microscope images that suggest a certain polymorphism (see in the following and Fig. 7). Hence further SAXS data analysis using GENFIT software54 was performed considering the simultaneous presence in solution of disordered chains and cylinders. The results are reported in the ESI,† in Fig. S6 and S7, and a description of the different species in solution is suggested. In fact, while in the final investigated time step of Aβ1–40 peptide aggregation the predominant object in solution resembles the cylindrical shape, confirming the fibrillar pattern, in the final step of aggregation in the presence of compounds the results are clearly different. Compound 4 determines the prevalent presence of disordered aggregates, with just a low percentage of cylinders. On the contrary, compound 7 decreases the development of cylindrical species, with respect to the case of just Aβ1–40 in solution, in favor of disordered species. These findings are in agreement with the other experimental techniques, but due to the several free parameters required by this analysis, can be considered affected by ambiguity without precise indications resulting from other in-solution techniques.
In order to qualitatively evaluate the morphology of the biggest species at the final stage of aggregation kinetics, confocal microscopy was performed on aliquots of the solutions used for the kinetics experiments. Samples were stained with ThT as described before (see Section 2.5), left to settle down in glass bottom dishes in order to allow the aggregates to precipitate, and were then imaged. Fig. 7 shows the images acquired at the final stage of incubation of Aβ1–40 with or without the curcumin derivatives. The untreated samples showed prevalently the presence of long fluorescent “sticks”; importantly, negligible background fluorescence was recorded indicating that these “sticks” account for the vast majority of ThT-positive Aβ1–40 structures in solution.55 The peptide sample treated with compound 4 does not reveal a massive presence of amyloid fibers or large conglomerations, whilst a prevalent formation of small amorphous aggregates is observed. Larger amorphous aggregates are instead detected in the presence of compound 7. These results further support the evidence of an effect induced by the compounds on the aggregation process of Aβ1–40.
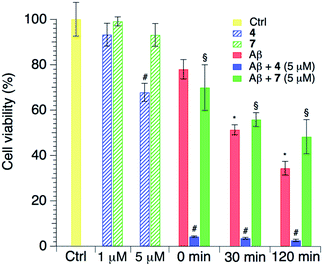
Finally, a biological analysis of the effects of the two curcumin-like compounds was carried out. Cells were treated with both compounds and this revealed a low cytotoxicity for both compounds 4 and 7 at 1 μM, particularly small for the latter. Conversely the addition of compounds at a higher concentration (5 μM) raised the potential cytotoxicity, and specifically compound 4 reduced the cell viability at 5 μM (Fig. 8). Considering the effect of the amyloid peptide, LAN5 cells were treated using aliquots taken during aggregation kinetics of the peptide alone or in the presence of the compounds in a 10![[thin space (1/6-em)]](https://www.rsc.org/images/entities/char_2009.gif) :
:![[thin space (1/6-em)]](https://www.rsc.org/images/entities/char_2009.gif) 1 peptide/compound ratio (Fig. 8). From previous studies performed under the same conditions, we consider in the sample the prevalence of oligomeric species.56 As expected, Aβ increases its toxicity along its aggregation kinetics due to the formation of toxic oligomeric species. Interestingly, compound 7 is able to counterbalance the formation of toxic oligomers, probably modifying the aggregation pathway toward less toxic aggregates, because after 2 hours it is able to slightly reduce the Aβ1–40-induced toxicity. On the other hand, co-administration of compound 4 clearly enhances Aβ1–40 toxicity. The latter effect could probably be explained by the higher presence of toxic oligomers in the medium, due to the inhibitory effect of compound 4 on the peptide aggregation into less noxious amyloid fibrils.
1 peptide/compound ratio (Fig. 8). From previous studies performed under the same conditions, we consider in the sample the prevalence of oligomeric species.56 As expected, Aβ increases its toxicity along its aggregation kinetics due to the formation of toxic oligomeric species. Interestingly, compound 7 is able to counterbalance the formation of toxic oligomers, probably modifying the aggregation pathway toward less toxic aggregates, because after 2 hours it is able to slightly reduce the Aβ1–40-induced toxicity. On the other hand, co-administration of compound 4 clearly enhances Aβ1–40 toxicity. The latter effect could probably be explained by the higher presence of toxic oligomers in the medium, due to the inhibitory effect of compound 4 on the peptide aggregation into less noxious amyloid fibrils.
Since the different behaviors of 4 and 7 were experimentally proven, a further analysis of the compounds’ binding modes was performed via Induced Fit Docking (IFD). IFD results showed that the binding of compounds 4 and 7 occurs in a similar way in terms of the involved amino acids and non-covalent interactions. According to IFD, both compounds bind Aβ in a saddle between Met35 and Val39, via hydrophobic interactions (see Fig. 9 and ESI†). The conformation of the investigated compounds into the binding site is almost similar in terms of molecule’s orientation and conformation around rotatable bonds. On the other side, a clear difference could be envisaged with compound 4 concerning Gly36–Gly37 conformation in comparison to the starting pentameric structure. In fact, in the presence of bound 4, the peptide backbone seems compressed, thus perturbing the β-sheet motif. In the presence of compound 7, the zigzag β-sheet motif is partially preserved (see ESI†). Hence, IFD results suggest that, while compound 7 could just interfere with Aβ aggregation avoiding packing of oligomers along fibril major axis, due to steric hindrance compound 4 could also interfere with the formation of the β-sheet motif, unfortunately thus allowing the formation of toxic off-pathway structures.
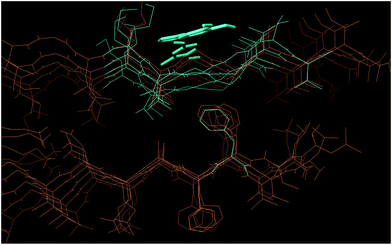 | ||
| Fig. 9 IFD pose for compound 4 bound to Aβ1–40 (turquoise) and unbound Aβ1–40 (orange) (PDB: 2BEG). In the presence of 4, Gly37–Gly38 are compressed by the ligand and lose the zigzag conformation. | ||
4 Conclusions
Our study integrates different research efforts focused on the development of small molecules that are able to interfere with uncontrolled aggregation of amyloid beta peptides, which is still considered to be one of the main causes of AD. The newly synthesized compounds were designed according to the same principles and provided equivalent promising impact on Aβ1–40 according to the scoring states resulting from docking. The in vitro studies on the real effects of these compounds presented interesting prospects and somehow unforeseen results.Firstly, both compounds 4 and 7 succeed in modifying Aβ1–40 fibrillogenesis. However, they give rise to aggregates with different morphologies as well as with different cytotoxic potential. Taking into account as a basic requirement the low cytotoxic impact of a drug, compound 7 could be deemed to be more promising than 4, which presents a high cytotoxic potential. Experimental biophysical results account for an immediate effect of compound 7 on Aβ1–40, and for a moderate peptide aggregation in the presence of this compound. On the other hand, compound 4 triggers less peptide aggregation, but featured by an higher cytotoxicity. These results suggest that compound 4 is able to link Aβ1–40 oligomeric toxic species and in some way to shelve their natural tendency to aggregate into amyloid fibrils. This hypothesis is in agreement with our biological analysis: if compound 4 inhibits the formation of large aggregates, then its addition to the amyloid peptide may induce a higher concentration of small toxic oligomers, thus producing a collapse in cell viability. The eventuality here described does not completely rule out the interest towards compound 4. In fact, it is possible to consider its use toward studies for the identification of toxic oligomers. Also, these findings suggest a more general message, i.e. that carefulness is always required when a new compound is under consideration for therapy.57 Secondly, this work suggests that in the development of novel drugs able to modify an intrinsically disordered protein aggregation pattern, such as in the case of the amyloid beta peptide, the analysis of their effects in vitro can provide unexpected results. In fact, even though both compounds present the same potential, they behave in quite dissimilar ways in the presence of the peptide. This result can be correlated with the simultaneous presence of several oligomeric species, whose toxicity is not actually assessed. Hence the design based on a single oligomeric species fails to indicate the most efficient drug, if it is not combined with other experiments in the presence of the peptide.
Author contribution
APP, SV, AB, AS, and MGO designed the research and the experiments. AL performed computational design and wrote the draft. VG and AM performed all the synthesis and wrote the draft. AMG performed biological evaluation and wrote the draft. MM contributed to sample preparation. DB contributed to the design of the fluorescence and microscopy experiments. AB, AS, and FG performed Rayleigh scattering, ThT fluorescence spectroscopy, and confocal microscopy experiments. CR, FS, and CF performed the SAXS experiments. CR and MGO analyzed the SAXS data. PLSB contributed in the supervision of research. APP, SV, AS, AB, CR, and MGO wrote the final manuscript. All of the authors discussed the results and revised the final manuscript.Funding
This work has been supported by Italian grant FIRB Future in Research RBFR12SIPT MIND: “Multidisciplinary Investigations for the development of Neuro-protective Drugs”.Acknowledgements
SAXS experiments were performed on beamline BM29 at the European Synchrotron Radiation Facility (ESRF), Grenoble, France. We are grateful to Petra Pernot at the ESRF for providing assistance in using the beamline. We thank Paolo Moretti for assistance in the SAXS experiments and Ranieri Bizzarri for stimulating discussion in designing the experiments.References
- A. Association, Alzheimer’s Dementia, 2016, 12, 459–509 CrossRef.
- A. Kumar and A. Singh Ekavali, Pharmacol. Rep., 2015, 67, 195–203 CrossRef CAS PubMed.
- I. W. Hamley, Chem. Rev., 2012, 112, 5147–5192 CrossRef CAS PubMed.
- J. Parodi, F. J. Sepúlveda, J. Roa, C. Opazo, N. C. Inestrosa and L. G. Aguayo, J. Biol. Chem., 2010, 285, 2506–2514 CrossRef CAS PubMed.
- D. M. Walsh, I. Klyubin, J. V. Fadeeva, W. K. Cullen, R. Anwyl, M. S. Wolfe, M. J. Rowan and D. J. Selkoe, Nature, 2002, 416, 483–484 CrossRef PubMed.
- M. Hoshi, M. Sato, S. Matsumoto, A. Noguchi, K. Yasutake, N. Yoshida and K. Sato, Proc. Natl. Acad. Sci. U. S. A., 2003, 100, 6370–6375 CrossRef CAS PubMed.
- Q. Wang, X. Yu, L. Li and J. Zheng, Curr. Pharm. Des., 2014, 20, 1223–1243 CrossRef PubMed.
- Y. Porat, A. Abramowitz and E. Gazit, Chem. Biol. Drug Des., 2006, 67, 27–37 CAS.
- K. Ono, Y. Yoshiike, A. Takashima, K. Hasegawa, H. Naiki and M. Yamada, J. Neurochem., 2003, 87, 172–181 CrossRef CAS PubMed.
- K. Ono, M. Hirohata and M. Yamada, Biochem. Biophys. Res. Commun., 2005, 336, 444–449 CrossRef CAS PubMed.
- A. Sgarbossa, D. Giacomazza and M. di Carlo, Nutrients, 2016, 7, 5764–5782 CrossRef PubMed.
- F. Yang, G. P. Lim, A. N. Begum, O. J. Ubeda, M. R. Simmons, S. S. Ambegaokar, P. P. Chen, R. Kayed, C. G. Glabe, S. A. Frautschy and G. M. Cole, J. Biol. Chem., 2005, 280, 5892–5901 CrossRef CAS PubMed.
- S. Ghosh, S. Banerjee and P. C. Sil, Food Chem. Toxicol., 2015, 83, 111–124 CrossRef CAS PubMed.
- S. Hu, P. Maiti, Q. Ma, X. Zuo, M. R. Jones, G. M. Cole and S. A. Frautschy, Expert Rev. Neurother., 2015, 15, 629–637 CrossRef CAS PubMed.
- F. Meng, S. Asghar, S. Gao, Z. Su, J. Song, M. Huo, W. Meng, Q. Ping and Y. Xiao, Colloids Surf., B, 2015, 134, 88–97 CrossRef CAS PubMed.
- R. Narlawar, M. Pickhardt, S. Leuchtenberger, K. Baumann, S. Krause, T. Dyrks, S. Weggen, E. Mandelkow and B. Schmidt, ChemMedChem, 2008, 3, 165–172 CrossRef CAS PubMed.
- A. Boländer, D. Kieser, C. Voss, S. Bauer, C. Schön, S. Burgold, T. Bittner, J. Hälzer, R. Heyny-von Haußen, G. Mall, V. Goetschy, C. Czech, H. Knust, R. Berger, J. Herms, I. Hilger and B. Schmidt, J. Med. Chem., 2012, 55, 9170–9180 CrossRef PubMed.
- T. Lührs, C. Ritter, M. Adrian, D. Riek-Loher, B. Bohrmann, H. Döbeli, D. Schubert and R. Riek, Proc. Natl. Acad. Sci. U. S. A., 2005, 102, 17342–17347 CrossRef PubMed.
- RCSB Protein Data Bank, http://www.rcsb.org.
- Schrödinger Release 2016-3: Maestro, version 10.7, Schrödinger, LLC, New York, NY, https://www.schrodinger.com/maestro, 2016 Search PubMed.
- Schrödinger, Prime version 3.0, LLC, New York, 2011 Search PubMed.
- Schrödinger, Epik version 2.2, LLC, New York, 2011 Search PubMed.
- Schrödinger, Maestro version 9.3, LLC, New York, 2012 Search PubMed.
- Schrödinger, Maestro version 2.5LLC, New York, 2011 Search PubMed.
- Schrödinger, Glide version 5.7, LLC, New York, 2011 Search PubMed.
- H. Aissaoui, C. Boss, M. Gude, R. Koberstein and T. Sifferlen, 5,6,7,8-Tetrahydro-imidazo[1,5-a]pyrazine derivatives, WO Patent App. PCT/IB2007/055,245, https://google.com/patents/WO2008078291A1?cl=ko, 2008.
- N. M. Silva, J. L. Tributino, A. L. Miranda, E. J. Barreiro and C. A. Fraga, Eur. J. Med. Chem., 2002, 37, 163–170 CrossRef CAS PubMed.
- Y. Fezoui, D. Hartley, J. Harper, R. Khurana, D. Walsh, M. Condron, D. J. Selkoe, P. T. Lansbury, A. Fink and D. Teplow, Amyloid, 2000, 7, 166–178 CrossRef CAS PubMed.
- A. Sgarbossa, D. Buselli and F. Lenci, FEBS Lett., 2008, 582, 3288–3292 CrossRef CAS PubMed.
- E. Bramanti, L. Fulgentini, R. Bizzarri, F. Lenci and A. Sgarbossa, J. Phys. Chem. B, 2013, 117, 13816–13821 CrossRef CAS PubMed.
- P. Pernot, A. Round, R. Barrett, A. D. M. Antolinos, A. Gobbo, E. Gordon, J. Huet, J. Kieffer, M. Lentini and M. Mattenet, J. Synchrotron Radiat., 2013, 20, 660–664 CrossRef CAS PubMed.
- T. Zemb and P. Lindner, Neutron, X-rays and Light Scattering Methods Applied to Soft Condensed Matter, North Holland, 1st edn, 2002, pp. 23–48 Search PubMed.
- M. R. Mangione, A. Palumbo Piccionello, C. Marino, M. G. Ortore, P. Picone, S. Vilasi, M. Di Carlo, S. Buscemi, D. Bulone and P. L. San Biagio, RSC Adv., 2015, 5, 16540–16548 RSC.
- M. Gorska, A. M. Gammazza, M. Zmijewski, C. Campanella, F. Cappello, T. Wasiewicz, A. Kuban-Jankowska, A. Daca, A. Sielicka, U. Popowska, N. Knap, J. Antoniewicz, T. Wakabayashi and M. Wozniak, PLoS One, 2013, 8, e71135 CAS.
- P. S. Inc, GraphPad version 4.0, San Diego, CA Search PubMed.
- C. Rodríguez-Rodríguez, N. Sánchez de Groot, A. Rimola, A. Álvarez-Larena, V. Lloveras, J. Vidal-Gancedo, S. Ventura, J. Vendrell, M. Sodupe and P. González-Duarte, J. Am. Chem. Soc., 2009, 131, 1436–1451 CrossRef PubMed.
- Y. Masuda, M. Fukuchi, T. Yatagawa, M. Tada, K. Takeda, K. Irie, K.-i. Akagi, Y. Monobe, T. Imazawa and K. Takegoshi, Bioorg. Med. Chem., 2011, 19, 5967–5974 CrossRef CAS PubMed.
- J. S. Schreck and J.-M. Yuan, J. Phys. Chem. B, 2013, 117, 6574–6583 CrossRef CAS PubMed.
- M. Friedemann, E. Helk, A. Tiiman, K. Zovo, P. Palumaa and V. Tougu, Biochem. Biophys. Rep., 2015, 3, 94–99 Search PubMed.
- J. Nasica-Labouze, P. H. Nguyen, F. Sterpone, O. Berthoumieu and N.-V. t. Buchete, Chem. Rev., 2015, 115, 3518–3563 CrossRef CAS PubMed.
- A. Martorana, V. Giacalone, R. Bonsignore, A. Pace, C. Gentile, I. Pibiri, S. Buscemi, A. Lauria and A. Palumbo Piccionello, Curr. Pharm. Des., 2016, 22, 3971–3995 CrossRef CAS PubMed.
- A. Pace, S. Buscemi, A. Palumbo Piccionello and I. Pibiri, in Advances in Heterocyclic Chemistry, ed. E. F. Scriven and C. A. Ramsden, Academic Press, 2015, vol. 116, pp. 85–136 Search PubMed.
- P. Stabile, A. Lamonica, A. Ribecai, D. Castoldi, G. Guercio and O. Curcuruto, Tetrahedron Lett., 2010, 51, 4801–4805 CrossRef CAS.
- A. Lomakin, D. B. Teplow, D. A. Kirschner and G. B. Benedek, Proc. Natl. Acad. Sci. U. S. A., 1997, 94, 7942–7947 CrossRef CAS.
- E. Coelho-Cerqueira, A. S. Pinheiro and C. Follmer, Bioorg. Med. Chem. Lett., 2014, 24, 3194–3198 CrossRef CAS PubMed.
- S. A. Hudson, H. Ecroyd, T. W. Kee and J. A. Carver, FEBS J., 2009, 276, 5960–5972 CrossRef CAS PubMed.
- H. LeVine III, Protein Sci., 1993, 2(3), 404–410 CrossRef PubMed.
- H. Naiki, K. Higuchi, M. Hosokawa and T. Takeda, Anal. Biochem., 1989, 177(2), 244–249 CrossRef CAS PubMed.
- D. Orthaber, A. Bergmann and O. Glatter, J. Appl. Crystallogr., 2000, 33, 218–225 CrossRef CAS.
- J. S. Pedersen and P. Schurtenberger, Macromolecules, 1996, 29, 7602–7612 CrossRef CAS.
- M. G. Ortore, F. Spinozzi, S. Vilasi, I. Sirangelo, G. Irace, A. Shukla, T. Narayanan, R. Sinibaldi and P. Mariani, Phys. Rev. E: Stat., Nonlinear, Soft Matter Phys., 2011, 84, 061904–061910 CrossRef PubMed.
- B. Jacrot, Rep. Prog. Phys., 1976, 39, 911 CrossRef CAS.
- A. Guinier and G. Fournet, Small Angle Scattering of X-ray, Wiley, New York, 1955 Search PubMed.
- F. Spinozzi, C. Ferrero, M. G. Ortore, A. De Maria Antolinos and P. Mariani, J. Appl. Crystallogr., 2014, 47, 1132–1139 CAS.
- A. Sgarbossa, S. Monti, F. Lenci, E. Bramanti, R. Bizzarri and V. Barone, Biochim. Biophys. Acta, Gen. Subj., 2013, 1830(4), 2924–2937 CrossRef CAS PubMed.
- C. Canale, S. Seghezza, S. Vilasi, R. Carrotta, D. Bulone, A. Diaspro, P. L. S. Biagio and S. Dante, Biophys. Chem., 2013, 182, 23–29 CrossRef CAS PubMed.
- C. Malmo, S. Vilasi, C. Iannuzzi, S. Tacchi, C. Cametti, G. Irace and I. Sirangelo, FASEB J., 2006, 20, 346–347 CAS.
Footnote |
| † Electronic supplementary information (ESI) available. See DOI: 10.1039/c7ra05300b |
| This journal is © The Royal Society of Chemistry 2017 |

