 Open Access Article
Creative Commons Attribution 3.0 Unported Licence
Micro-solvation of tyrosine-kinase inhibitor AG1478 explored with fluorescence spectroscopy and computational chemistry†
Muhammad Khattab a,
Feng Wang
 *b and
Andrew H. A. Clayton
 *a
*a
aCentre for Micro-Photonics, Faculty of Science, Engineering and Technology, Swinburne University of Technology, Melbourne, Victoria 3122, Australia. E-mail: aclayton@swin.edu.au
bMolecular Model Discovery Laboratory, Department of Chemistry and Biotechnology, School of Science, Faculty of Science, Engineering and Technology, Swinburne University of Technology, Melbourne, Victoria 3122, Australia. E-mail: fwang@swin.edu.au
First published on 21st June 2017
Abstract
Tyrosine kinase inhibitors (TKI) are an important class of molecules. Specific interactions of TKI with water are of interest since they appear in high resolution X-ray structures of TKI–protein complexes and are thought to be important determinants of drug efficacy. Methods for determining the specific interactions of TKI with water molecules in solution are therefore highly desirable. Recently, we revealed that the TKI, AG1478, exhibits absorbance and fluorescence spectra which are sensitive to the conformation of the molecule and the polarity of the surrounding environment. In the present work, we investigated the potential hydrogen bond binding sites of AG1478 using spectroscopic measurements of acetonitrile–water solutions. UV-Vis absorbance spectroscopy of AG1478 revealed H-bond interactions between water molecules and AG1478 in the ground state, as evidenced by changes in spectral shape and optical density with increases in water fraction. The fluorescence spectra of AG1478 in acetonitrile were also greatly influenced by water interactions, revealing fluorescence quenching (by 80%) with the addition of 2% by volume of water. The AG1478 fluorescence quantum yield decreased with increasing temperature in neat acetonitrile but revealed an unorthodox increase with increasing temperature in acetonitrile–water solution. Taken together, these changes are consistent with a specific complex or complexes formed between AG1478 and water molecules. Potential AG1478–water clusters were investigated using ab initio calculations. The effects of explicit hydrogen bonding on vertical excitation, topology and electronic configuration of AG1478 were examined computationally.
1. Introduction
Several theories and models have been developed to describe the complex process of solvation of solutes in binary mixtures.1–4 Solutes can be preferentially solvated by either solvent, nevertheless the solvent–solvent interactions can significantly influence solute–solvent interactions (solvatochromic parameters).5 Preferential solvation occurs when a solute molecule has, at its vicinity, more of one solvent than in the bulk environment. Hence the understanding of this phenomenon plays a role in unravelling the spectroscopic, kinetic and thermodynamic behaviour of solute molecules.6 Binary mixtures containing water as a cosolvent have been successfully deployed to quantify the number of H-bonding interactions between solute and water molecules. This is accomplished by application of various spectroscopic experiments and/or theoretical calculations using explicit water models.7–11 Hence the organic solvents which are miscible with water are ultimately used for these kind of experiments.Acetonitrile is characterized by good UV transparency, aqueous miscibility, low viscosity and low chemical reactivity. In addition, it has a relatively high dielectric constant and a small autoprotolysis constant.5 Water can solubilize ionic and dipolar solutes and its colligative properties have a large bearing on vast number of biological and chemical systems through its ability to form intermolecular hydrogen bonds.12,13 It has been reported that the structure of pure water is significantly altered upon mixing with other solvents generally and with acetonitrile specifically.13–17 Therefore, binary mixtures of acetonitrile with water are solvents of choice in physical organic chemistry.5,13 A number of studies have attempted to address the impact of microhydration on the geometrical and electronic properties of solute molecules by dissolving them in acetonitrile–water solutions.
For instance, the excited state H-bond dynamics of coumarin 102 were investigated in acetonitrile–water binary mixtures by Wells et al.7 The experimental and simulation data revealed that two water molecules, acting as H-bond donors, can form H-bonds at the carbonyl site of coumarin 102.7 This finding gave a more robust clue for estimating hydrogen bond strength of C 102 molecule. It was found that clustered water molecules can also turn on the bright emission of a molecule and the lifetime of the excited state was dependent on the number of water molecules in first solvation shell. Studies conducted on the adenine analogue, 2-aminopurine, have also led to similar conclusions.18,19 Studies of Lobsiger and co-workers showed that the lifetime of 2-aminopurine increased systematically with the number of water molecules. They also found out that position of bound water molecules was important. The excited-state lifetime was much longer when one water molecule interacted with the NH2 group of 2-aminopurine.18
In general, spectroscopic measurements of drugs in aqueous–organic binary mixtures provide a controllable model system to investigate the interaction of water molecules with drugs. Water molecules are highly translocated at protein binding sites and found essential for drug–protein intermolecular interactions and stability. Therefore, binding interactions between explicit water molecules and drugs affects the nature and diversity of drug chemical structures and properties. Mastering the gain in protein–drug binding affinity can be achieved by targeting or neglecting H-bonding with clustered waters.20
AG1478 is a tyrosine kinase inhibitor,21–23 synthesized to mimic the purine ring of adenosine triphosphate (ATP) cofactor.24 It possesses five H-acceptor moieties and one H-donor group, acting as a potential H-bonding target. Given that it can bind to the protein hinge region of tyrosine kinases through one to three H-bonds,25 it is therefore important to explore the impacts of H-bonding statics and dynamics on the electronic and geometric properties of this TKI.
Our earlier experimental26 and computational27 studies showed that the absorbance of AG1478 was sensitive to the molecular conformation (twisted versus planar), while the fluorescence was influenced by the polarity and hydrogen-bonding power of the solvent.26 We have also observed extensive fluorescence quenching of aqueous AG1478 solution compared to other non-aqueous AG1478 solutions.26 In the last few decades, spectroscopic studies have been performed on probes in different media such as binary solvent mixtures, micelles, reverse micelles and ionic liquids.28–31 When studies in pure water are not feasible, solvent–water binary mixtures provide a controllable environment in which to probe the influence of water against a moderately polar host solvent.32,33 Therefore, we used the binary mixture approach to investigate the intrinsic and extrinsic H-bonding interactions of AG1478 in the ground and excited states.
In this article, the steady-state UV-Vis spectroscopy of AG1478 in acetonitrile solution containing water as a co-solvent, was investigated to reveal the spectral properties of AG1478 in the presence of water molecules. We also performed temperature-dependent fluorescence experiments to delineate the influence of dynamic versus static quenching between AG1478 and water molecules. In addition, time-dependant density functional theory (TD-DFT) was utilized to examine possible complexes of AG1478 with different numbers of water molecules.
2. Experimental
2.1. Materials
Spectroscopic grade acetonitrile was purchased from Thermo Fisher Scientific Inc. and was used without further purification. Deionized water (Millipore) was used to prepare the aqueous solutions. Tyrphostin AG1478 was purchased from Sapphire Bioscience Pty Ltd and used as received. A matched pair of quartz cuvettes with a path length of 1 cm was obtained from Starna Pty Ltd.2.2. Methods
Solutions containing acetonitrile and water were prepared by adding a small volume of water to acetonitrile (in the range 0–16% v/v). Dilute solutions of AG1478 were prepared for spectroscopic measurements (AG1478 concentration was 10−5 M (absorbance) and 10−6 M (fluorescence)). The optical density of 300–360 nm band was adjusted to be above 0.1 for absorption experiments and was lower than 0.05 for excitation and emission measurements to minimize inner filter effect. All spectra are averages of nine scans.
First, we screened for the best possible position(s) (giving most stable complex) for binding of n = 1–7 water molecules to AG1478. That means an explicit water molecule(s) was included at proximity (1.7 Å) to different H-bond acceptor sites of AG1478. Secondly, we determined the most stable geometry for each complex and performed single point energy calculations in dielectric continuum with the dielectric constant of 37 using the CPCM model. We also computed the corresponding vertical excitation energy including state-specific solvation correction. Hereafter, the planar structure complexed with water molecules were referred as P-nw, where n = 1–7, and the twisted rotamer exhibiting intermolecular H-bond with water molecules were referred as T-nw, where n = 1–7. Full geometric coordinates, structural properties and energies are contained in the ESI Tables S1–S5 and Fig. S1–S4.†
3. Results and discussion
3.1. Impact of water H-bonding on AG1478 ground state
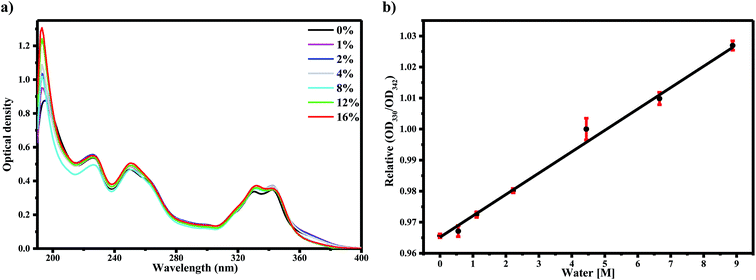
Our previous work assigned the UV-Vis absorption bands of AG1478 to transitions from their respective ground electronic states of the conformers (planar and twisted) to their electronic excited states, respectively, that is, the HOMO–LUMO of a conformer.27 To study the impact of water on these transitions, we examined the absorption spectra of AG1478 in acetonitrile as a function of added water. As shown before,27 the absorption spectrum of AG1478 in neat acetonitrile solution (no added water) was comprised of four major bands as shown in Fig. 1a. The lowest energy bands at 342 nm and 330 nm are assigned to S0 to S1 transitions in the twisted and planar conformation, respectively.27 Consecutive addition of water (up to 0–16% v/v) to acetonitrile solution of AG1478 resulted in very small perturbations to the AG1478 absorption spectra (Fig. 1a): no significant effects on the absorption spectra but small attenuation in the regions of λ < 240 nm and near 370 nm. We stress that while these changes to the absorption spectra are very small in magnitude, and therefore should not be over-interpreted, they do provide evidence for interaction of the AG1478 with water in the ground state.In particular we note the progressive linear increase of optical density of the 330 nm band relative to that of 342 nm peak (Fig. 1b (R2 = 0.99)). We propose that the planar and twisted conformations interact with water differently (the planar conformation has an intramolecular hydrogen bond which become available to the solvent in the twisted conformation). As we will see in the next section, the fluorescence properties of AG1478 are more sensitive to water interaction.
3.2. Impact of water H-bonding on AG1478 excited state
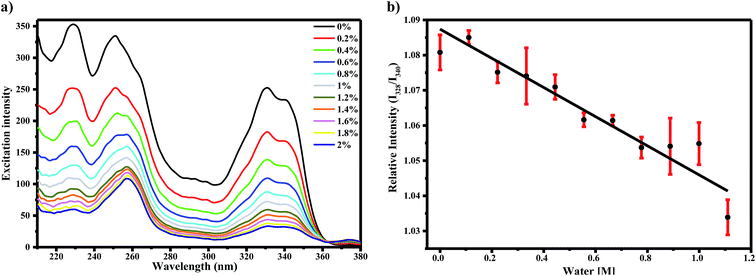
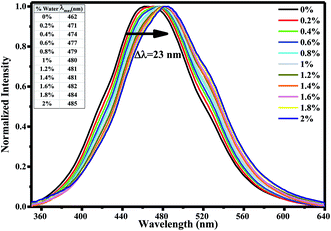
To determine the effect of water on the AG1478 excited-state, we measured the fluorescence excitation and emission spectra of AG1478 in acetonitrile as a function of added water. The fluorescence excitation spectra of 1 μM AG1478 after subsequent addition of 2% v/v of water to acetonitrile solution revealed a noticeable attenuation of fluorescence (by 87–83%) across the range 220–350 nm as shown in Fig. 2a and the augmentation of a new band near 370 nm. The shape of the fluorescence excitation spectra was also perturbed by addition of water resulting in changes to the relative amplitudes (but not positions) of the 328 nm and 340 nm bands. Analyses showed a good (R2 = 0.91) linear correlation between the relative intensity of 328 nm and 340 nm bands and water concentration as shown in Fig. 2b. The change in the ratio of amplitudes suggests that either the population of the planar form or the quantum yield of the planar form or both was diminished by addition of water relative to the twisted form of the molecule. Nevertheless, the changes in the ratio of the two bands are of the order of a few percent, in contrast to the much larger change in the amplitudes of the two bands.In order to explore water interactions with AG1478 in the excited state, we also measured the fluorescence spectra at λexc = 330 nm of 1 μM AG1478 in binary mixtures of acetonitrile/water. By adding consecutive fractions of water in the range 0–2% v/v to the acetonitrile solution with increment of 0.2%, we observed a red shift of the emission peak and a decrease in the fluorescence quantum yield as shown in Fig. 3. A red shift of 8.5 nm was observed after addition of 0.2% v/v of water with a total bathochromic shift of 23 nm with 2% v/v of water; data are compiled in inset of Fig. 3.
The decrease in fluorescence quantum yield with increasing water concentration is shown in Fig. 4a. Again, with 2% v/v of water, the quantum yield decreased by 80%. Based on the dielectric constants of acetonitrile (ε = 36) and water (ε = 78), a 2% v/v water–acetonitrile solution would have an average dielectric constant of 37. An increase in dielectric constant from 36 to 37 cannot solely account for the changes in spectra observed. Taken together, the magnitudes of the bathochromic shifts and fluorescence quenching with water addition which are larger than expected based on bulk solvent properties alone, therefore it can be concluded that the changes in fluorescence are due to specific interactions of AG1478 with the water in the acetonitrile–water solution.
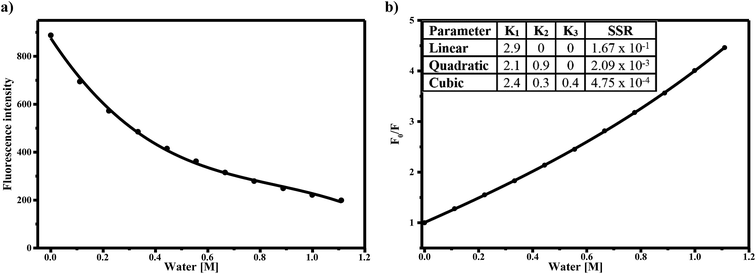 | ||
| Fig. 4 (a) Intensity of emission maxima of AG1478 as a function of water added to acetonitrile solution. (b) Stern–Volmer plot of the fluorescence quenching of AG1478 in acetonitrile due to presence of increasing amounts of water. F0/F is the emission intensity ratio of AG1478 in absence and presence of water, respectively.* See residual plot for each functional fitting in Fig. S5 in ESI.† | ||
Preferential solvation studies, in which fluorophore molecules are explicitly solvated by water molecules in aqueous–organic medium, have been reported.39–42 For instance, the tautomerism of alloxazine to isoalloxazine was triggered by water-facilitated intramolecular proton transfer owing to specific interactions between alloxazine and water molecules.39 Acetonitrile–water mixtures covering the entire range of 0.1–90% v/v of water were used. It was found that lower water compositions upto 0.1–20% v/v can facilitate this process where water molecules were favourably bound with fluorophore through H-bonding (microsolvation). The detailed study revealed that the interaction was most likely to take place in the excited state. Beyond this concentration, the intrinsic H-bonding of water molecules would be strongly favoured forming large clusters with extensive water networks. Hence, fluorophore–water interactions is weakened in water rich media.39
Barbosa et al. studied five standard buffers in acetonitrile–water binary mixtures.43 It was found that the proton (solute) was preferentially solvated by water molecules evidenced by lower pH(s) than expected if hydrogen ion was solvated by acetonitrile molecules.43 On the contrary, studies done by Wakisaka and coworkers found that phenol was preferentially solvated by water at higher mole fraction of water ≥ 0.85.42 Preferential solvation of acetate ions was triggered by water in mixed solvents of water and acetonitrile as reported by Barbosa et al.41 It was concluded that water molecules had a greater tendency to be in vicinity of acetate ions than to acetonitrile molecules reaching its maximum at water mole fraction of 0.20–0.25.41 All these studies support our suggestion that the change in absorption and emission spectra of AG1478 upon adding minute amount of water to medium was due to preferential microsolvation of AG1478 by water molecule.
The strong decrease in fluorescence excitation and emission with added water suggests that water might be thought of as an efficient quencher of AG1478 fluorescence. Therefore, one way to understand the interaction between AG1478 and water was to quantify the water-induced fluorescence quenching by employing the Stern–Volmer equation44
 | (1) |
A linear Stern–Volmer plot indicates the involvement of only one kind of quenching mechanism, either static or dynamic. However the deviation from linearity reveals the contribution of two mechanisms to quenching process.45,46 The Stern–Volmer plot for AG1478 fluorescence quenching as a function of water concentration (in acetonitrile) is depicted in Fig. 4b. Of particular note is that the Stern–Volmer plot revealed departures from linearity, as revealed by poor fits to a linear function. This implies either a combination of dynamic and static quenching or possibly a complex binding process. The distinction between static/binding processes and dynamic quenching cannot be decided from the Stern–Volmer plot alone. However, measurements of fluorescence as a function of temperature can sometimes be used to distinguish between these two classes of quenching.
3.3. Temperature effect on AG1478 emission
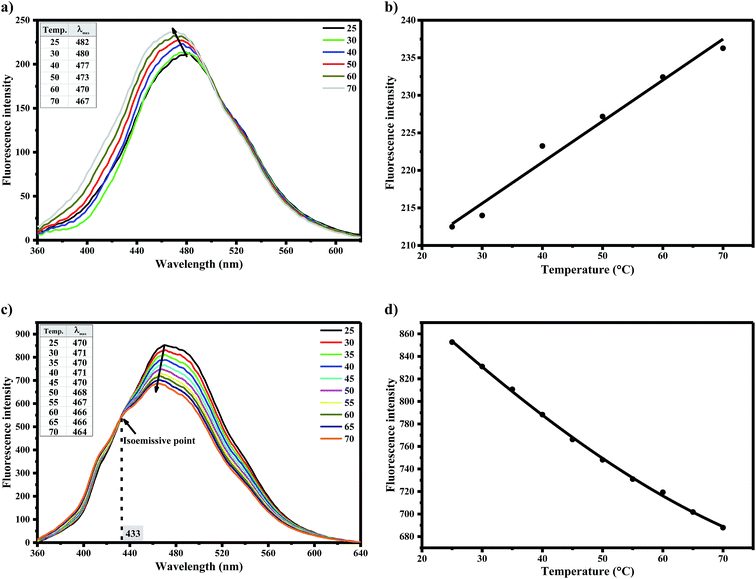
Static and dynamic quenching mechanisms have been reportedly investigated utilizing their varying dependence on temperature, measurement of excited state lifetime or transient absorption spectrum in the presence of quencher.47,48 To distinguish between dynamic and static/binding mechanisms of water-induced AG1478 fluorescence quenching, measurements of fluorescence as a function of temperature were carried out. Temperature-dependant emission spectra (λexc = 330 nm) were recorded in the temperature range of 25–70 °C for AG1478 in acetonitrile/water solution, as shown in Fig. 5a. A remarkable increase in AG1478 fluorescence quantum yield, in addition to a blue shift, was observed upon increasing solution temperature. A plot of fluorescence intensity as a function of varying temperature is depicted in Fig. 5b showing unorthodox behaviour.In the context of fluorescence quenching models, an increase in fluorescence intensity with temperature is consistent with a static quenching/binding model for the AG1478–water interaction in acetonitrile–water solution. We interpret the increase in fluorescence with increasing temperature as due to a temperature-induced dissociation of water from the local vicinity of the AG1478, or alternatively a temperature induced rearrangement of the first solvation shell. In contrast, AG1478 fluorescence in neat acetonitrile (Fig. 5c and d), revealed a decrease with increasing temperature, as expected, owing to the normal increase in temperature-dependent non-radiative deactivation pathways.
Studies of Ghosh et al. on binding interaction between chloramphenicol (Clp) and β-lactoglobulin (βLG) disclosed fluorescence quenching of βLG with increasing concentration of Clp and the Stern–Volmer plot exhibited also an upward curvature.49 The non-linear SV plot may arise due to either (1) simultaneous static–dynamic quenching process and/or (2) high extent of quenching (only static) at higher quencher concentration.45,48 The lifetime measurements excluded the occurrence of dynamic quenching due to undeviating measurements upon increasing quencher concentration. Therefore it was concluded that Clp quenched the target protein fluorescence due to high extent of static quenching.
Generally, the quenching efficiency should decrease with increasing temperature owing to destabilization of fluorophore–quencher complex at ground state.48 However an increase in the Clp–βLG binding constant with increasing temperature was observed. The rationale for this anomaly was revealed by Arrhenius plot.50,51 Where it was concluded that the increase in binding (quenching) rate constant overweigh its decrease due to instability of complex with increasing temperature.49 At first glance, this seems contradictory with our experiments, due to lack of time-resolved equipment and data, however it is line with our measurements and predictions. Taken into account, we have observed fluorescence quenching of AG1478 in neat solution of acetonitrile which contains traces of water (viz. micromolar concentration) while enhancement of emission intensity was noticed in acetonitrile/water (1% v/v = 0.55 M) solution. Given that the concentration of AG1478 was within micromolar range (1 μM), the AG1478 quenching would be due to solely static mechanism exerted by high concentration of the water quencher (≃106 fold abundance). However in our case, the effect of instability of AG1478–water complex is expected to overweigh the fluorophore–quencher binding constant.
3.4. Estimation of the number of water molecules coordinated to AG1478
Because the AG1478 fluorescence quenching due to water appears to be of a static-type rather than a dynamic-type we can reinterpret the quenching in the context of a water binding model. To estimate the number of water molecules in complex with the AG1478, we interpreted the Stern–Volmer plot as a purely static binding model with n water molecules bound. The form of the Stern–Volmer plot for this model is| F0/F = 1 + K1[H2O] + K2[H2O]2 + …Kn[H2O]n | (2) |
Fitting the data in Fig. 4b to this model yielded a best fit with a water coordination number of n = 3 (cubic function). Importantly n = 1 (linear function) or n = 2 (quadratic function) gave fits to Fig. 4b which were of poorer quality (as judged by sum of squared residuals) than n = 3, refer to ESI Fig. S5.† Adding higher terms to eqn (2) than n = 3 did not improve the fits further. Thus the quenching of the AG1478 fluorescence can be accounted for by binding of (at least) three water molecules. In other words, AG1478 is predicted to bind to target protein via three H-bonds and this binding interaction could be monitored by quenching of AG1478 fluorescence emission.
All these observations and conclusions were consistent with that reported by Magalhaes and coworkers for 1,8-naphthalimide derivative.38 The 4-phenoxy-N-methyl-1,8-naphthalimide has almost the same spectral properties as AG1478. A negligible change in its absorption spectra upon modifying the solvent nature was observed compared to the discernible change in emission spectra. It also exhibited a broad non-structured emission spectrum with low fluorescence quantum yield. In addition, a large stokes shift was noted which was augmented by increasing solvent polarity.38
The experimental studies on 4-phenoxy-N-methyl-1,8-naphthalimide revealed the occurrence of bathochromic shift and fluorescence quenching upon adding a little amount of water to its solution in dioxane.38 The Stern–Volmer plot showed an upward curvature indicating that the quenching process was triggered by both dynamic and static pathways. The author concluded that the non-linear fluorescence quenching could be attributed to combination of (1) non-radiative deactivation of excited state exerted by the protic (aqueous) solvent shell and (2) dynamic quenching by collision with free water molecules.38 Since literature assured we are on track for the analyses of binding interactions between AG1478 and water molecules. We next investigate possible AG1478–water complexes using computational chemistry.
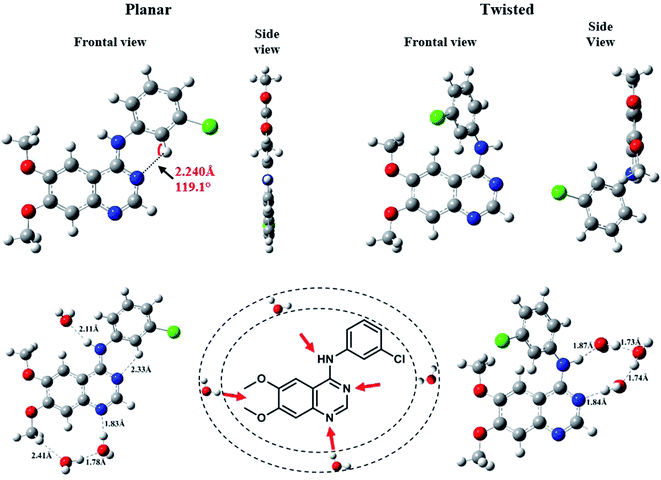
3.5. Computational study
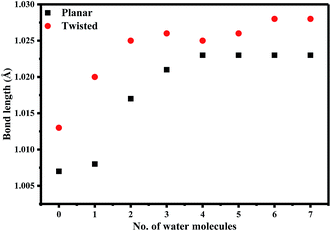
We were the first to report the existence of AG1478 in two different geometrical conformations, twisted (t-AG1478) and planar (p-AG1478), and to link these conformers with distinct absorption bands in the AG1478 UV-vis absorption spectrum.27 In the present study we sought to examine the effect of water on AG1478 using computational methods. We therefore generated potential AG1478·nH2O complexes containing different numbers of water molecules, at different H-bond acceptor sites of AG1478, and calculated energies, geometries and spectroscopic properties of these complexes. Structures and obtained data are included in ESI Tables S1–S5 and Fig. S1–S4.† For the sake of brevity, we present here the salient results for the energy optimized complexes containing n = 1–7 water molecules in each of the twisted and planar conformers. Fig. 6 depicts the frontal and side views of the optimized planar and twisted rotamers in vacuum together with a schematic showing sites of water-docking to AG1478.Since the N(25)–H linker group is the main acidic moiety (Lewis acid) in AG1478, it is therefore, expected that H-bonding with water molecules at the vicinity of the N(25) position will result in the stretching of bond length of N(25)–H. Hence, we calculated some geometric parameters and atomic charges of AG1478 as a function of number of water molecules in the AG1478–water complex. Fig. 7 depicts a plot of the N(25)–H bond length as a function of added water molecules (for twisted and planar AG1478 conformer). The N(25)–H bond length of the twisted AG1478 conformer system (marked in red in Fig. 7) is always longer than the planer conformer system. It is seen from this plot that as the number of water molecules increases (from 0 to 7 water molecules per AG1478), the N(25)–H bond length increased until it reached a plateau, indicting a saturation with respect to the added waters. The planar AG1478 conformer was saturated by 3 water molecules – p-AG1478·3H2O – at which the plateau was reached, whereas the twisted AG1478 conformer is able to bind upto 5 water molecules, i.e., t-AG1478·5H2O. This may explain that the twisted conformer of AG1478 is possibly a more potent drug structure as the twist shape in space enhances binding, comparing to its planar conformer which can be less flexible in this regard.
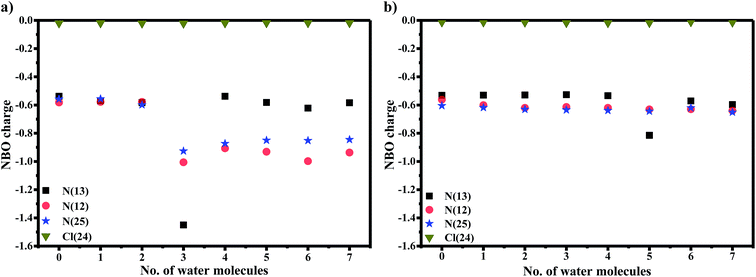
It is known that orientation of AG1478 affects the ability to bind water molecules due to their three-dimensional structures.52 Hydrogen bond formation requires containment of a covalently bonded hydrogen atom between two electronegative atoms. The AG1478 molecule has five electron-donating centres (three nitrogens and two oxygens). Therefore, we examined the electronic charges of some selected heteroatoms of AG1478. In Fig. 8a, NBO charges of electronegative atoms (three nitrogens and one chlorine—which serve as hydrogen bond acceptors) were plotted as a function of number of explicit water molecules in the AG1478–water complex. Charges of two oxygen atoms on the AG1478 compound were not examined because they are unlikely to form H-bond with water molecules in AG1478. Our quantum mechanical calculations indicated that the AG1478–water complexes were not formed through water molecule hydrogen bonding with the oxygen atoms of AG1478. It is seen in Fig. 8a and b that it is unlikely the chlorine atom of the AG1478 would be able to bind a water molecule as the NBO charge on Cl remained unchanged. However, the NBO charges on the nitrogen atoms indeed changed, depending on the AG1478 conformer shape and the number of water molecules in the complexes.
In the planer conformer case in Fig. 8a, the NBO charges of three nitrogen atoms in the AG1478 compound are all in the vicinity of −0.6e when AG1478 forms complexes with up to 3 water molecules. A dramatic increase in negative charges of N(13) is observed when p-AG1478 form a complex with three water molecules. The NBO charge of N(13) drop from approximately −0.6e to −1.4e in p-AG1478·3H2O. Interestingly, when the number of water molecules, n ≠ 3, the NBO charges on N(13) remain almost the same (ca. −0.6e) for p-AG1478·nH2O. It is also noted that the NBO charges on N(25) and N(12) of the p-AG1478·nH2O complexes are very different for n < 3 and n ≥ 3 complexes.27 However, in the t-AG1478 case, the NBO charge of N(13) shows a significant drop (more negative), from ca. −0.6e for t-AG1478·nH2O (n ≠ 5) to −0.8e t-AG1478·5H2O. That is, when forming a complex with five water molecules (n = 5), the charge of N(13) exhibit significant changes in t-AG1478·5H2O, in agreement with the N(25)-H bond length change in Fig. 7.
We also estimated the binding energy between water molecules and AG1478. The graph of water binding energy as a function of number of water molecules in complex with AG1478 is shown in Fig. 9. Addition of n = 1–3 water molecules caused a progressive stabilization of the AG1478·nH2O complexes (relative to isolated constituents) as evidenced by the decreased binding energy. The figure shows that when binding with upto n = 7 water molecules, the complex AG1478·nH2O may be stable as the binding energy with respect to the AG1478 compound is negative. However, binding three water molecules (n = 3), AG1478·3H2O complexes, either planar or twisted, can be the most stable complex for n = 1–7, as the binding energy is the most negative at n = 3. Further addition of more than three (n = 4–7) water molecules will reduce the stability of the AG1478·nH2O complexes. In addition, the t-AG1478·3H2O complex is more stable than the p-AG1478·3H2O complex as the former exhibits larger bonding energy than the latter in Fig. 9.
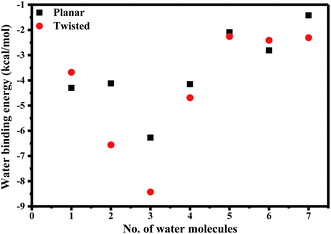 | ||
| Fig. 9 Binding energy of explicit water molecules to AG1478·nH2O (n = 1–7) complexes calculated using the DFT based B3LYP/6-311+G* model. | ||
The computed absorbance properties (transition energy and oscillator strength) of the first excited-state of AG1478 as a function of the number of added water molecules are listed in Table 1 for the planar and twisted conformations. The calculated S0 to S1 transition wavelength of free planar structure was 331 nm. Addition of one water molecule, caused a red-shift from 331 nm to 333 nm (by 2 nm) and a slight increase in oscillator strength. However, a very large red-shift by 21 nm to 352 nm was observed when three molecules of water were complexed with AG1478. Further additions of water (4–7 water molecules) caused a blue shift (from 352 nm) back to 340–342 nm. It was also notable that P-3w structure exhibited the lowest oscillator strength among other hydrated isomers Since AG1478·3H2O exhibited the lowest energy absorption transition among other hydrated complexes, therefore it has the smallest HOMO–LUMO energy gap. Hence it was again concluded that the trihydrated complex is the most stable structures of AG1478. The low oscillator strength of absorption transition of AG1478·3H2O might in part contribute to the observed fluorescence quenching.
| P | P-1w | P-2w | P-3w | P-4w | P-5w | P-6w | P-7w | |
|---|---|---|---|---|---|---|---|---|
| E (nm) | 331 | 333 | 332 | 352 | 340 | 341 | 342 | 341 |
| Osc. str. | 0.5229 | 0.5475 | 0.4748 | 0.4206 | 0.4281 | 0.4492 | 0.4559 | 0.4601 |
| T | T-1w | T-2w | T-3w | T-4w | T-5w | T-6w | T-7w | |
|---|---|---|---|---|---|---|---|---|
| E (nm) | 342 | 340 | 346 | 366 | 369 | 354 | 334 | 328 |
| Osc. str. | 0.2476 | 0.2511 | 0.2515 | 0.2278 | 0.2269 | 0.2386 | 0.2329 | 0.2349 |
The AG148 in the twisted configuration showed a different trend, where the excitation energy of free AG1478 was computed at 342 nm. By adding one water molecule, there was a blue-shift by 2 nm followed by 6 nm red-shift with 2 water molecules. As for the planar configuration, addition of 3–5 waters produced complexes with red-shifted absorption bands, calculated at 366 nm, 369 nm and 354 nm, respectively. Further additions of water caused a blue shift in the calculated absorbance bands to 334 nm (6 waters) and 328 nm (7 waters). It may be coincidence, but it appeared that the planar and twisted absorbance bands underwent an inversion, particularly at high water hydration.
Moreover, while we do not expect exact agreement in the prediction of relative absorbance of the 330 nm and 340 nm bands by theory, the prediction of an inversion of the twisted and planar absorbance bands at high hydration might be related to the inversion of the relative amplitudes of the 330 nm and 340 nm bands seen in the experimental absorbance spectra. The prediction from the computation studies of a red-shifted absorption band may also have some relevance to the experimental absorbance and excitation spectra, both showing a shoulder or extra band near 370 nm over a limited range of water concentrations. The shoulder at 370 nm has higher optical density due to promotion of absorption from T-3w and T-4w structures at 366 nm and 369 nm, respectively at lower water concentration (till 4% v/v of added water). While at higher water concentration (≥8% v/v), the higher water complexes of both planar and twisted structures showed absorbance in the range of 328–354 nm (refer to Table 1) resulting in reduction in amplitude of the 370 nm shoulder, as observed experimentally.
To summarize, the geometric properties, heteroatom charges, energetics of stabilization and computed absorbance spectra as a function of added water pointed to 3–4 molecules as having largest effect on AG1478 properties. These results are in good agreement with the spectroscopic results showing that about 3 water molecules have the largest influence on fluorescence quenching. It is important to stress that we are not suggesting that only three water molecules make up the solvation shell of AG1478 but rather hydrogen bonds between the water and AG1478 are important determinants of the spectroscopy of this molecule. In an ensemble of AG1478 in solution, we would expect a distribution of micro-solvation states containing zero, one, two, three or more water molecules and acetonitrile molecules as well. The distribution will be dictated in part by the water fraction and by the relative energetics of the relevant solute–solvent and solvent–solvent interactions. In our work we have attempted to simplify the system theoretically by treating the acetonitrile as a dielectric continuum and the water explicitly. This is clearly an approximation.
It is important to address some important differences between the theory and experiment. The theoretical calculations do not address temperature or configurational averaging which are also important. On the other hand, the spectroscopic experiments are ensemble averages which occur in equilibrium at room temperature. To relate the two studies more precisely would require knowledge of the precise configurations and their population distributions. Nevertheless, the computational study here has allowed us to identify specific sites of H-bonding from water that are important determinants of AG1478 spectroscopy.
Literature studies have emphasized that enzyme activity constitutes an intricate function of clustered water molecules in organic solvents. The conformational flexibility and enzymatic activity relies on the water content of the protein.53–55 Taken into account that preferential solvation is a well-established explicit model that can describe qualitatively and quantitatively the protein surface occupancy by water (hydration/solvation) and cosolvent (solvation) molecules.56,57 Our experiments and theory are of great relevance to understanding micro-solvation and H-bonding interactions in the quinazoline class of TKI. In structures of TKI complexed with proteins, H-bonding to water in the protein binding site and to amino acids inside the protein are typically observed.58,59 Given the high sensitivity of AG1478 fluorescence to hydration (as observed here from the acetonitrile–water mixtures), we would predict that fluorescence will be a useful probe of water–TKI interactions in protein binding sites. More detailed study of micro-solvation of AG1478 can be revealed using molecular dynamics (MD) which is out of the scope of this study.
4. Conclusion
Spectroscopic analysis of AG1478 in acetonitrile–water binary mixtures was a successful strategy to quantify sites available for H-bonding of AG1478. Analysis of fluorescence quenching using a binding model disclosed three potential sites for forming H-bonds between AG1478 and water molecules. The theoretical study was consistent with experimental results and revealed that AG1478 might exist in equilibrium of planar and twisted structures bound to varying number (1–7) of water molecules. All of the AG1478![[thin space (1/6-em)]](https://www.rsc.org/images/entities/char_2009.gif) :
:![[thin space (1/6-em)]](https://www.rsc.org/images/entities/char_2009.gif) water complexes exhibited calculated excitation energies within the experimentally observed values. The hydrated twisted structures were predicted to be more energetically favoured than hydrated planar counterparts, in contrast to dehydrated AG1478. In this regard, we predict that the extend of hydration of the drug binding site in the protein may be an important determinant of whether planar or twisted drug conformation is populated in the drug–protein complex. The studies conducted here show that AG1478 can be used as a micro-solvation probe and lay the ground work for future studies of AG1478 in more complex environments such as proteins.
water complexes exhibited calculated excitation energies within the experimentally observed values. The hydrated twisted structures were predicted to be more energetically favoured than hydrated planar counterparts, in contrast to dehydrated AG1478. In this regard, we predict that the extend of hydration of the drug binding site in the protein may be an important determinant of whether planar or twisted drug conformation is populated in the drug–protein complex. The studies conducted here show that AG1478 can be used as a micro-solvation probe and lay the ground work for future studies of AG1478 in more complex environments such as proteins.
Acknowledgements
M. Khattab acknowledges Swinburne University Postgraduate Research Award (SUPRA). FW acknowledges supercomputer support from Swinburne University of Technology.References
- M. Jabbari, N. Khosravi, M. Feizabadi and D. Ajloo, RSC Adv., 2017, 7, 14776–14789 RSC.
- V. T. B. Pham, H. M. Hoang, G. Grampp and D. R. Kattnig, J. Phys. Chem. B, 2017, 121, 2677–2683 CrossRef CAS PubMed.
- M. Daneri and C. J. Abelt, J. Photochem. Photobiol., A, 2015, 310, 106–112 CrossRef CAS.
- A. Duereh, Y. Sato, R. L. Smith and H. Inomata, J. Phys. Chem. B, 2015, 119, 14738–14749 CrossRef CAS PubMed.
- S. Sanli, J. Solution Chem., 2013, 42, 967–978 CrossRef CAS.
- D. C. da Silva, I. Ricken, M. A. D. Silva and V. G. Machado, J. Phys. Org. Chem., 2002, 15, 420–427 CrossRef CAS.
- N. P. Wells, M. J. McGrath, J. I. Siepmann, D. F. Underwood and D. A. Blank, J. Phys. Chem. A, 2008, 112, 2511–2514 CrossRef CAS PubMed.
- K. Bhaskaran-Nair, M. Valiev, S. H. M. Deng, W. A. Shelton, K. Kowalski and X. B. Wang, J. Chem. Phys., 2015, 143, 224301 CrossRef PubMed.
- D. Ghosh, O. Isayev, L. V. Slipchenko and A. I. Krylov, J. Phys. Chem. A, 2011, 115, 6028–6038 CrossRef CAS PubMed.
- J. W. Ho, H. C. Yen, H. Q. Shi, L. H. Cheng, C. N. Weng, W. K. Chou, C. C. Chiu and P. Y. Cheng, Angew. Chem., Int. Ed., 2015, 54, 14772–14776 CrossRef CAS PubMed.
- V. B. Pacheco and P. Chaudhuri, J. Phys. Chem. A, 2013, 117, 5675–5684 CrossRef CAS PubMed.
- D. S. Venables and C. A. Schmuttenmaer, J. Chem. Phys., 2000, 113, 11222–11236 CrossRef CAS.
- J. Catalan, C. Diaz and F. Garcia-Blanco, Org. Biomol. Chem., 2003, 1, 575–580 CAS.
- P. Petong, R. Pottel and U. Kaatze, J. Phys. Chem. A, 2000, 104, 7420–7428 CrossRef CAS.
- D. B. Wong, K. P. Sokolowsky, M. I. El-Barghouthi, E. E. Fenn, C. H. Giammanco, A. L. Sturlaugson and M. D. Fayer, J. Phys. Chem. B, 2012, 116, 5479–5490 CrossRef CAS PubMed.
- H. Tanaka, J. Walsh and K. E. Gubbins, Mol. Phys., 1992, 76, 1221–1233 CrossRef CAS.
- G. Matisz, A. M. Kelterer, W. M. F. Fabian and S. Kunsagi-Mate, Phys. Chem. Chem. Phys., 2015, 17, 8467–8479 RSC.
- S. Lobsiger, S. Blaser, R. K. Sinha, H. M. Frey and S. Leutwyler, Nat. Chem., 2014, 6, 989–993 CrossRef CAS PubMed.
- M. Barbatti and H. Lischka, Phys. Chem. Chem. Phys., 2015, 17, 15452–15459 RSC.
- A. T. Garcia-Sosa, J. Chem. Inf. Model., 2013, 53, 1388–1405 CrossRef CAS PubMed.
- A. Gazit, J. Chen, H. App, G. McMahon, P. Hirth, I. Chen and A. Levitzki, Bioorg. Med. Chem., 1996, 4, 1203–1207 CrossRef CAS PubMed.
- Z. Shi, A. K. Tiwari, S. Shukla, R. W. Robey, I. W. Kim, S. Parmar, S. E. Bates, Q. S. Si, C. S. Goldblatt, I. Abraham, L. W. Fu, S. V. Ambudkar and Z. S. Chen, Biochem. Pharmacol., 2009, 77, 781–793 CrossRef CAS PubMed.
- L. Caja, P. Sancho, E. Bertran, C. Ortiz, J. S. Campbell, N. Fausto and I. Fabregat, Biochem. Pharmacol., 2011, 82, 1583–1592 CrossRef CAS PubMed.
- F. A. Al-Obeidi and K. S. Lam, Oncogene, 2000, 19, 5690–5701 CrossRef CAS PubMed.
- Y. Liu and N. S. Gray, Nat. Chem. Biol., 2006, 2, 358–364 CrossRef CAS PubMed.
- M. Khattab, F. Wang and A. H. Clayton, Spectrochim. Acta, Part A, 2016, 164, 128–132 CrossRef CAS PubMed.
- M. Khattab, S. Chatterjee, A. H. A. Clayton and F. Wang, New J. Chem., 2016, 40, 8296–8304 RSC.
- D. Banerjee and S. K. Pal, J. Phys. Chem. A, 2008, 112, 7314–7320 CrossRef CAS PubMed.
- F. Gao, X. J. Ye, H. R. Li, X. L. Zhong and Q. Wang, ChemPhysChem, 2012, 13, 1313–1324 CrossRef CAS PubMed.
- M. K. Nayak, J. Photochem. Photobiol., A, 2012, 241, 26–37 CrossRef CAS.
- K. Suda, M. Terazima and Y. Kimura, Chem. Phys. Lett., 2012, 531, 70–74 CrossRef CAS.
- T. S. Choi, J. W. Lee, K. S. Jin and H. I. Kim, Biophys. J., 2014, 107, 1939–1949 CrossRef CAS PubMed.
- M. T. Sonoda, N. H. Moreira, L. Martinez, F. W. Favero, S. M. Vechi, L. R. Martins and M. S. Skaf, Braz. J. Phys., 2004, 34, 3–16 CrossRef CAS.
- A. D. Becke, J. Chem. Phys., 1993, 98, 1372–1377 CrossRef CAS.
- A. D. Becke, J. Chem. Phys., 1993, 98, 5648–5652 CrossRef CAS.
- M. Cossi, N. Rega, G. Scalmani and V. Barone, J. Comput. Chem., 2003, 24, 669–681 CrossRef CAS PubMed.
- G. W. T. M. J. Frisch, H. B. Schlegel, G. E. Scuseria, M. A. Robb, J. R. Cheeseman, G. Scalmani, V. Barone, B. Mennucci, G. A. Petersson, H. Nakatsuji, M. Caricato, X. Li, H. P. Hratchian, A. F. Izmaylov, J. Bloino, G. Zheng, J. L. Sonnenberg, M. Hada, M. Ehara, K. Toyota, R. Fukuda, J. Hasegawa, M. Ishida, T. Nakajima, Y. Honda, O. Kitao, H. Nakai, T. Vreven, J. A. Montgomery Jr, J. E. Peralta, F. Ogliaro, M. Bearpark, J. J. Heyd, E. Brothers, K. N. Kudin, V. N. Staroverov, R. Kobayashi, J. Normand, K. Raghavachari, A. Rendell, J. C. Burant, S. S. Iyengar, J. Tomasi, M. Cossi, N. Rega, J. M. Millam, M. Klene, J. E. Knox, J. B. Cross, V. Bakken, C. Adamo, J. Jaramillo, R. Gomperts, R. E. Stratmann, O. Yazyev, A. J. Austin, R. Cammi, C. Pomelli, J. W. Ochterski, R. L. Martin, K. Morokuma, V. G. Zakrzewski, G. A. Voth, P. Salvador, J. J. Dannenberg, S. Dapprich, A. D. Daniels, Ö. Farkas, J. B. Foresman, J. V. Ortiz, J. Cioslowski, and D. J. Fox, Gaussian 09, Revision C.01, Gaussian, Inc., Wallingford CT, 2009 Search PubMed.
- J. L. Magalhaes, R. V. Pereira, E. R. Triboni, P. Berci, M. H. Gehlen and F. C. Nart, J. Photochem. Photobiol., A, 2006, 183, 165–170 CrossRef CAS.
- S. D. Choudhury and H. Pal, J. Phys. Chem. B, 2016, 120, 11970–11977 CrossRef PubMed.
- V. A. Sirotkin and A. A. Kuchierskaya, J. Phys. Chem. B, 2017, 121, 4422–4430 CrossRef CAS PubMed.
- J. Barbosa, D. Barron, R. Berges, V. SanzNebot and I. Toro, J. Chem. Soc., Faraday Trans., 1997, 93, 1915–1920 RSC.
- A. Wakisaka, S. Takahashi and N. Nishi, J. Chem. Soc., Faraday Trans., 1995, 91, 4063–4069 RSC.
- J. Barbosa and V. Sanznebot, J. Chem. Soc., Faraday Trans., 1994, 90, 3287–3292 RSC.
- H. Boaz and G. K. Rollefson, J. Am. Chem. Soc., 1950, 72, 3435–3443 CrossRef CAS.
- B. K. Paul, N. Ghosh and S. Mukherjee, Langmuir, 2014, 30, 5921–5929 CrossRef CAS PubMed.
- B. K. Paul, D. Ray and N. Guchhait, Phys. Chem. Chem. Phys., 2013, 15, 1275–1287 RSC.
- I. Y. S. Lee and H. Suzuki, J. Photochem. Photobiol., A, 2008, 195, 254–260 CrossRef CAS.
- J. R. Lakowicz, Principles of fluorescence spectroscopy, Springer Science & Business Media, 2013 Search PubMed.
- N. Ghosh, R. Mondal and S. Mukherjee, Langmuir, 2015, 31, 8074–8080 CrossRef CAS PubMed.
- F. F. Tian, F. L. Jiang, X. L. Han, C. Xiang, Y. S. Ge, J. H. Li, Y. Zhang, R. Li, X. L. Ding and Y. Liu, J. Phys. Chem. B, 2010, 114, 14842–14853 CrossRef CAS PubMed.
- J. Q. Tong, F. F. Tian, Q. Li, L. L. Li, C. Xiang, Y. Liu, J. Dai and F. L. Jiang, Photochem. Photobiol. Sci., 2012, 11, 1868–1879 CAS.
- A. Ganesan, J. Dreyer, F. Wang, J. Akola and J. Larrucea, J. Mol. Graphics Modell., 2013, 45, 180–191 CrossRef CAS PubMed.
- T. Kijima, S. Yamamoto and H. Kise, Enzyme Microb. Technol., 1996, 18, 2–6 CrossRef CAS.
- K. Griebenow and A. M. Klibanov, J. Am. Chem. Soc., 1996, 118, 11695–11700 CrossRef CAS.
- Y. L. Khmelnitsky, V. V. Mozhaev, A. B. Belova, M. V. Sergeeva and K. Martinek, Eur. J. Biochem., 1991, 198, 31–41 CrossRef CAS PubMed.
- S. N. Timasheff, Proc. Natl. Acad. Sci. U. S. A., 2002, 99, 9721–9726 CrossRef CAS PubMed.
- T. Arakawa, Y. Kita and S. N. Timasheff, Biophys. Chem., 2007, 131, 62–70 CrossRef CAS PubMed.
- N. M. Levinson and S. G. Boxer, Nat. Chem. Biol., 2014, 10, 127–132 CrossRef CAS PubMed.
- E. De Moliner, N. R. Brown and L. N. Johnson, Eur. J. Biochem., 2003, 270, 3174–3181 CrossRef CAS PubMed.
Footnote |
| † Electronic supplementary information (ESI) available. See DOI: 10.1039/c7ra04435f |
| This journal is © The Royal Society of Chemistry 2017 |

