 Open Access Article
Creative Commons Attribution 3.0 Unported Licence
A simple, fast, and sensitive colorimetric assay for visual detection of berberine in human plasma by NaHSO4-optimized gold nanoparticles†
Ziwei Hu‡
a,
Mingshan Xie‡a,
Danting Yangb,
Dong Chenc,
Jingyi Jiana,
Haibin Lia,
Kaisong Yuana,
Zhengjin Jiang*a and
Haibo Zhou *a
*a
aInstitute of Pharmaceutical Analysis, College of Pharmacy, Jinan University, Guangzhou, Guangdong 510632, China. E-mail: haibo.zhou@jnu.edu.cn; jzjjackson@hotmail.com
bDepartment of Preventative Medicine, Zhejiang Provincial Key Laboratory of Pathological and Physiological Technology, Medical School of Ningbo University, Ningbo, Zhejiang 315211, China
cDepartment of Urology, Sun Yat-sen University Cancer Center, Guangzhou, Guangdong 510060, China
First published on 11th July 2017
Abstract
Berberine is an important anti-inflammatory drug widely used for the treatment of heart and intestinal disorders. The quantification of berberine is usually required in clinic medical assays. Herein, we report simple, fast and sensitive colorimetric visualization of berberine in human plasma using citrate-stabilized gold nanoparticles (AuNPs). Upon exposure to μg mL−1 levels of berberine, the AuNP solution exhibits a highly sensitive color change from red to blue and rapid aggregation kinetics within the initial 10 min, which can be directly seen with the naked eye and monitored by UV-vis absorbance spectroscopy. As confirmed by comparison with potential coexisting foreign substances, the presence of positively charged berberine induces the aggregation of the AuNPs owing to the electrostatic attraction and coordination interactions between the ring nitrogen atoms of berberine and the AuNPs, causing a color change of the AuNP suspension. Further evidence is that the sensitivity is significantly improved when NaHSO4 is added to promote the ligand exchange between citrate and berberine at the surface of the AuNPs. The NaHSO4-optimized AuNP system provides a simple colorimetric assay for the rapid detection of berberine in human plasma. The limit of detection (LOD) is 0.24 μg mL−1 by the naked eye and 0.06 μg mL−1 by UV-vis spectroscopy.
Introduction
Berberine is an isoquinoline alkaloid isolated from many medicinal herbs, such as Rhizoma coptidis, Berberis aquifolium, and Berberis vulgaris.1 It has been extensively used as an important anti-inflammatory drug for heart and intestinal disorders for many years, owing to its antitumor promotion activity and anti-lipase effect.2 During the last few decades, many studies have shown that berberine can be used as a novel cholesterol-lowering drug, and as an anti-diabetes agent.3 It also has various beneficial effects on the cardiovascular system,4 and significant antioxidant activities.5,6 In addition, the potential application of berberine as a complementary therapeutic agent for HIV infection has also been reported.7 Thus, it is important to study the pharmacokinetics of berberine for its potential systemic therapeutic effects. In order to achieve this goal, it is necessary to establish a rapid, simple, and sensitive method for the detection of berberine in human plasma. Until now, several methods have been developed for the detection of berberine, such as HPLC,8 ultra-performance liquid chromatography-electrospray ionization-mass spectrometry (UPLC-ESI-MS/MS),9,10 spectrofluorometric methods,11 fluorescent aptasensors,12 and optical fiber sensing with integrating sphere reflection.13 These methods all have the advantages of high sensitivity and selectivity, but require expensive instruments or complicated procedures, making on-site and fast visual berberine sensing difficult.Compared with the above methods for berberine detection, colorimetric sensors based on noble metal nanoparticles have attracted more and more attention due to their distinct variation in color associated with morphology changes. Colorimetric visualization assays can achieve the rapid, reliable and sensitive detection of many analytes, such as melamine,14,15 small molecules16 and heavy metal ions,17 without the use of costly instrumentation or the need for tedious training. Recently, Jian Ling et al.18 reported a colorimetric method for the detection of berberine hydrochloride based on the color change of aggregated silver nanoparticles (AgNPs). But the results they obtained were not satisfactory, as the color change of the AgNPs in response to different concentrations of berberine was not obvious enough to be recognized by the naked eye due to the intrinsic optical properties of the system. In addition, they didn't use the developed method for real sample detection. As a result of surface plasma resonance (SPR), AuNPs exhibit size-tunable optical properties.19 AuNPs have bright colors in the visible spectral range concerning their SPR absorption and light scattering. Colloidal AuNPs are wine-red, whereas their aggregates appear purple or blue in color. The controlled color change induced by aggregation can form the basis of a colorimetric assay. Taking this into account, we used unmodified gold nanoparticles (AuNPs) as a probe for the detection of berberine in human plasma. Citrate-capped AuNPs have an electronegatively charged surface and can be dispersed from each other in water symmetrically by electrostatic repulsion, exhibiting red color for the plasmon resonance absorption.20 However, the presence of positively charged berberine would induce the aggregation of the AuNPs owing to electrostatic attraction, causing a color change of the AuNP suspension. In addition, as an alkaloid, the berberine molecule contains ring nitrogen atoms with a strong binding ability to the surface of AuNPs. The AuNPs can thus be crosslinked directly in the presence of certain amounts of berberine without any extra aid.
Based on the above considerations, we demonstrate herein that the color change induced by the electrostatic and coordination interactions between berberine and the surface of AuNPs can be used for the rapid detection of berberine. Since such a color change can be readily seen by the naked eye, the method demonstrated here enables on-site and visual detection of berberine in human plasma without the aid of any advanced instruments. With this colorimetric sensor, we could identify trace levels of berberine in human plasma within 10 min, as measured with the naked eye or UV-vis spectroscopy.
Experimental
Materials
Berberine (purity > 97%), chloroauric acid tetrahydrate (HAuCl4·4H2O) and trisodium citrate were purchased from Macklin. Tetrahydropapaverine hydrochloride, tetrahydropalmatine and isoquinoline were supplied by Aladdin. These materials were untreated and directly used. Human plasma was provided by Guangdong Provincial Hospital of Traditional Chinese Medicine. Ultra-pure water was supplied by a Millipore water purification system. All glass instruments were washed with concentrated hydrochloric acid and concentrated nitric acid in a volume ratio of 3![[thin space (1/6-em)]](https://www.rsc.org/images/entities/char_2009.gif) :
:![[thin space (1/6-em)]](https://www.rsc.org/images/entities/char_2009.gif) 1 before use, and then washed with ultra-pure water and dried.
1 before use, and then washed with ultra-pure water and dried.
Synthesis of AuNPs
AuNPs were prepared by the reduction of HAuCl4 with trisodium citrate. Typically, 0.25 mL of HAuCl4·4H2O (0.1 M) was added to 100 mL of ultra-pure water and heated to boiling under reflux with magnetic stirring. 1.5 mL of trisodium citrate (1%) was rapidly added into the boiling solution of HAuCl4, and the mixed solution was further refluxed for another 30 min to form a wine-red suspension. The suspension was gradually cooled to room temperature under stirring, and then filtered through a 0.22 μm Millipore membrane. The filtrate was stored in a refrigerator at 4 °C for further use. The average size of the AuNPs is 18 nm as examined by transmission electron microscopy. The concentration of the AuNPs as determined by UV-vis spectrometry was 0.30 nM. The AuNPs were directly used for all further studies at the concentration of 0.30 nM without further concentration or dilution.Detection of berberine
Typically, 10 mL of AuNP suspension was used as a stock liquid for the detection of berberine. Different amounts of analyte were added into 2 mL of the above AuNP suspension. The color change and absorbance spectra were observed with the naked eye and recorded with a UV-vis spectrometer, respectively. The aggregation kinetics of the AuNPs at different concentrations of the berberine analyte were obtained by measurement of the absorbance spectra at intervals of 2.5 min. On the other hand, the sensitivity of the AuNP suspension to berberine was further optimized with NaHSO4. Typically, 9.5 mL of the original AuNP suspension was diluted with 10 mL of deionized water and 0.5 mL of 4.0 mM NaHSO4 to give a mixture with a total volume of 20 mL. The AuNP suspension containing 0.1 mM NaHSO4 was used as a stock liquid for the detection of berberine in real human plasma samples.Extracts of real samples
100 μL of berberine (1 mM) was doped into 500 μL of human plasma to validate the effectiveness of the colorimetric detection of berberine in real samples. The extraction of human plasma for the determination of berberine was carried out according to the following method. Typically, 100 μL of berberine solution (1 mM) was added into 500 μL of plasma, and the mixture was vortexed for 30 seconds. Then, 3 mL of chloroform was added. The mixture was vortexed for 2 minutes and centrifuged at 4000 rpm for 10 minutes. The organic phase was transferred to a centrifuge tube and evaporated to dryness at 40 °C under a gentle stream of nitrogen. The residue was re-dissolved with 100 μL of mobile phase consisting of acetonitrile and water (33![[thin space (1/6-em)]](https://www.rsc.org/images/entities/char_2009.gif) :
:![[thin space (1/6-em)]](https://www.rsc.org/images/entities/char_2009.gif) 67, v/v), then vortexed for 30 seconds, sonicated for 10 minutes, and centrifuged at 4000 rpm for 5 minutes. The supernatant was used as the final sample solution. The extract contained 169.77 μg mL−1 berberine according to the measurement by high-performance liquid chromatography, and was diluted five times for the colorimetric assay.
67, v/v), then vortexed for 30 seconds, sonicated for 10 minutes, and centrifuged at 4000 rpm for 5 minutes. The supernatant was used as the final sample solution. The extract contained 169.77 μg mL−1 berberine according to the measurement by high-performance liquid chromatography, and was diluted five times for the colorimetric assay.
Characterization
UV-vis spectra were recorded with a Varian Carry-5000 UV-Vis-NIR spectrophotometer using 1 cm path length quartz cuvettes. The zeta potential of the AuNPs was recorded with a Malvern Zetasizer Nano-ZS. The AuNPs were observed using a JEM-2100F transmission electron microscope. Optical photographs were taken with a Canon camera. The concentration of berberine in the sample solution was measured using an Agilent 1100 high-performance liquid chromatography system with a UV detector.Results and discussion
Electrostatic attraction and coordination interaction-based aggregation mechanism for the sensing system
Typically, colloidal solutions of AuNPs are wine-red. Once aggregation of the AuNPs occurs, the UV-vis absorbance of the AuNPs changes obviously due to the decrease in the inter-particle distance, causing a color change of the AuNP solution. The citrate-capped AuNPs prepared in this contribution are electronegatively charged (Fig. S1A†), and dispersed from each other symmetrically by the electrostatic repulsion of each particle. The aggregation of the AuNPs occurred when electropositively charged berberine was mixed with the colloidal solution of AuNPs, which is due to the neutralization of the electrostatic repulsion on each gold nanoparticle (Fig. S1B†). The surface charge of the AuNPs changes from −47.2 mV to −26.5 mV. Furthermore, berberine with a nitrogen hybrid ring as a binding site may strongly coordinate to the AuNPs by ligand exchange with weakly surface-bound citrate ions, and finally crosslink the AuNPs. Thus, the colloidal stability was drastically reduced, resulting in the prompt occurrence of particle aggregation, as revealed in Fig. 1. The electrostatic attraction and coordination interaction-based double aggregation mechanism offers a reliable approach to a simple and rapid colorimetric assay for the detection of berberine in human blood, which does not require any extra aid such as specific acceptors.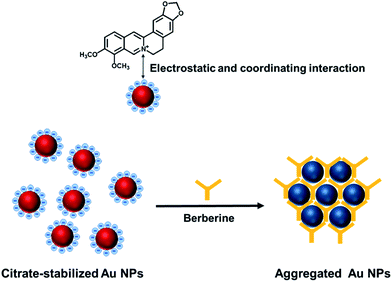 | ||
| Fig. 1 Electrostatic attraction and coordination interaction between berberine and AuNPs, which causes the aggregation of the citrate-stabilized AuNPs. | ||
Colorimetric sensitivity of the AuNP suspension to trace berberine
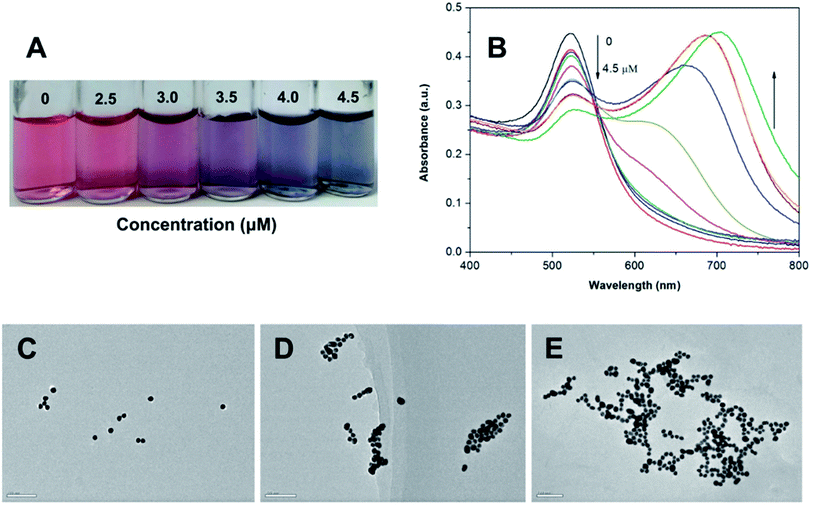
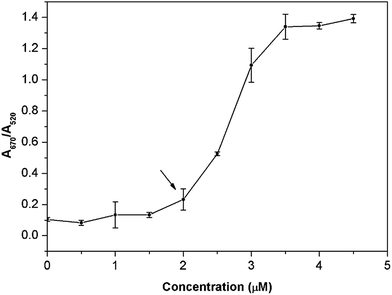
In this study, 18 nm AuNPs were first synthesized by the reduction of HAuCl4 with sodium citrate in aqueous solution based on the reported literature.21 The resulting citrate-stabilized AuNPs were wine-red, because of their strong SPR at 520 nm. Upon direct exposure of the citrate-stabilized AuNPs to berberine, the color of the AuNPs changed from wine-red, to purple to blue progressively as the berberine concentration increased from 0 to 4.5 μM (Fig. 2A). Clear color changes were observed from wine-red to deep red at a berberine concentration as low as 2.5 μM. Meanwhile, the berberine-induced aggregation of the AuNPs was also monitored by UV-vis spectroscopy (Fig. 2B). With the addition of berberine from 0 to 4.5 μM, the original absorbance of the AuNPs at 520 nm decreased gradually, while a new absorbance (centered at 670 nm) from the resulting aggregates increased obviously. This indicates that more and more monodisperse AuNPs were consumed to form more and more aggregates, which was further confirmed by the TEM observations, which showed monodisperse nanoparticles in the absence of berberine (Fig. 2C) and significant aggregation of the nanoparticles in the presence of 3 and 5 μM berberine (Fig. 2D and E, respectively). These above observations clearly indicate that trace levels of berberine can directly induce the aggregation of unmodified AuNPs. Furthermore, the corresponding colorimetric effect was evaluated using the A670/A520 ratio in the presence of different concentrations of berberine (Fig. 3). The very small ratios reveal a slight visible color change from wine-red to deep red in the berberine concentration range of 0.5–2.5 μM, and the large ratios show color mutation from deep red to blue with a further increase in the concentration of berberine. The extinction ratios slightly increased from 0.10 to 0.23 in the berberine concentration range of 0–2.0 μM. The ratios of A670/A520 for 3.0, 3.5 and 4.0 μM berberine are 1.09, 1.34 and 1.35, respectively. As indicated by the arrow in Fig. 3, the mutation point of the color is at 2.0 μM berberine. The measurements of the extinction ratios further confirm that particle aggregation and a corresponding color change occur before the berberine concentration increases up to 2.5 μM.Aggregation kinetics of AuNPs with berberine
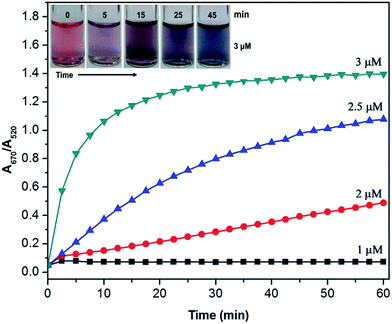
We examined the aggregation kinetics of the unmodified AuNPs in the presence of trace levels of berberine by measuring the temporal evolution of A670/A520 at intervals of 2.5 min. Because a high concentration of berberine (>4.5 μM) leads to the rapid precipitation of the AuNPs during the mixing of berberine with the AuNPs, the aggregation kinetics cannot be accurately characterized by UV-vis spectroscopy. Therefore, we chose four typical concentrations of berberine (1.0, 2.0, 2.5 and 3.0 μM) for the evaluation of the aggregation kinetics. The time course of the aggregation of AuNPs and the plots of A670/A520 versus time at different berberine concentrations are shown in Fig. S2† and 4, respectively. As shown in Fig. 4, a higher concentration of berberine caused a faster extinction ratio rise in the initial stage. At a concentration of 3.0 μM berberine, the extinction ratio exhibits a rapid increase from the original value of 0.05 to 0.84 during the first 5 min, followed by a slow increase to a maximum value of 1.38 after 40 min, revealing that most of the free monodisperse AuNPs in the suspension are promptly consumed in the initial stage. The inset of Fig. 4 shows that the wine-red color of the AuNPs promptly changes into light purple after 5 min, purple after 15 min and finally blue after 45 min. The corresponding extinction ratios are about 0.84, 1.17 and 1.38, respectively. In the case of 2.0 μM berberine, however, the extinction ratio slightly increases from 0.05 to 0.11 in the first 2.5 min, and then exhibits a linear enhancement to 0.47 in the next 55 min, suggesting slow crosslinking aggregation of the AuNPs. When the concentration of berberine was further reduced to 1.0 μM, the extinction ratio very slightly increased in the first 2.5 min and then almost remained at a small constant value. This shows that the free berberine molecules were almost exhausted in a shorter time, but this was not enough to cause the significant aggregation of the AuNPs. In general, the aggregation of the AuNPs starts from the electrostatic interaction between berberine and the surface of the AuNPs, since the citrate-capped AuNPs prepared in this contribution are electronegatively charged, and dispersed from each other symmetrically by the electrostatic repulsion of each particle. The aggregation of the AuNPs occurred when electropositively charged berberine was mixed with the colloidal solution of AuNPs owing to the neutralization of the electrostatic repulsion from each gold nanoparticle.18 The free berberine molecules were promptly exhausted at concentrations lower than 2.0 μM due to the strong adsorption at the surface of the AuNPs. In contrast, free AuNPs in the suspension were promptly consumed when the concentration of berberine was higher than 2.5 μM. These detailed observations further suggest that berberine has a strong electrostatic attraction ability to AuNPs without the aid of a salt to induce aggregation of the gold nanoparticles.Colorimetric selectivity
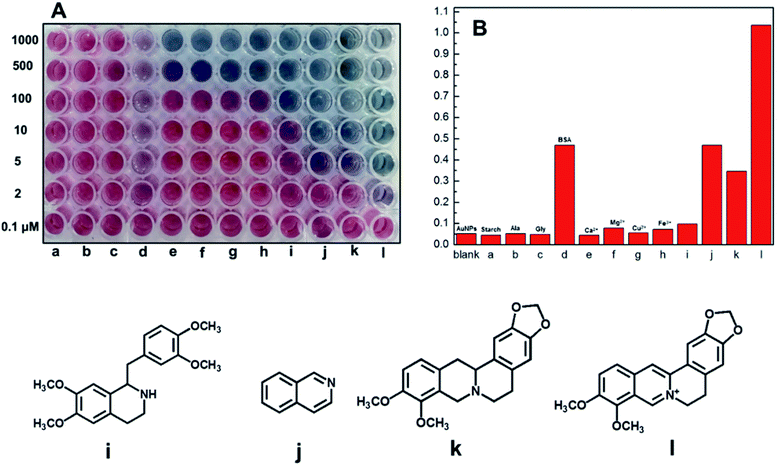
To better understand the berberine-induced aggregation mechanism, we evaluated the colorimetric selectivity of the citrate-stabilized AuNPs using coexisting foreign substances, such as common metal ions, proteins, amino acids and structural analogues of berberine in a 96-well microplate (Fig. 5A). For three typical common compounds, no visible color change of the AuNPs was observed with the addition of 1 mM starch (a), alanine (b) and glycine (c). Based on a multiple-interaction model accounting for specific chemical bonding between BSA and the AuNPs due to the presence of thiol, amine, and imidazole groups in BSA (i.e., cysteine, lysine, and histidine residues),22 addition of 5 μM BSA (d) can result in a light purple color. Although also positively charged, common metal ions can only cause a color change of the AuNPs at a very high concentration. Purple color was only observed with the addition of 500 μM Ca2+ (e) and Mg2+ (f). The results show that electrostatic interactions are not the only mechanism of AuNP aggregation, and the structure of berberine also plays an important role in the process of crosslinking of the AuNPs. Thus, we further investigated the effect of structural analogues of berberine on the aggregation of the AuNPs. The addition of 10 μM tetrahydropapaverine (i) can result in a purple color. Furthermore, isoquinoline (j) and tetrahydropalmatine (k) at concentrations of 10 μM can transform the wine-red AuNPs into blue and deep purple, respectively. These results indicated that the ring nitrogen atoms in these structural analogues of berberine exhibited strong coordination interaction with the AuNPs. It is worth noting that only 2.0 μM of berberine (l) is sufficient to promptly transform the wine-red AuNPs into purple. Therefore, the sensitivity of the AuNPs to the above compounds is in the order of l > j ≈ d > k > i > f > h > g ≈ a, b, c, and e. It is clear that the high sensitivity of the AuNPs to berberine is attributed here to effects of electrostatic interactions and coordination interactions to crosslink the AuNPs strongly via ring nitrogen atoms with the AuNPs, as illustrated in Fig. 1. The colorimetric selectivity was further evaluated by testing the UV-vis spectroscopic response of the AuNPs to the above compounds at 5 μM in solution (Fig. 5B). The very small A670/A520 ratios for a, b, c, e and g are almost identical to that of blank AuNPs (<0.05), suggesting no obvious aggregation of the AuNPs. Berberine exhibits the highest A670/A520 value (1.03), which is 2.94 fold more when compared with its most similar compound k (0.35). These quantitative measurements further show that both the positive charge and the ring nitrogen atoms in berberine or in its structural analogues (i, j, k) induce the aggregation of the AuNPs cooperatively, as shown in Fig. 1.Optimized sensitivity with sodium bisulfate through surface ligand exchange
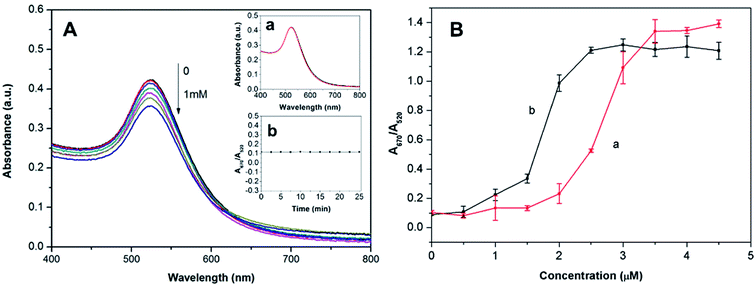
To further confirm the aggregation mechanism and to improve the colorimetric sensitivity, we tested the effect of NaHSO4 as a promoter of ligand exchange between citrate and berberine at the surface of the AuNPs. Although the citrate ligands introduced in the synthesis can weakly bind to the surface of the AuNPs as a stabilizer,23 their relatively large molecular size may hinder the adsorption of berberine to the AuNPs and the further crosslinking of the AuNPs. It is well-known that SO42− anions at a concentration higher than 0.1 M can destroy the stability of citrate-capped metal NPs and result in the aggregation of metal NPs,24 which may be achieved by occupying the surface binding sites of the metal NPs through exchange with the weakly bound citrate ligands.25 To further promote the aggregation of the AuNPs, we used NaHSO4 instead of Na2SO4, because the acidity of the HSO4− salt further promotes the exchange between the SO42− anions and citrate ligands due to the weak basicity of citrate. However, the HSO4− anions at a concentration as low as 1.0 mM do not result in the aggregation of the AuNPs at all, but may promote ligand exchange between the strongly-bound berberine molecules and the citrate ligands at the surface of the AuNPs. It is thus expected that the sensitivity of the AuNPs to berberine will be improved by the addition of a suitable amount of NaHSO4 to the AuNP suspension. We studied the effect of different concentrations of NaHSO4 on the AuNPs, and Fig. 6A shows the absorbance spectra of the AuNP suspension with the addition of different concentrations of NaHSO4. Inset image (a) in Fig. 6A shows the absorbance spectra of the AuNP suspension before and after the addition of 0.1 mM NaHSO4. The two absorbance spectra are completely identical, suggesting no aggregation of the AuNPs. Moreover, the A670/A520 ratio for the AuNP suspension with 0.1 mM NaHSO4 remains at a constant value with time (inset image (b) in Fig. 6A). This clearly indicates that the AuNP suspension is still highly stable after the addition of 0.1 mM NaHSO4. We further compared the sensitivities of the AuNPs to berberine before and after the addition of NaHSO4 by measuring the A670/A520 at different analyte concentrations. As shown in Fig. 6B, the A670/A520 ratios for the NaHSO4-optimized AuNPs in the presence of 0.5–3.0 μM berberine are obviously larger than the corresponding ratios for the original AuNPs. Moreover, the difference becomes larger with the increase of berberine concentration in the range of 0.5–2.5 μM, as shown in Fig. 6B. For example, while the A670/A520 ratios at 2.0, 2.5 and 3.0 μM berberine for the original AuNPs are only 0.23, 0.53 and 1.09, respectively, the corresponding ratios for the NaHSO4-optimized AuNPs are 0.99, 1.21 and 1.25, respectively. That is to say, the extinction ratio was enhanced 2–4-fold in the low concentration range of the analyte by the addition of NaHSO4. Therefore, the addition of NaHSO4 can significantly improve the aggregation sensitivity of the AuNPs to trace levels of berberine.Detection of berberine in real samples
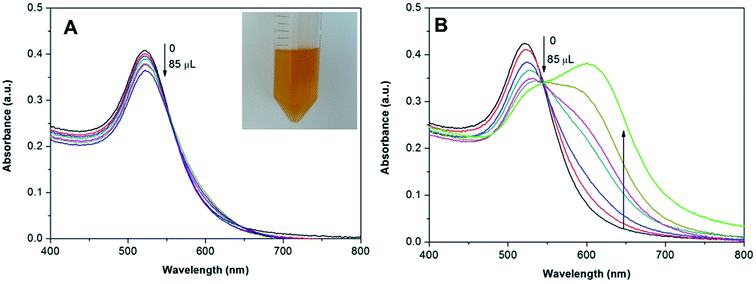
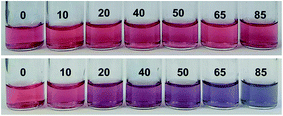
To demonstrate whether the citrate-stabilized AuNPs can be used for the direct detection of berberine in human plasma, we first doped human plasma with 100 μL of berberine (1 mM), and then the human plasma was extracted according to the method mentioned in the ESI.† The extract contains 169.77 μg mL−1 berberine with a recovery rate of 50.47% from the as-added berberine, and was finally diluted 5 times for the colorimetric assay. Meanwhile, a blank extract was also obtained using an identical procedure to evaluate the reliability of the colorimetric assay. The UV-vis spectra also confirm that the NaHSO4-optimized AuNPs are highly sensitive and selective to the extracts of human plasma. With the addition of the blank extract to the AuNP suspension, the absorbance at 520 nm is slightly reduced, but the absorbance at 670 nm shows no increase (Fig. 7A), indicating that the aggregation of the AuNPs did not significantly occur and the decrease in absorbance at 520 nm mainly resulted from the dilution of the AuNPs after the addition of the blank extract. With the addition of the extract from berberine-containing human plasma, however, the absorbance at 520 nm obviously reduced and the new absorbance at 670 nm violently increased with the amount of extract (Fig. 7B). When the final concentration of berberine reached 1.86 μg mL−1, the absorbances at 670 nm are higher than the absorbances at 520 nm. As shown in Fig. 8, the corresponding color of the AuNPs remained constant with the addition of the blank extract (upper image in Fig. 8); however, it can be seen with the naked eye that the color of the AuNPs with the addition of the real sample changed from the original wine-red to blue with different concentrations of berberine (bottom image in Fig. 8). This colorimetric assay allows the detection of concentrations as low as 0.24 μg mL−1 with rapid and reliable visual detection of berberine by comparison with a blank sample. Furthermore, there is a linear relationship between the absorbance change of the AuNPs at 520 nm (Fig. 9) and the concentration of berberine in the real samples in the range of 0.24–0.86 μg mL−1 (R2 = 0.97). Therefore, it can be concluded that our AuNP-based colorimetric probe can be used for the quantitative analysis of berberine in human plasma and the LOD is 0.06 μg mL−1 by UV-vis spectroscopy.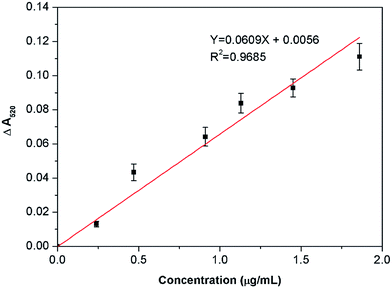 | ||
| Fig. 9 Linear relationship between the absorbance change of the AuNP suspension at 520 nm and the concentration of berberine in real samples. | ||
As far as we know, there is no defined concentration level of berberine in clinical samples at present. However, several groups have reported the berberine concentration in human and animal blood determined by other methods. Hua et al.26 reported that after a 400 mg oral dose of berberine, the mean maximum plasma concentration (Cmax) in twenty volunteers was about 0.4 ng mL−1 determined by a liquid chromatography-electrospray ionization-mass spectrometry (LC-ESI-MS) method. Gui et al.27 studied the pharmacokinetics of berberine in the blood of rats. The results showed that the Cmax of berberine in blood reached 4.169 μg mL−1 after the oral administration of a microemulsion, and 0.394 μg mL−1 after the oral administration of tablets. Such a concentration is apparently higher than the limit of detection that we have achieved in human plasma (0.06 μg mL−1).
Although the Cmax of berberine in twenty volunteers is much lower than the limit of detection achieved in our method due to the poor absolute bioavailability of orally administered berberine, our colorimetric method is fast, simple and visual compared to the LC-ESI-MS method.
Conclusions
In summary, we take advantage of the color change of as-prepared or optimized citrate-stabilized AuNPs to develop a nanoparticle sensor for simple and reliable visual detection of berberine in human plasma. Due to the negative charge on the surface of the AuNPs, berberine can serve as an inducer to directly induce the aggregation of the unmodified AuNPs without the aid of a salt. This colorimetric method offers several advantages over current berberine detection techniques. First, the method does not require expensive and complicated instruments, which simplifies the operation and reduces the cost. Second, the method allows the detection of concentrations as low as 0.24 μg mL−1 to be achieved with the naked eye within 10 min, and therefore it is very suitable for the rapid and ultrasensitive detection of berberine in human plasma. Finally, this sensor exhibits excellent selectivity for berberine over other molecules with positive charges and similar structures and the residual ingredients in the extracts from human plasma. These advantages make this method quite promising for on-site and real-time detection of berberine in human blood for clinical applications.Conflict of interest
The authors declare no competing financial interests.Acknowledgements
This work was supported by the National Natural Science Foundation of China (21505053, 21405138), and the Science and Technology Planning Project of Guangdong Province, China (2015A030401045, 2016A030310089).References
- X. M. Yang, J. S. Wang, J. Luo and L. Y. Kong, One-step large-scale preparative isolation of isoquinoline alkaloids from rhizoma coptidis chinensis by polyamide column chromatography and their quantitative structure-retention relationship analysis, J. Liq. Chromatogr. Relat. Technol., 2012, 35, 1842–1852 CAS.
- X. Zeng and X. Zeng, Relationship between the clinical effects of berberine on severe congestive heart failure and its concentration in plasma studied by HPLC, Biomed. Chromatogr., 1999, 13, 442–444 CrossRef CAS PubMed.
- Y. W. Wang, X. Yi, K. Ghanam, S. C. Zhang, T. T. Zhao and X. M. Zhu, Berberine decreases cholesterol levels in rats through multiple mechanisms, including inhibition of cholesterol absorption, Metab., Clin. Exp., 2014, 63, 1167–1177 CrossRef CAS PubMed.
- H. L. Tan, K. G. Chan, P. Pusparajah, A. Duangjai, S. Saokaew, T. M. Khan, L. H. Lee and B. H. Goh, Rhizoma Coptidis: A potential cardiovascular protective agent, Front. Pharmacol., 2016, 7, 13 Search PubMed.
- S. Habtemariam, Berberine and inflammatory bowel disease: A concise review, Pharmacol. Res., 2016, 113, 592–599 CrossRef CAS PubMed.
- C. Q. Chen, M. L. Lu, Q. H. Pan, J. Fichna, L. J. Zheng, K. S. Wang, Z. Yu, Y. Y. Li, K. Li, A. H. Song, Z. C. Liu, Z. S. Song and M. Kreis, Berberine improves intestinal motility and visceral pain in the mouse models mimicking diarrhea-predominant irritable bowel syndrome (ibs-d) symptoms in an opioid-receptor dependent manner, PLoS One, 2015, 10, 14 Search PubMed.
- W. B. Zha, G. Liang, J. Xiao, E. J. Studer, P. B. Hylemon, W. M. Pandak, G. J. Wang, X. K. Li and H. P. Zhou, Berberine inhibits HIV protease inhibitor-induced inflammatory response by modulating ER stress signaling pathways in murine macrophages, PLoS One, 2010, 5, 8 Search PubMed.
- T. Y. Wu, F. R. Chang, J. R. Liou, I. W. Lo, T. C. Chung and L. Y. Lee, Rapid HPLC quantification approach for detection of active constituents in modern combinatorial formula, San-Huang-Xie-Xin-Tang (SHXXT), Front. Pharmacol., 2016, 7, 1–15 Search PubMed.
- L. Yang, X. Meng, X. Yu and H. Kuang, Simultaneous determination of anemoside B4, phellodendrine, berberine, palmatine, obakunone, esculin, esculetin in rat plasma by UPLC-ESI-MS/MS and its application to a comparative pharmacokinetic study in normal and ulcerative colitis rats, J. Pharm. Biomed. Anal., 2017, 134, 43–52 CrossRef CAS PubMed.
- Z. W. Yuan, E. L. H. Leung, X. X. Fan, H. Zhou, W. Z. Ma, L. Liu and Y. Xie, Quantitative evaluation of berberine subcellular distribution and cellular accumulation in non-small cell lung cancer cells by UPLC-MS/MS, Talanta, 2015, 144, 20–28 CrossRef CAS PubMed.
- S. Liang, Y. F. Kuang, F. F. Ma, S. Chen and Y. F. Long, A sensitive spectrofluorometric method for detection of berberine hydrochloride using Ag nanoclusters directed by natural fish sperm DNA, Biosens. Bioelectron., 2016, 85, 758–763 CrossRef CAS PubMed.
- Y. Q. Guo, Y. X. Chen, Y. L. Wei, H. H. Li and C. Dong, Label-free fluorescent aptasensor for potassium ion using structure-switching aptamers and berberine, Spectrochim. Acta, Part A, 2015, 136, 1635–1641 CrossRef CAS PubMed.
- J. Li, L. Zhang and X. Lin, Rapid and nondestructive detection of berberine hydrochloride in tablets using optical fiber sensing with integrating sphere reflection, J. Anal. Sci., 2015, 31, 285–287 Search PubMed.
- K. L. Ai, Y. L. Liu and L. H. Lu, Hydrogen-bonding recognition-induced color change of gold nanoparticles for visual detection of melamine in raw milk and infant formula, J. Am. Chem. Soc., 2009, 131, 9496–9497 CrossRef CAS PubMed.
- H. Chi, B. H. Liu, G. J. Guan, Z. P. Zhang and M. Y. Han, A simple, reliable and sensitive colorimetric visualization of melamine in milk by unmodified gold nanoparticles, Analyst, 2010, 135, 1070–1075 RSC.
- Z. Q. Gao, Z. L. Qiu, M. H. Lu, J. Shu and D. P. Tang, Hybridization chain reaction-based colorimetric aptasensor of adenosine 5′-triphosphate on unmodified gold nanoparticles and two label-free hairpin probes, Biosens. Bioelectron., 2017, 89, 1006–1012 CrossRef CAS PubMed.
- K. Tian, G. Siegel and A. Tiwari, A simple and selective colorimetric mercury(II) sensing system based on chitosan stabilized gold nanoparticles and 2,6-pyridinedicarboxylic acid, Mater. Sci. Eng., C, 2017, 71, 195–199 CrossRef CAS PubMed.
- J. Ling, Y. Sang and C. Z. Huang, Visual colorimetric detection of berberine hydrochloride with silver nanoparticles, J. Pharm. Biomed. Anal., 2008, 47, 860–864 CrossRef CAS PubMed.
- M. C. Daniel and D. Astruc, Gold nanoparticles: Assembly, supramolecular chemistry, quantum-size-related properties, and applications toward biology, catalysis, and nanotechnology, Chem. Rev., 2004, 104, 293–346 CrossRef CAS PubMed.
- D. D. Evanoff and G. Chumanov, Size-controlled synthesis of nanoparticles. 2. Measurement of extinction, scattering, and absorption cross sections, J. Phys. Chem. B, 2004, 108, 13957–13962 CrossRef CAS.
- K. C. Grabar, R. G. Freeman, M. B. Hommer and M. J. Natan, Preparation and characterization of Au colloid monolayers, Anal. Chem., 1995, 67, 735–743 CrossRef CAS.
- J. B. Liu, S. H. Fu, B. Yuan, Y. L. Li and Z. X. Deng, Toward a universal “adhesive nanosheet” for the assembly of multiple nanoparticles based on a protein-induced reduction/decoration of graphene oxide, J. Am. Chem. Soc., 2010, 132, 7279–7280 CrossRef CAS PubMed.
- Z. Zhang, H. Sun, X. Shao, D. Li, H. Yu and M. Han, Three-dimensionally oriented aggregation of a few hundred nanoparticles into monocrystalline architectures, Adv. Mater., 2005, 17, 42–47 CrossRef CAS.
- X. X. Han, G. G. Huang, B. Zhao and Y. Ozaki, Label-free highly sensitive detection of proteins in aqueous solutions using surface-enhanced Raman scattering, Anal. Chem., 2009, 81, 3329–3333 CrossRef CAS PubMed.
- S. E. J. Bell, N. M. S. Sirimuthu, S. E. J. Bell and N. M. S. Sirimuthu, Surface-enhanced Raman spectroscopy (SERS) for sub-micromolar detection of DNA/RNA mononucleotides, J. Am. Chem. Soc., 2007, 128, 15580–15581 CrossRef PubMed.
- W. Y. Hua, L. Ding, Y. Chen, B. Gong, J. C. He and G. L. Xu, Determination of berberine in human plasma by liquid chromatography-electrospray ionization-mass spectrometry, J. Pharm. Biomed. Anal., 2007, 44, 931–937 CrossRef CAS PubMed.
- S. Y. Gui, L. Wu, D. Y. Peng, Q. Y. Liu, B. P. Yin and J. Z. Shen, Preparation and evaluation of a microemulsion for oral delivery of berberine, Pharmazie, 2008, 63, 516–519 CAS.
Footnotes |
| † Electronic supplementary information (ESI) available. See DOI: 10.1039/c7ra05291j |
| ‡ These authors equally contributed to this work. |
| This journal is © The Royal Society of Chemistry 2017 |

