 Open Access Article
Creative Commons Attribution 3.0 Unported Licence
Novel synthesis of porous Mg scaffold as a reactive containment vessel for LiBH4†
M. Veronica Sofianos *a,
Drew A. Shepparda,
Matthew R. Rowles
 a,
Terry D. Humphries
 a,
Shaomin Liu
 b and
Craig E. Buckley
 a
a
aHydrogen Storage Research Group, Fuels and Energy Technology Institute, Department of Physics and Astronomy, Curtin University, GPO Box U1987, Perth, WA 6845, Australia. E-mail: mvsofianou@gmail.com; Fax: +61 8 9266 2377; Tel: +61 8 9266 1534
bDepartment of Chemical Engineering, Curtin University, GPO Box U1987, Perth, WA 6845, Australia
First published on 21st July 2017
Abstract
A novel porous Mg scaffold was synthesised and melt-infiltrated with LiBH4 to simultaneously act as both a confining framework and a destabilising agent for H2 release from LiBH4. This porous Mg scaffold was synthesised by sintering a pellet of NaMgH3 at 450 °C under dynamic vacuum. During the sintering process the multi-metal hydride, decomposed to Mg metal and molten Na. The vacuum applied in combination with the applied sintering temperature, created the ideal conditions for the Na to vaporise and to gradually exit the pellet. The pores of the scaffold were created by the removal of the H2 and Na from the body of the NaMgH3 pellet. The specific surface area of the porous Mg scaffold was determined by the Brunauer–Emmett–Teller (BET) method and from Small-Angle X-ray Scattering (SAXS) measurements, which was 26(1) and 39(5) m2 g−1 respectively. The pore size distribution was analysed using the Barrett–Joyner–Halenda (BJH) method which revealed that the majority of the pores were macropores, with only a small amount of mesopores present in the scaffold. The melt-infiltrated LiBH4 was highly dispersed in the porous scaffold according to the morphological observation carried out by a Scanning Electron Microscope (SEM) and also catalysed the formation of MgH2 as seen from the X-ray diffraction (XRD) patterns of the samples after the infiltration process. Temperature Programmed Desorption (TPD) experiments, which were conducted under various H2 backpressures, revealed that the melt-infiltrated LiBH4 samples exhibited a H2 desorption onset temperature (Tdes) at 100 °C which is 250 °C lower than the bulk LiBH4 and 330 °C lower than the bulk 2LiBH4/MgH2 composite. Moreover, the LiH formed during the decomposition of the LiBH4 was itself observed to fully decompose at 550 °C. The as-synthesised porous Mg scaffold acted as a reactive containment vessel for LiBH4 which not only confined the complex metal hydride but also destabilised it by significantly reducing the H2 desorption temperature down to 100 °C.
1. Introduction
Over the last few years metal hydrides and complex metal hydrides have been extensively investigated as hydrogen storage materials in order to be used in fuel cell technology, applied in transportation.1–4 A set of targets, determined by the U.S. Department of Energy suggests that a material system should contain at least 5.5 wt% H2 to be deemed as suitable for application.5,6 LiBH4 is one such material owing to its high theoretical gravimetric hydrogen storage density of 18.5 wt%.7 However, one of its greatest limitations as a prospective hydrogen storage medium is that it decomposes at relatively high temperatures (∼350 °C) according to eqn (1).8| 2LiBH4 → 2LiH + 2B + 3H2 | (1) |
The LiH decomposition product is extremely stable and does not decompose until at least 910 °C under 1 bar of H2 backpressure.9 Hence, LiBH4 when used at lower temperatures (<910 °C) has a practical gravimetric hydrogen storage density of 13.8 wt%.10 Reversibility of LiBH4 is also problematic, as temperatures of above 600 °C and 350 bar of hydrogen pressure are required for reabsorption.11 Overall, if the thermal stability and reversibility problems, were overcome, LiBH4 would be a very promising material.
A very common approach that has been extensively applied, in order to decrease the hydrogen desorption temperatures of LiBH4 is to thermodynamically destabilise it with a second phase such as MgH2 or Mg.12–19 It is shown that when MgH2 or Mg is combined with LiBH4, a new decomposition pathway is created by forming MgB2 (eqn (2) and (3)).12,16 It has been proven that MgB2 is thermodynamically more stable in comparison to Mg or B and acts as the destabilising agent for the 2LiBH4 + MgH2 or 2LiBH4 + Mg system.20
| 2LiBH4 + MgH2 → 2LiBH4 + Mg + H2 → 2LiH + MgB2 + 4H2 | (2) |
| 2LiBH4 + Mg → 2LiH + MgB2 + 3H2 | (3) |
When MgH2 is used as the second phase added to LiBH4, two chemical reactions are observed during desorption. First, MgH2 decomposes to Mg and then LiBH4 decomposes to form LiH and MgB2 as seen in eqn (2). The formation of MgB2 only depends on the reactivity between B and metallic Mg, therefore a two reaction step always occurs.16 Whereas, when Mg is used as a second phase, the decomposition pathway of LiBH4 occurs in one single chemical reaction (eqn (3)). These decomposition pathways can be manipulated according to the temperature and H2 backpressures applied during the temperature programmed desorption experiments.16,17
Additional studies have been conducted in order to further reduce the desorption temperature of hydrogen, hasten the kinetics and improve the reversibility of the 2LiBH4–Mg or 2LiBH4–MgH2 system by adding catalyst precursors such as metal salts, metal organic compounds or metal oxides.12,20,21
Another approach found in the literature, widely used in order to enhance the kinetics of the 2LiBH4–MgH2 system, is to nanoconfine the bulk composite into a porous scaffold. The reduction of the particle size down to the nanoscale ensures shorter diffusion distances for hydrogen and other light elements within the nanostructure. Hence, the hydrogen desorption and absorption rates improve in comparison to the bulk material.22–26
Even though many efforts have been made in order to reduce the H2 desorption temperature of the 2LiBH4–Mg and 2LiBH4–MgH2 system, as demonstrated in the literature, no studies have reported any H2 desorption detected below 140 °C in these bulk or catalysed systems. Moreover, even though the nanoconfined as well as the catalysed nanoconfined 2LiBH4–MgH2 systems exhibited improved kinetics and reversibility in comparison to the bulk one, the values of the desorbed H2 (wt% of H2) were poor and hence do not meet the targets set by the U.S. Department of Energy.6 Furthermore, the carbon aerogels used as scaffolds or activated carbons typically contain between 4 wt% and 14 wt% of oxygen.27–29 Therefore, an oxidation reaction between the infiltrated metal hydride system and the oxygen from the scaffold is inevitable and causes H2 capacity loss of the complex metal hydride.
A new type of porous scaffolds have recently made a significant appearance in the literature called porous metal scaffolds. These type of scaffolds have been tested for battery, fuel-cell, energy and catalytic applications due to their robustness.30–33
In this study, we report a novel method for the synthesis of a porous Mg scaffold using NaMgH3 as a starting material. The hydride was pressed into a pellet and sintered under dynamic vacuum in order to remove H2 and Na. The morphology of the Mg scaffold was investigated by N2 adsorption/desorption and Small Angle X-ray scattering (SAXS) measurements as well as by a Scanning Electron Microscope (SEM) which revealed an open pore network that consisted mainly of macropores and only a small number of mesopores. LiBH4 was melt-infiltrated into the porous metal scaffold and catalysed the formation of MgH2 as seen from the X-ray diffraction patterns of the melt-infiltrated samples. Scanning Electron Microscopy revealed that the melt-infiltrated LiBH4 was highly dispersed. All melt-infiltrated samples exhibited a H2 desorption onset temperature (Tdes) at 100 °C which is 250 °C lower than the bulk LiBH4 and 330 °C lower than the bulk 2LiBH4/MgH2 composite. Furthermore, the LiBH4 of the melt-infiltrated samples was completely decomposed at 550 °C (under 1.5–2.7 bar of H2 backpressure) showing no LiH present in the samples even though LiH is known to decompose above 910 °C under 1 bar of H2 backpressure or completely decompose to form LiMg alloys when vacuum is applied at 560 °C. The porous Mg scaffold acted as a reactive containment vessel for LiBH4 by simultaneously destabilising and confining it. These novel hydrogen storage composite materials exhibited both low H2 desorption temperatures and high values of experimental desorbed H2 which make them promising candidates for on-board hydrogen storage in vehicles run by a fuel cells.
2. Experimental details
2.1 Sample preparation
All chemicals used for the synthesis were sensitive to both air and moisture. Therefore, all sample preparation and handling was performed using an Ar glovebox with O2 and H2O less than 1 ppm to avoid sample contamination.NaMgH3 was synthesised by ball milling NaH (Sigma Aldrich, 95%) and MgH2 (Alfa Aesar, 98%) in a 1![[thin space (1/6-em)]](https://www.rsc.org/images/entities/char_2009.gif) :
:![[thin space (1/6-em)]](https://www.rsc.org/images/entities/char_2009.gif) 1 molar ratio under an Ar atmosphere at room temperature using an Across International Planetary Ball Mill (PQ-N04) employing stainless steel vials. A ball to powder mass ratio of 30
1 molar ratio under an Ar atmosphere at room temperature using an Across International Planetary Ball Mill (PQ-N04) employing stainless steel vials. A ball to powder mass ratio of 30![[thin space (1/6-em)]](https://www.rsc.org/images/entities/char_2009.gif) :
:![[thin space (1/6-em)]](https://www.rsc.org/images/entities/char_2009.gif) 1 was applied by using the same number of 10 mm and 6 mm diameter stainless steel balls. The rotational speed was 350 rpm with a total milling time of 4 hours. The vials changed rotation every 15 min with a 5 min pause between each rotation. The final product was then annealed overnight at 300 °C under 50 bar of H2.
1 was applied by using the same number of 10 mm and 6 mm diameter stainless steel balls. The rotational speed was 350 rpm with a total milling time of 4 hours. The vials changed rotation every 15 min with a 5 min pause between each rotation. The final product was then annealed overnight at 300 °C under 50 bar of H2.
The porous Mg scaffold was synthesised by pressing NaMgH3 into a pellet using an 8 mm stainless steel die under a 2.5 ton load. The NaMgH3 was loaded into the die inside the glovebox and then placed into a sealable plastic bag that was connected, via plastic tubing, to a push-fit valve. The bag was then removed from the glovebox and connect to vacuum before pressing. The resulting pellets were typically pressed to 70% of the crystal density of NaMgH3, were ∼1 mm in height and weighed 0.1 g. After disconnecting the vacuum line, the die was immediately returned to the glovebox where the pellets were removed from the die and transferred to steel sample cells and lastly sintered for 3 hours under dynamic vacuum at 450 °C using a Labec VTF 80/12 tube furnace. The ramping rate applied was 5 °C min−1 and after the 3 hours of sintering time the sample was left to cool to room temperature. After removal of Na and H2 by the sintering process, all pellets retained the shape and size of the initial NaMgH3 pellet. Using an initial H2 backpressure of ∼60 bar to prevent decomposition, various weight percentages of LiBH4 (Sigma Aldrich ≥ 90%) were melt-infiltrated into the porous Mg scaffold using a stainless steel reactor heated to 300 °C (ΔT = 5 °C min−1). The samples were held at 300 °C for 30 minutes with a final backpressure of H2 in the reactor reaching ∼70 bar H2. The samples were then cooled to room temperature. In total, six different weight percentages of LiBH4 (12.78, 22.50, 26.13, 32.55, 33.95 and 35.05 wt%) were melt-infiltrated into the porous Mg scaffolds. All samples were in a pellet form unless described otherwise. Bulk LiBH4 and LiBH4/MgH2 with a 2![[thin space (1/6-em)]](https://www.rsc.org/images/entities/char_2009.gif) :
:![[thin space (1/6-em)]](https://www.rsc.org/images/entities/char_2009.gif) 1 molar ratio were used as reference materials. The bulk LiBH4/MgH2 powder was prepared by ball milling LiBH4 and MgH2 using identical experimental milling conditions as previously mentioned (Table 1).
1 molar ratio were used as reference materials. The bulk LiBH4/MgH2 powder was prepared by ball milling LiBH4 and MgH2 using identical experimental milling conditions as previously mentioned (Table 1).
| Description | Sample ID |
|---|---|
| Porous Mg + 12.78 wt% LiBH4 | PMg13 |
| Porous Mg + 22.50 wt% LiBH4 | PMg23 |
| Porous Mg + 26.13 wt% LiBH4 | PMg26 |
| Porous Mg + 32.55 wt% LiBH4 | PMg33 |
| Porous Mg + 33.95 wt% LiBH4 | PMg34 |
| Porous Mg + 35.05 wt% LiBH4 | PMg35 |
| Bulk 2LiBH4:MgH2 molar ratio pellet form | Bulk pellet |
| Bulk 2LiBH4:MgH2 molar ratio powder form | Bulk powder |
| Porous Mg crushed then melt-infiltrated with 2LiBH4:Mg molar ratio | Bulk Mg:2LiBH4 |
| Bulk LiBH4 | Bulk LiBH4 |
2.2 Sample characterisation
Powder X-ray diffraction (XRD) was used for the phase analysis and phase observations of all samples utilising a Bruker D8 Advanced diffractometer with CuKα radiation. The measured 2θ range (15–80°) was scanned using a 0.03° step size at 1.6 s per step, a rotational speed of 30 rpm and a 0.3° divergence slit. The accelerating voltage and applied current were 40 kV and 40 mA, respectively. Phase identification was accomplished by the EVA software (by Bruker) that uses as a database the Powder Diffraction Files (PDF) cards of the International Centre for Diffraction Data. The low background Si wafer XRD sample holders used were covered with a poly(methylmethacrylate) (PMMA) airtight hemispherical dome to prevent oxygen/moisture contamination during data collection. The PMMA airtight dome results in a broad hump in XRD patterns centred at ∼20° 2θ. Due to the specimen mounting, all samples are ∼1 mm higher than the centre of the goniometer, resulting in a 2θ offset to all peak positions. In order to investigate the formation of MgB2 in the infiltrated samples, Rietveld refinement was conducted using TOPAS Ver.5.34,35The specific surface area and the porosity of the Mg scaffold was analysed by nitrogen (N2) adsorption/desorption measurements performed at 77 K using a Micromeritics ASAP 3020 system (Micromeritics, Nor-cross, GA, USA). The specific surface area of the scaffold was calculated from the N2 adsorption data, at relative pressures between 0.05 and 0.30, by employing the Brunauer–Emmett–Teller (BET) multi-point method.36 The pore size distributions and volumes in the macro- (>50 nm) and meso-range (2–50 nm) were calculated using the Barrett–Joyner–Halenda (BJH) method from the desorption branch of the isotherm.37
The specific surface area was also investigated by Small-Angle X-ray Scattering (SAXS) with measurements conducted at the Australian Synchrotron. The measured intensities were put onto an absolute scale by use of a glassy carbon standard, scaled by the specimen thickness,38 and an empty capillary subtracted as background. The scattering pattern was modelled with the unified model39 in Irena,40 and the Porod40 slope extracted for the low and mid-q regions. The unified model is applied in order to describe scattering from complex systems that contain multiple levels of related structural features. The extracted Porod slope for the low and mid-q regions provides information about the size and shape of the scattering particles, in this case the pores and their correlations. The specific surface area, σ(r), was calculated following the approach of Hurd (eqn (4)) with the size of the probe used (r) was 21 Å.41 This value of r is the transition size for surface fractals to Porod scattering.42
 | (4) |
S(r) is the area of fractal surface and is equal to S(r) = Sxr2−D, where Sx is a sample-dependent prefactor, D is the surface fractal dimension, V is the volume under consideration and ρ0 is the density of the Mg.
σx which was calculated using eqn (5), as seen bellow.
 | (5) |
Morphological observations were carried out with a Zeiss Neon 40EsB (Zeiss, Germany) scanning electron microscope (SEM). Specimens were prepared by placing an extracted piece from the inner centre of the pellet onto carbon tape before coating them with a 3 nm layer of platinum to produce a conductive layer and reduce charging during SEM data collection. The exposure of the samples to air was minimised by using a custom made ante chamber in which the specimens were transferred from the glovebox to the coating instrument and then to the SEM chamber.
Temperature Programmed Desorption (TPD) measurements were undertaken on a computer controlled Sieverts/volumetric apparatus.43 The sample temperature and pressure was recorded every 30 s using a K-type thermocouple with a calibrated accuracy of 0.1 °C at 419 °C and a digital pressure transducer (Rosemount 3051S) with a precision/accuracy of 14 mbar. Hydrogen desorption data was obtained in the temperature range from room temperature to 550 °C with a ramping rate of 5 °C min−1. The temperature was then kept isothermal at 550 °C for 4 hours. Four TPD measurements were applied for the LiBH4 melt-infiltrated samples under 0, 1, 2 and 3.4 bar of H2 backpressure, respectively. Whereas, TPD experiments for the bulk samples were applied under 0 bar of H2 backpressure.
3. Results and discussion
3.1 Initial phase analysis
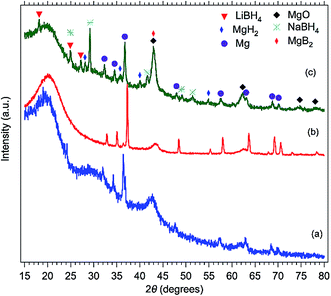
The X-ray diffraction pattern of the as-prepared porous Mg scaffold is presented in Fig. 1(a). It can be seen that the NaMgH3 was completely decomposed to Mg (JCPD 35-0821) after the sintering process. According to the literature NaMgH3 decomposes in two reaction steps as presented below.44–48| NaMgH3 → NaH + Mg + H2 | (6) |
| NaH + Mg → Na(l) + Mg + ½H2 | (7) |
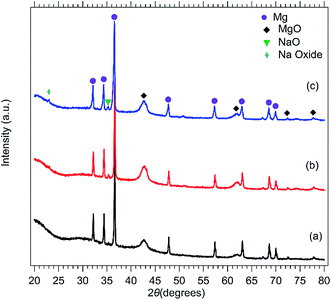 | ||
| Fig. 1 XRD patterns of (a) the as-prepared porous Mg scaffold, (b) porous Mg scaffold after blank infiltration, (c) crushed porous Mg scaffold after blank infiltration. | ||
The first reaction step (eqn (6)) takes place at 371 °C at 1 bar of H2 back pressure.48 It is expected that when dynamic vacuum is applied, this reaction will take place at lower temperature than 371 °C. According to the literature eqn (7) occurs at 427 °C at 1 bar of H2 back pressure48 in which NaH decomposes to Na metal and H2 (eqn (5)).49–53 Na has a vapour pressure of 0.001 bar when it is in a molten state at 450 °C.54,55 Hence, the vacuum applied during the sintering process, ∼1.33 × 10⁻⁵ bar, was low enough in order for the molten Na to be vaporised and removed from the main body of the pellet. The Na vapour was then captured in a cooler part of the reactor with steel wool.
The mass of the pellet on average after sintering was 1.9% higher than the theoretical value calculated by assuming the Na and H2 were completely removed from the initial NaMgH3 pellet. This difference in the mass values may be due to the fact that the molten Na was not entirely removed from the initial pellet, even though diffraction peaks attributable to metallic Na are not present in Fig. 1 or due to the fact that the sample is not entirely pure as the starting material (NaMgH3) contains impurities. The non-presence of Na peaks in Fig. 1 may be due to the fact that it is in low quantity, therefore not detectable by X-ray diffraction or/and it is in a nanocrystalline phase. The broad peaks that correspond to MgO (JCPD 45-0946) are due to the impurities from the starting material.44
An obvious concern was that the porous Mg will form MgH2 under the temperature and H2 pressure required for the melt-infiltration of LiBH4. Thus, in order to confirm that the porous Mg scaffold will not form MgH2 while the melt-infiltration conditions of LiBH4 are applied (300 °C, initial 60 bar H2), a blank infiltration test was carried out. The diffraction pattern of the porous Mg scaffold after the blank infiltration is presented in Fig. 1(b). No diffraction peaks of MgH2 were present. In order to further investigate that there is no formation of MgH2 also in the inner parts of the porous Mg scaffold away from its surface, the sample was crushed into a powder and further analysed (Fig. 1(c)). No diffraction peaks of MgH2 were present in this pattern either. According to Bogdanović et al. in order to rehydrogenate a sintered Mg sample, high temperatures (450–500 °C) and pressures (100–110 bar H2) are required.56 Thus, the infiltration conditions applied did not kinetically favour the formation of MgH2. Moreover, the formation of MgH2 would have resulted in a volume expansion of the Mg pellet due to its transformation to MgH2. This would have resulted in the disintegration/decrepitation of the porous Mg scaffold. Such observation was not noted after the blank infiltration test. Therefore, the structural integrity of the porous Mg scaffold acted as an initial confirmation of the non-formation of MgH2. Diffraction peaks that correspond to Na oxide and NaOH (JCPD 01-075-0642) which are present in both patterns Fig. 1(b and c) are impurities from the starting material (NaMgH3).44
Fig. 2 shows the diffraction patterns of the melt-infiltrated samples in a pellet form with different wt% of LiBH4. Fig. 2(a and b) represent the diffraction pattern of a pellet with 12.78 and 22.50 wt% of infiltrated LiBH4 respectively. Only peaks that correspond to Mg and MgO are present in Fig. 2(a). The lack of LiBH4 peaks in both Fig. 2(a) and (b) indicates that the complex metal hydride has penetrated the surface of the scaffold during the infiltration process and has occupied the inner pores of the scaffold or that if it is present at the surface of the pellet that it is either amorphous or nanocrystalline. In Fig. 2(b) small diffraction peaks of MgH2 are present. The XRD pattern of the sample with the highest wt% of infiltrated LiBH4 (32.55 wt%) exhibits diffraction peaks that correspond to LiBH4 (JCPD 04-011-3748), NaBH4(JCPD 04-012-3346), MgH2 (JCPD 12-0697) and MgB2 (JCPD 04-010-6469). The LiBH4 that has been infiltrated in this sample is close to the maximum amount that can be infiltrated (35.68 wt% of LiBH4) without exceeding the pore volume of the scaffold, (the value of which is mentioned in the pore analysis section of the manuscript). Thus, the concentration of LiBH4 is high enough at the surface to be observed with X-ray diffraction. The formation of NaBH4 is due to the partial reaction of residual Na with the LiBH4 at high temperatures.57 MgB2 is present either due to the partly decomposition of the complex metal hydride during the infiltration process, even though the appropriate pressure of H2 was applied, in order to avoid the decomposition reaction, or that the H2 backpressure was not high enough to stop the reaction between LiBH4 and Mg to form MgB2. Lastly, even though there was no MgH2 formation observed during the blank infiltration process of the Mg scaffold, MgH2 is present in Fig. 2(c). This comes in contrast to the previous observation, suggesting that LiBH4 acts as a catalyst for the formation of MgH2 during the melt-infiltration process.
In order to compare the surface composition of the infiltrated pellets with their interior, XRD patterns were obtained from the same samples after they were crushed into a powder (Fig. 3). The XRD pattern of PMg13, Fig. 3(a), shows only Mg and MgO diffraction peaks as the amount of infiltrated LiBH4 (12.78 wt%) and its low X-ray scattering power make it difficult to detect. Diffraction peaks of LiBH4, MgH2, and NaBH4 are present in samples PMg23 and PMg33 (Fig. 3(a and b)). The XRD pattern of the crushed sample PMg33 has been analysed by the Rietveld refinement method in order to investigate the formation of MgB2, as MgO and MgB2 have overlapping peaks at 2θ equal to ∼43° (Fig. S1†). Moreover, in order to investigate the formation of MgH2 of the melt-infiltrated samples, an X-ray diffraction pattern (Fig. 3(d)) of a crushed Mg pellet that was melt-infiltrated (at 300 °C under 60 bar H2) with LiBH4 in a 2![[thin space (1/6-em)]](https://www.rsc.org/images/entities/char_2009.gif) :
:![[thin space (1/6-em)]](https://www.rsc.org/images/entities/char_2009.gif) 1 molar ratio of LiBH4:Mg was obtained. Diffraction peaks of LiBH4 and NaBH4 are present in this particular sample (Fig. 3(d)) but no formation of MgH2 is evident in the same sample. This observation implies that the formation of MgH2 only occurs due to the intimate contact between porous Mg and the infiltrated LiBH4 and that a 2
1 molar ratio of LiBH4:Mg was obtained. Diffraction peaks of LiBH4 and NaBH4 are present in this particular sample (Fig. 3(d)) but no formation of MgH2 is evident in the same sample. This observation implies that the formation of MgH2 only occurs due to the intimate contact between porous Mg and the infiltrated LiBH4 and that a 2![[thin space (1/6-em)]](https://www.rsc.org/images/entities/char_2009.gif) :
:![[thin space (1/6-em)]](https://www.rsc.org/images/entities/char_2009.gif) 1 molar ratio of LiBH4:Mg is insufficient for LiBH4 to act as a catalyst for the hydriding of Mg.
1 molar ratio of LiBH4:Mg is insufficient for LiBH4 to act as a catalyst for the hydriding of Mg.
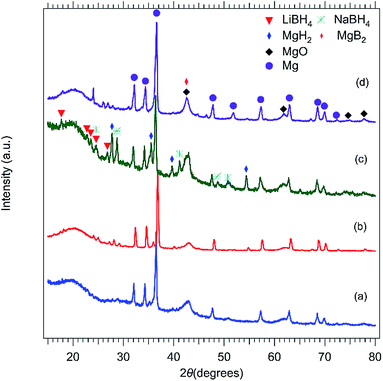 | ||
| Fig. 3 XRD patterns of (a) PMg13, (b) PMg23, (c) PMg33 and (d) bulk 2LiBH4/Mg. All (a) to (c) samples have been crushed into a powder form. | ||
3.2 Pore analysis of Mg scaffold
The N2 adsorption/desorption isotherms of the as-prepared porous Mg scaffold is presented in Fig. 4(a). The isotherms belong to a type II with a H3 type hysteresis loop which is associated with samples having large mesoporous and macroporous.58 The isotherms show no knee at low relative pressures that indicates an extremely weak adsorbate–adsorbent interaction that is representative for samples with no micropores present. In Fig. 4(c) the pore size distribution of the scaffold is presented. It can be seen that the pores present in the scaffold are polydisperse. This observation is in agreement with the SEM micrographs (Fig. 6(a and b)) and the possible reasons for this existing variability is mentioned in more details in the SEM section of this manuscript. It is noticeable that pores with diameters ranging from 1.7 to 3.6 nm form the larger proportion, whereas larger pores ranging between 28–45 nm in diameter have a smaller proportion in the scaffold as a whole. The total pore volume of the scaffold is 1.25 cm3 g−1, including the volume of the voids which were created during the compaction of the starting powder (NaMgH3) into a pellet and it is equal to ∼0.42 cm3 g−1. This volume was calculated using the crystal density of NaMgH3 and also the physical (bulk) density of the pellet derived from its physical dimensions. The volume due to the micropores and mesopores with diameter within the range of 1.7–48 nm as calculated from the BJH method (Table 2) is equal to 0.06 cm3 g−1. Finally, the remaining volume is due to the macropores greater than 50 nm in size which are present in the scaffold. The BET surface area of the scaffold is 26.05(1) m2 g−1.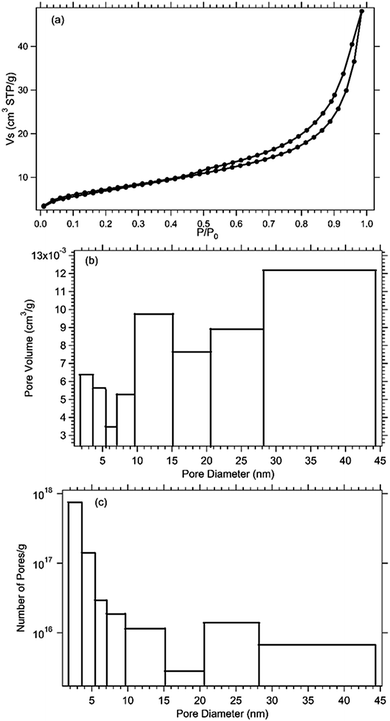 | ||
| Fig. 4 (a) N2 adsorption/desorption isotherm (b) pore volume distribution diagram and (c) pore size distribution diagram of the of the porous Mg scaffold. | ||
| Sample | Specific surface area (BET) (m2 g−1) | Specific surface area (SAXS) (m2 g−1) | Pore volume due to mesopores (cm3 g−1) | Pore volume due to macropores (cm3 g−1) | Pore volume due to voids (cm3 g−1) | Total pore volume (cm3 g−1) |
|---|---|---|---|---|---|---|
| Porous Mg scaffold | 26.05(1) | 39(5) | 0.06 | 0.77 | 0.42 | 1.25 |
According to SAXS analysis, the average Porod slope in the low and mid q ranges was 3.31, indicating that the pores in the pellet formed a surface fractal (Fig. 5(a)). The surface fractal dimension was D = 2.69 and r = 21 Å. The value of r (r = 2π/q) was calculated using q = 0.31 Å−1, which is the value for the transition from power-law 3.31 to 4. A plot of Iq3.31 vs. q, shown in Fig. 5(b), shows a plateau at q = 0.21 Å−1, with lim(Iq3.31) = 2.06 × 1024 cm−4.31. F(D) was equal to 1.77, (Δρ)2 was equal to 2.13 × 1022 cm−4 and ρ0 was equal to the crystal density of Mg that is 1.75 g cm−3. Substituting these values into the equation of Hurd41 (eqn (4)) to allow for a direct comparison with the BET results, yields a specific surface area of 39(5) m2 g−1. This value was observed to be larger than the BET value, as this surface area also includes closed porosity.
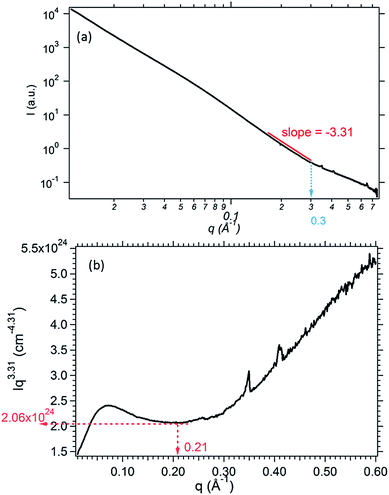 | ||
| Fig. 5 SAXS data plotted (a) log(I) versus log(q) and (b) Iq3.31 versus q of the porous Mg scaffold after 3 h of sintering at 450 °C under dynamic vacuum. | ||
The SEM micrographs of the as-prepared porous Mg scaffold are presented in Fig. 6(a and b). The pores have a broad range of sizes and are mainly macropores. This observation was also confirmed by the N2 adsorption/desorption isotherms and the applied BJH method of this particular sample. The Mg scaffold has an open porous network structure similar to a sponge. The walls of the solid Mg that form the pores are thin which makes it easier for the H2 to diffuse through them when the pores are occupied with LiBH4 during its thermal decomposition. The voids (1–2 μm), have been created during the compaction of the NaMgH3 powder into a pellet. The macropores present in the scaffold may have been created from the molten sodium evaporating due to the applied dynamic vacuum during the sintering process. Finally, the mesopores present in the scaffold may have been formed during the desorption of H2 while the NaMgH3 pellet was heated under dynamic vacuum. The small number of mesopores may in part, be due to the fact that the H2 is diffused first at lower temperatures compared to molten Na. Thus, once the H2 is desorbed from the main body of the pellet, the system has enough time to reform the pore structure as the final temperature has not been reached and the Na present is starting to become molten. Therefore, more sintering experiments with various H2 backpressures are required in order to investigate the formation of the pores. The delay of H2 desorption during the sintering of the NaMgH3 pellet will result in the presence of more mesopores present in the scaffold.
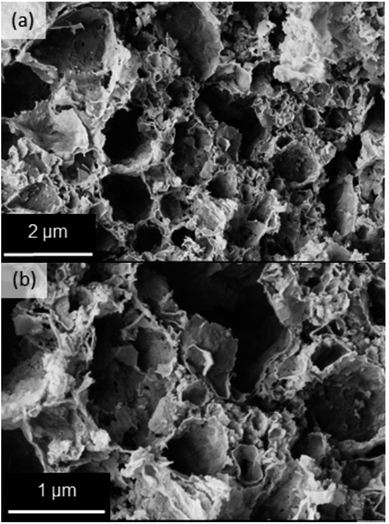 | ||
| Fig. 6 SEM micrographs of the as-prepared porous Mg scaffold with two different magnifications (a) low and (b) high magnification. | ||
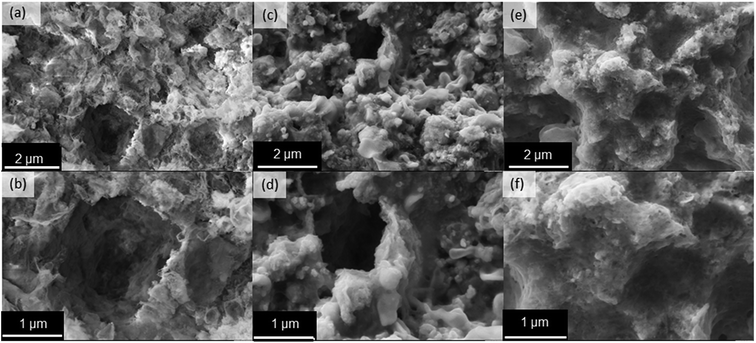
Fig. 7 shows the SEM micrographs of the porous Mg scaffolds infiltrated with 12.78, 22.50 and 32.55 wt% of LiBH4 respectively. It is noticeable that the complex metal hydride first occupies the smaller pores (mesopores) via capillary condensation as seen in Fig. 6(a and b). As the amount of the infiltrated LiBH4 increases, the larger pores get occupied with the complex metal hydride (Fig. 7(c and d)). Lastly, Fig. 7(e and f) represents the porous Mg scaffold that has been infiltrated with the highest amount of LiBH4. It can be seen that the complex metal hydride has infiltrated all the pores present in the sample creating a solid pellet.
3.3 Thermal analysis
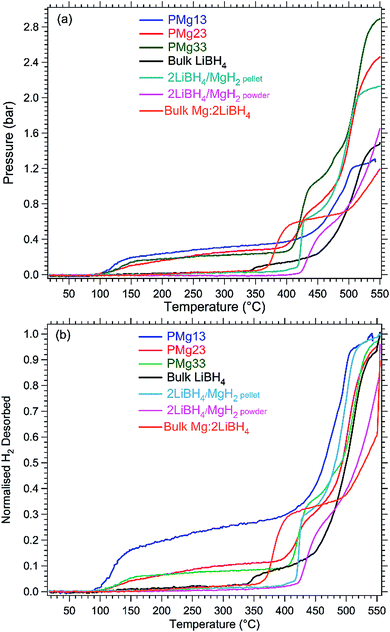
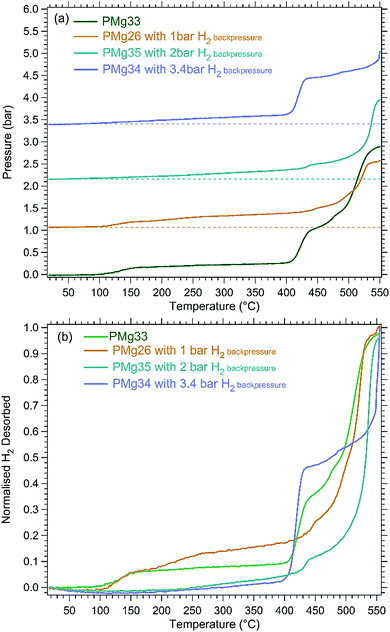
The TPD curves off the melt-infiltrated as well as the bulk samples are presented in Fig. 8 and 9. In Fig. 8(b) and 9(b) the H2 wt% has been normalised to the amount of desorbed H2 for each sample in order for results to be easily comparable. In Fig. 8(a) it is noticeable that the samples PMg13, PMg23 and PMg33 start desorbing H2 at 100 °C. According to our knowledge, such, a result has not be reported in the literature so far. There is no H2 desorption detected for the bulk samples at that temperature range (Bulk LiBH4, Bulk pellet, Bulk powder, Bulk 2LiBH4:Mg). This behaviour is attributed to the LiBH4 melt-infiltrated into the mesopores of the Mg scaffold. The infiltrated complex metal hydride in the pores is not only nanoconfined, but also destabilised by the presence of the Mg and MgH2. The volume created by the mesopores in each sample is the same. Thus, the amount of the desorbed H2 in all three samples at the temperature range of 100 to 420 °C is the same (Fig. 8(a)). As the temperature increases, it can be seen that PMg23 and PMg33 have the same desorption profiles as the bulk samples. This observation is due to the fact that once the infiltrated LiBH4 for these samples has occupied all the mesopores, it then starts to enter the macropores and voids of the scaffold. Therefore, the complex metal hydride at these macro sizes behaves as a bulk material and has the same H2 desorption properties as the bulk samples. In contrast, the sample with the least amount of infiltrated LiBH4 (PMg13) has a different H2 desorption profile which is due to the fact that the amount of LiBH4 contained in that scaffold occupies only the pores in the mesoporous range. This particular sample has desorbed 35% of its H2 wt% at 400 °C whereas the bulk pellet and bulk powder at that temperature is 0.Moreover, bulk LiBH4 starts desorbing H2 after its melting point at 350 °C whereas when it is mixed with MgH2 the desorption takes place at 430 °C. According to the literature at high temperatures and low pressures, LiBH4 and MgH2 simultaneously decompose and form MgB2.16 Therefore, the decomposition of LiBH4 at 350 °C is inhibited and it only takes place at higher temperatures. Lastly, bulk Mg:2LiBH4 sample starts desorbing H2 at 350 °C similar to bulk LiBH4. As there is no MgH2 present in this sample, MgB2 is formed simultaneously when LiBH4 starts to decompose. Hence, the temperature for this reaction is at 350 °C, as for bulk LiBH4.
Fig. 10 shows the experimental, as well as the theoretical, H2 wt% of all samples that have been desorbed up to 550 °C. For the samples for which the desorption started at 0 bar of H2 backpressure, the experimental and theoretical values are the same, taking into account the further decomposition of LiH (eqn (8)).
 | (8) |
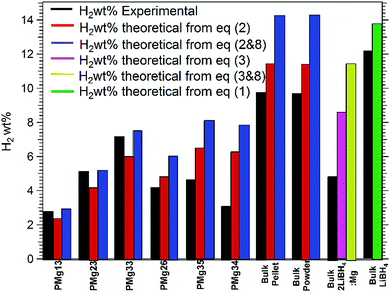 | ||
| Fig. 10 Diagram representing the values of the theoretical as well as experimental H2 wt% for all samples at 550 °C. | ||
LiH can further decompose at temperatures above 500 °C, as the presence of excess Mg present from the porous scaffold is able to further react with the LiH formed from the first decomposition pathway. These samples exhibited high desorbed H2 wt% (PMg23 = 5.09 H2 wt%, PMg33 = 7.12 H2 wt%) reaching the targets set by the U.S. Department of Energy,6 which makes them promising candidates for on-board hydrogen storage in vehicles run by fuel cells.
The samples for which their decomposition took place under 1, 2, and 3.4 bar of H2 backpressure, the experimental value of the H2 wt% is smaller than the theoretical ones derived from eqn (2). The reason for this observation is due to the fact that the kinetics of this reaction slowed down as the H2 backpressure increased (Fig. S3†). Finally, the experimental desorbed H2 wt% of all bulk samples are smaller than the theoretical ones as the formed agglomerations in the metal hydrides hindered the kinetics of the reaction and also the presence of Mg in the sample was not enough to further decompose the LiH. A table of all the values of the desorbed H2 wt% as well as maximum pressures observed and temperatures are in Table S1 in the ESI.†
In Fig. 11 the diffraction patterns of all samples after their TPD experiments are presented. All samples were crushed from a pellet to a powder in order to obtain a more comprehensive phase analysis from the entire sample. The diffraction patterns of the PMg13 and PMg23 (Fig. 8(a and b)) show only diffraction peaks corresponding to Mg, MgO, MgB2, and LiMg. The H2 has been completely desorbed and no evidence of LiH, or partially unreacted MgH2 is present in the sample. These observations also confirm the value of the calculated experimental H2 wt% which is due to eqn (2) and (3) and matches the theoretical H2 wt% calculated for eqn (8). The diffraction pattern of PMg33 has MgH2 diffraction peaks, suggesting that during the cooling of the sample, a small amount of H2 was reabsorbed from the Mg scaffold to form MgH2. The experimental value of the desorbed H2 wt% for this sample is slightly smaller than the theoretical one derived from eqn (6). This indicates that the MgH2 present in the sample should have been completely desorbed when the sample was reached 550 °C and the remaining MgH2 could only be formed during reabsorption while cooling down. The presence of LiH in this particular sample indicates that the further decomposition of LiH was incomplete, which is indicative of the slight mismatch of the experimental and theoretical value (from eqn (6)) of desorbed H2 wt%. The diffraction patterns of the bulk samples show both MgH2 and LiH, which is due to the incomplete reaction of eqn (2), explains the lower experimental values of their desorbed H2 wt% in comparison to the theoretical values.
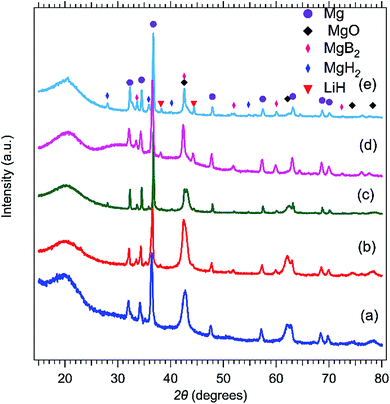 | ||
| Fig. 11 XRD patterns of (a) PMg13, (b) PMg23, (c) PMg33 (d) bulk 2LiBH4/MgH2 in a form of a powder and (e) pellet after TPD experiments conducted under 0 bar of H2 backpressure. | ||
Fig. 12 shows the diffraction patterns of all samples that were infiltrated with the highest amount of LiBH4 and were desorbed under different values of H2 backpressures. For the samples PMg33 and PMg26, the amount of LiH present in the samples is almost undetectable due to the small amount of LiH, as well as its low scattering power. The presence of LiH and MgH2 is more evident in the diffraction patterns of the samples PMg33 and PMg35 that were desorbed with starting H2 back pressures at 2 and 3.4 bar respectively. The kinetics of eqn (2) were slower in comparison to the ones of the samples that were desorbed at lower H2 backpressures (0 and 1 bar of H2) therefore the amount of MgH2 and LiH are higher and therefore easier to detect.
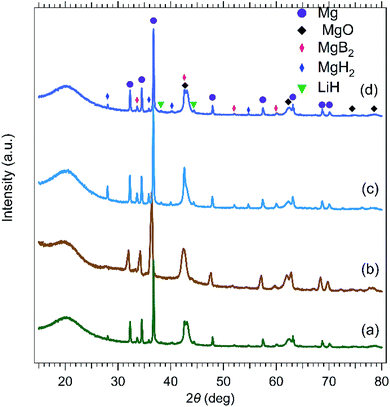 | ||
| Fig. 12 XRD patterns of (a) PMg33, (b) PMg26, (c) PMg34 and (d) PMg35 after TPD experiments which were performed under 0, 1, 2 and 3.4 bar of H2 backpressure respectively. | ||
4. Conclusion
A porous Mg scaffold was synthesised using a cost effective method by sintering a NaMgH3 pellet under dynamic vacuum. The created scaffold consisted of pores in the meso and macro range as seen from SEM micrographs and the BJH analysis. The pores were created by the desorption of H2 and the evaporation of Na. The diffraction pattern after the sintering, showed that the scaffold is composed of Mg. SEM micrographs, as well as diffraction analysis of the infiltrated samples confirmed that the LiBH4 entered the pores of the scaffold by first occupying the smaller pores, followed by the larger ones. The Temperature Programmed Desorption measurements of all samples showed that the infiltrated samples started desorbing H2 at 100 °C which is 250 °C lower than the accepted temperature the bulk LiBH4 and 330 °C lower than the accepted temperature for bulk 2LiBH4–MgH2. PMg13 desorbed 35% of its total value of H2 below the melting point of LiBH4 (350 °C). The PMg33 sample exhibited enhanced hydrogen storage properties (7.12 H2 wt%) and exceeded the targets set by the U.S. Department of Energy (5.5 H2 wt%). Further improvements have to be made regarding the synthesis process of the porous Mg scaffold in order to increase the number of mesopores. This will allow the LiBH4 melt-infiltrated samples to not only desorb H2 at 100 °C or less, but also to reach and hopefully exceed the 5.5 H2 wt% target, making them ideal candidates for on-board hydrogen storage in automobile applications. Lastly, the reversibility of the LiBH4 melt-infiltrated samples needs to be investigated by rehydrogenating the samples under various H2 backpressures and temperatures.Acknowledgements
The authors CEB, DAS and MVS acknowledge the financial support of the Australian Research Council for ARC Discovery grant DP150101708. The author DAS acknowledge the financial support of a Curtin University's Postdoctoral Research Fellowship. The authors acknowledge the facilities and technical assistance of the Microscopy & Microanalysis Facility of the John de Laeter Centre at Curtin University. CEB acknowledges the financial support of the Australian Research Council for ARC LIEF grants LE0775551 and LE0989180 which enabled the XRD and TPD measurements to be undertaken. The authors would like to thank the project team of the Small Angle X-ray Scattering at the Australian Synchrotron.References
- L. Schlapbach and A. Züttel, Nature, 2001, 414, 353–358 CrossRef CAS PubMed.
- A. Züttel, A. Remhof, A. Borgschulte and O. Friedrichs, Philos. Trans. R. Soc., A, 2010, 368, 3329–3342 CrossRef PubMed.
- K. Hirose, Philos. Trans. R. Soc., A, 2010, 368, 3365–3377 CrossRef CAS PubMed.
- M. B. Ley, L. H. Jepsen, Y.-S. Lee, Y. W. Cho, J. M. Bellosta von Colbe, M. Dornheim, M. Rokni, J. O. Jensen, M. Sloth, Y. Filinchuk, J. E. Jørgensen, F. Besenbacher and T. R. Jensen, Mater. Today, 2014, 17, 122–128 CrossRef CAS.
- M. Meggouh, D. M. Grant and G. S. Walker, J. Phys. Chem. C, 2011, 115, 22054–22061 CAS.
- Energy.Gov, Office of Energy Efficiency & Renewable Energy, http://energy.gov/eere/fuelcells/hydrogen-storage, accessed 13/7/2016.
- A. Züttel, P. Wenger, S. Rentsch, P. Sudan, P. Mauron and C. Emmenegger, J. Power Sources, 2003, 118, 1–7 CrossRef.
- S. Cahen, J. B. Eymery, R. Janot and J. M. Tarascon, J. Power Sources, 2009, 189, 902–908 CrossRef CAS.
- J. J. Vajo, F. Mertens, C. C. Ahn, R. C. Bowman and B. Fultz, J. Phys. Chem. B, 2004, 108, 13977–13983 CrossRef CAS.
- J. Yang, A. Sudik and C. Wolverton, J. Phys. Chem. C, 2007, 111, 19134–19140 CAS.
- S.-A. Jin, J.-H. Shim, Y. W. Cho, K.-W. Yi, O. Zabara and M. Fichtner, Scr. Mater., 2008, 58, 963–965 CrossRef CAS.
- U. Bösenberg, S. Doppiu, L. Mosegaard, G. Barkhordarian, N. Eigen, A. Borgschulte, T. R. Jensen, Y. Cerenius, O. Gutfleisch, T. Klassen, M. Dornheim and R. Bormann, Acta Mater., 2007, 55, 3951–3958 CrossRef.
- J. J. Vajo and G. L. Olson, Scr. Mater., 2007, 56, 829–834 CrossRef CAS.
- J. A. Puszkiel and F. C. Gennari, Scr. Mater., 2009, 60, 667–670 CrossRef CAS.
- J. J. Vajo, S. L. Skeith and F. Mertens, J. Phys. Chem. B, 2005, 109, 3719–3722 CrossRef CAS PubMed.
- U. Bösenberg, D. B. Ravnsbæk, H. Hagemann, V. D'Anna, C. B. Minella, C. Pistidda, W. van Beek, T. R. Jensen, R. Bormann and M. Dornheim, J. Phys. Chem. C, 2010, 114, 15212–15217 Search PubMed.
- T. E. Price, D. M. Grant, D. Weston, T. Hansen, L. M. Arnbjerg, D. B. Ravnsbaek, T. R. Jensen and G. S. Walker, J. Am. Chem. Soc., 2011, 133, 13534–13538 CrossRef CAS PubMed.
- J. F. Mao, Z. Wu, T. J. Chen, B. C. Weng, N. X. Xu, T. S. Huang, Z. P. Guo, H. K. Liu, D. M. Grant, G. S. Walker and X. B. Yu, J. Phys. Chem. C, 2007, 111, 12495–12498 CAS.
- B. R. Hansen, D. B. Ravnsbaek, J. Skibsted and T. R. Jensen, Phys. Chem. Chem. Phys., 2014, 16, 8970–8980 RSC.
- F. E. Pinkerton, M. S. Meyer, G. P. Meisner, M. P. Balogh and J. J. Vajo, J. Phys. Chem. C, 2007, 111, 12881–12885 CAS.
- J. Puszkiel, F. C. Gennari, P. Arneodo Larochette, H. E. Troiani, F. Karimi, C. Pistidda, R. Gosalawit-Utke, J. Jepsen, T. R. Jensen, C. Gundlach, M. Tolkiehn, J. Bellosta von Colbe, T. Klassen and M. Dornheim, J. Power Sources, 2014, 267, 799–811 CrossRef CAS.
- R. Gosalawit-Utke, C. Milanese, T. K. Nielsen, F. Karimi, I. Saldan, K. Pranzas, T. R. Jensen, A. Marini, T. Klassen and M. Dornheim, Int. J. Hydrogen Energy, 2013, 38, 1932–1942 CrossRef CAS.
- R. Gosalawit-Utke, T. K. Nielsen, I. Saldan, D. Laipple, Y. Cerenius, T. R. Jensen, T. Klassen and M. Dornheim, J. Phys. Chem. C, 2011, 115, 10903–10910 CAS.
- R. Gosalawit−Utke, T. K. Nielsen, K. Pranzas, I. Saldan, C. Pistidda, F. Karimi, D. Laipple, J. Skibsted, T. R. Jensen, T. Klassen and M. Dornheim, J. Phys. Chem. C, 2012, 116, 1526–1534 Search PubMed.
- R. Gosalawit-Utke, C. Milanese, P. Javadian, A. Girella, D. Laipple, J. Puszkiel, A. S. Cattaneo, C. Ferrara, J. Wittayakhun, J. Skibsted, T. R. Jensen, A. Marini, T. Klassen and M. Dornheim, J. Alloys Compd., 2014, 599, 78–86 CrossRef CAS.
- R. Gosalawit-Utke, C. Milanese, P. Javadian, J. Jepsen, D. Laipple, F. Karmi, J. Puszkiel, T. R. Jensen, A. Marini, T. Klassen and M. Dornheim, Int. J. Hydrogen Energy, 2013, 38, 3275–3282 CrossRef CAS.
- S. A. Al-Muhtaseb and J. A. Ritter, Adv. Mater., 2003, 15, 101–114 CrossRef CAS.
- H. P. Boehm, Carbon, 1994, 32, 759–769 CrossRef CAS.
- R. Fu, B. Zheng, J. Liu, S. Weiss, J. Y. Ying, M. S. Dresselhaus, G. Dresselhaus, J. Satcher and T. Baumann, J. Appl. Polym. Sci., 2004, 91, 3060–3067 CrossRef CAS.
- Y. Bi, Y. Zheng and Y. Li, Mater. Lett., 2015, 161, 583–586 CrossRef CAS.
- J. J. de Damborenea, M. A. Larosa, M. A. Arenas, J. M. Hernández-López, A. L. Jardini, M. C. F. Ierardi, C. A. C. Zavaglia, R. M. Filho and A. Conde, Mater. Des., 2015, 83, 6–13 CrossRef CAS.
- L. H. S. Gasparotto, A. Prowald, N. Borisenko, S. Z. El Abedin, A. Garsuch and F. Endres, J. Power Sources, 2011, 196, 2879–2883 CrossRef CAS.
- M. V. Sofianos, D. A. Sheppard, E. Ianni, T. D. Humphries, M. R. Rowles, S. M. Liu and C. E. Buckley, J. Alloys Compd., 2017, 702, 309–317 CrossRef.
- Y. Filinchuk, D. Chernyshov and R. Cerny, J. Phys. Chem. C, 2008, 112, 10579–10584 CAS.
- R. W. G. Wyckoff, in Cubic closest packed, ccp, structure, Interscience Publishers, New York, 2nd edn, 1963, pp. 7–83 Search PubMed.
- S. Brunauer, P. H. Emmett and E. Teller, J. Am. Chem. Soc., 1938, 60, 309–319 CrossRef CAS.
- E. P. Barrett, L. G. Joyner and P. P. Halenda, J. Am. Chem. Soc., 1951, 73, 373–380 CrossRef CAS.
- O. Spalla, S. Lyonnard and F. Testard, J. Appl. Crystallogr., 2003, 36, 338–347 CrossRef CAS.
- G. Beaucage, J. Appl. Crystallogr., 1995, 28, 717–728 CrossRef CAS.
- J. Ilavsky and P. R. Jemian, J. Appl. Crystallogr., 2009, 42, 347–353 CrossRef CAS.
- A. J. Hurd, D. W. Schaefer, D. M. Smith, S. B. Ross, A. Le Méhauté and S. Spooner, Phys. Rev. B: Condens. Matter Mater. Phys., 1989, 39, 9742–9745 CrossRef.
- G. Beaucage, J. Appl. Crystallogr., 1996, 29, 134–146 CrossRef CAS.
- A.-L. Chaudhary, M. Paskevicius, D. A. Sheppard and C. E. Buckley, J. Alloys Compd., 2015, 623, 109–116 CrossRef CAS.
- D. A. Sheppard, M. Paskevicius and C. E. Buckley, Chem. Mater., 2011, 23, 4298–4300 CrossRef CAS.
- K. Ikeda, Y. Kogure, Y. Nakamori and S. Orimo, Scr. Mater., 2005, 53, 319–322 CrossRef CAS.
- H. Reardon, N. Mazur and D. H. Gregory, Prog. Nat. Sci.: Mater. Int., 2013, 23, 343–350 CrossRef.
- S. Abdessameud, M. Mezbahul-Islam and M. Medraj, Sci. World J., 2014, 2014, 1–16 CrossRef PubMed.
- D. Pottmaier, E. R. Pinatel, J. G. Vitillo, S. Garroni, M. Orlova, M. D. Baró, G. B. M. Vaughan, M. Fichtner, W. Lohstroh and M. Baricco, Chem. Mater., 2011, 23, 2317–2326 CrossRef CAS.
- C. P. Balde, H. A. Stil, A. M. J. vanderEerden, K. P. deJong and J. H. Bitter, J. Phys. Chem. C, 2007, 111, 2797–2802 CAS.
- M. Felderhoff, K. Klementiev, W. Grünert, B. Spliethoff, B. Tesche, J. M. Bellosta von Colbe, B. Bogdanovi, M. Hrtel, A. Pommerin, F. Schüth and C. Weidenthaler, Phys. Chem. Chem. Phys., 2004, 6, 4369–4374 RSC.
- A. G. Haiduc, H. A. Stil, M. A. Schwarz, P. Paulus and J. J. C. Geerlings, J. Alloys Compd., 2005, 393, 252–263 CrossRef CAS.
- T. D. Humphries, D. Birkmire, B. C. Hauback, G. S. McGrady and C. M. Jensen, Phys. Chem. Chem. Phys., 2013, 15, 6179–6181 RSC.
- T. D. Humphries, J. W. Makepeace, S. Hino, W. I. F. David and B. C. Hauback, J. Mater. Chem. A, 2014, 2, 16594–16600 CAS.
- D. M. Banus, J. J. McSharry and E. A. Sullivan, J. Am. Chem. Soc., 1955, 77, 2007–2010 CrossRef CAS.
- W. Klostermeier and E. U. Franck, Ber. Bunsenges. Phys. Chem., 1982, 86, 606–612 CrossRef CAS.
- B. Bogdanović, H. Hofmann, A. Neuy, A. Reiser, K. Schlichte, B. Spliethoff and S. Wessel, J. Alloys Compd., 1999, 292, 57–71 CrossRef.
- N. Bernstein, M. D. Johannes and K. Hoang, Phys. Rev. B: Condens. Matter Mater. Phys., 2013, 88, 2201021–2201025 CrossRef.
- L. Shaohua, B. Jingru, L. Hongpeng, J. Guojun and W. Qing, Oil Shale, 2010, 27, 135 CrossRef.
Footnote |
| † Electronic supplementary information (ESI) available. See DOI: 10.1039/c7ra05275h |
| This journal is © The Royal Society of Chemistry 2017 |

