
 Open Access Article
 This Open Access Article is licensed under a Creative Commons Attribution-Non Commercial 3.0 Unported Licence
Chemical vapor deposition graphene combined with Pt nanoparticles applied in non-enzymatic sensing of ultralow concentrations of hydrogen peroxide
Yawen Yuana,
Fuhua Zhanga,
Hua Wangb,
Jinglei Liub,
Yiqun Zhengb and
Shifeng Hou *b
*b
aSchool of Chemistry and Chemical Engineering, Shandong University, Jinan, 250100, PR China
bNational Engineering and Technology Research Center for Colloidal Materials, Shandong University, Jinan, 250100, PR China. E-mail: shifenghou@sdu.edu.cn; Fax: +86 531 88363180; Tel: +86 531 88362815
First published on 13th June 2017
Abstract
In this work, a glassy carbon electrode modified with Pt nanoparticles supported on chemical vapor deposition (CVD)-grown graphene (PtNPs/GR) was constructed and used to non-enzymatically detect ultralow concentrations of hydrogen peroxide. The application of in situ sputtering avoided not only the removal of surfactant from Pt nanoparticle surfaces, but also the complicated transfer of CVD-grown graphene. A PtNPs/GR free-standing film was fabricated by synergizing the good ductility of the CVD-grown graphene with the good dispersion and residual-free nature of the Pt nanoparticles. When compared with easily stacked and agglomerated powder graphene-supported Pt nanoparticles, the PtNPs/GR sensor with well-exposed active catalyst sites showed advantages in H2O2 detection. For example, the sensor showed a quick response of less than 3 s, and showed a lower detection limit (0.18 nM, S/N = 3) than did similar graphene-supported Pt nanoparticle materials. In addition, the preparation method involving CVD and sputtering allows for the large-scale production of this sensor and applications in practical electrochemical detection of hydrogen peroxide.
1. Introduction
The ability to sensitively detect hydrogen peroxide (H2O2) is essential in the environment, food and clinical fields, since H2O2 is an important oxidant, intermediate and by-product of some chemical reactions. Hence, effective detection of H2O2 is of great necessity for biological and chemical analysis.1,2 Many methods have been developed for this purpose in recent years, with these methods including chemiluminescence,3 spectrofluorimetry,4 chromatography,5 electrochemical methods,6 and so forth. Among them, electrochemical methods based on non-enzymatic detection of H2O2 have been widely studied due to their advantages in convenience, low cost and repeatability.7 The material components of H2O2 sensors have been modified to improve the electroactivity of H2O2 molecules with enhanced electron transfer kinetics for the purpose of obtaining multifunctional and more sensitive sensors. For example, metals and metal oxides nanoparticles, carbon nanomaterials, as well as dyes, polymers and their binary and ternary composites have been used to modify the solid electrodes of these sensors.8–12Recently, investigations of graphene-supported noble metal nanoparticles for non-enzymatic detection of H2O2 were reviewed owing to the development of graphene in the electrochemical field and due to the excellent catalytic performances of noble metal nanoparticles.13,14 Graphene is an essentially two-dimensional material consisting of a single layer of carbon atoms, and its resulting large specific surface area and remarkable electrical properties have resulted in its very considerable potential value in the electrochemical sensor field.15,16 In addition, the synergistic effects of graphene and noble metal nanoparticles, resulting from graphene stabilizing and supporting the noble metal nanoparticles while keeping most of their catalytic active sites exposed, have been indicated to effectively improve the electrocatalytic performances of the noble metal nanoparticles.17 Graphene-supported platinum (Pt) nanoparticle composites have attracted particular attention due to the excellent chemical stability, electroconductibility and high electrocatalytic efficiency of Pt nanoparticles.18–20
Nevertheless, graphene-supported Pt nanoparticle sensors still face some limitations. For example, processes such as mechanical exfoliation and chemical reduction methods used to prepare graphene can cause damage to the Pt nanoparticle crystals and re-stacking of the graphene layers.21 Due to the residual oxidized functional groups, the conductibility of graphene has been shown to decrease. Also, the process used to clean Pt nanoparticles is complicated since a surfactant is involved in their synthesis.22,23 Hence, it has been important to find a way to obtain high-quality graphene and to clean the surfaces of Pt nanoparticles in order to optimize their catalytic performance. The production of single-layer graphene using the chemical vapor deposition (CVD) method has been widely studied in the electrochemical field since this method has been shown to preserve the electronic and mechanical properties of graphene.24,25 But separating the CVD-produced graphene from the substrate and carrying out the subsequent transfer of the graphene are complicated processes, and this complication has hindered the practical use of CVD.26
In our work, we utilized a polymer-free transfer method combined with sputtering technology to obtain CVD-grown graphene in situ deposited with Pt nanoparticles, which were used to construct an electrochemical sensor of H2O2. This sensor showed enhanced electrocatalytic activity, which we attributed to various advantage of our method: the use of single-layer graphene as a platform avoided stacking and agglomeration of Pt nanoparticles and yielded a relatively high exposure of their catalytic active sites; the use of the sputtering process yielded uncontaminated Pt nanoparticle surfaces without requiring a cleaning process; and the graphene-supported Pt nanoparticle composite films were able to be free-standing after etching the growth substrate with no polymer involved to assist in the transfer. The graphene-supported Pt nanoparticle composite films were characterized, and cyclic voltammetry and amperometric curves were obtained to test the H2O2 detection ability of the sensor. Notably, the process of obtaining free-standing †graphene-supported Pt nanoparticle composite films without polymer-assisted transfer could find important potential use in industrial production and practical applications.
2. Experimental
Materials and methods
Copper (Cu) foils with thicknesses of 25 μm and 99.8% purity were bought from Alfa Aesar Company (Shanghai, China). Poly(methyl methacrylate) (PMMA, average molecular weight 97k) was purchased from Sigma-Aldrich Co. L.L.C. (Shanghai, China). Hydrogen (H2) and methane (CH4) gases with 99.99% purity were both purchased from Jinan Deyang Special Gas Company (Jinan, China). Reduced graphene oxide (rGO) powders were obtained from Leadernano Tech. L.L.C. (Jining, China). Hydrogen peroxide (H2O2) with a 30% mass fraction, acetone (CH3COCH3), acetic acid (CH3COOH), chlorobenzene (C6H5Cl), ammonium persulfate ((NH4)2S2O8), disodium hydrogen phosphate dihydrate (Na2HPO4·2H2O) and sodium dihydrogen phosphate dihydrate (NaH2PO4·2H2O) were purchased from Sinopharm Chemical Regent Company (Shanghai, China). Aluminium oxide (Al2O3) powders with diameters of 500 and 300 nm were bought from Shanghai ChenHua Instrument Company (Shanghai, China). A phosphate-buffered solution (0.1 mol L−1) containing NaH2PO4·2H2O and Na2HPO4·2H2O was used as the electrolyte. The 5% mass fraction PMMA solution was prepared by dissolving PMMA in chlorobenzene. All reagents used in the experiments were of analytical grade and used without further purification. The resistivity of the ultrapure water used was 18.2 MΩ cm.CVD equipment was purchased from Xicheng Company (G-CVD, Xiamen, China). A DESK V cold sputter unit was bought from Denton Vacuum Company (Moorestown, USA) with a platinum (Pt) target (99.999% purity) obtained from GRIKIN Advanced Material Company (Beijing, China). A spin coater (KW-4B) was bought from Institute of Microelectronics of Chinese Academy of Sciences (Beijing, China). The CHI-660C electrochemical workstation was bought from Shanghai ChenHua Instrument Company (Shanghai, China) with a standard three-electrode system. A platinum plate electrode served as a counter electrode, a saturated calomel electrode (SCE) was used as a reference electrode, and a glassy carbon electrode (GCE) was used as a working electrode after processing. All potentials in the experiments were applied versus SCE at room temperature.
The morphologies and structures of the samples were characterized using a transmission electron microscope (TEM, JEM-1011, Japan), Raman spectrometer (PHS-3C, Horbin, France) and X-ray photoelectron spectrometer (XPS, ThermoFisher K-Alpha, USA).
Preparation of PtNPs/GR
Monolayer graphene was synthesized using the low-pressure chemical vapor deposition (LPCVD) method as described in previous studies.27 First, Cu foils were ultrasonically cleaned using acetone and acetic acid, and dried using N2 at room temperature. Then, the cleaned Cu foils were loaded into a quartz tube with a diameter of 5 cm and heated to 1030 °C under an H2 atmosphere in a furnace. CH4 was added into the reaction chamber at the 1030 °C temperature and kept at this temperature for 30 minutes, after which the furnace was moved away and the reaction components were allowed to cool to room temperature naturally. Finally, the Cu foils covered with graphene were moved into the vacuum sputter device and they were immediately sputtered with Pt.After sputtering, the samples were cut into squares with dimensions of 0.5 cm × 0.5 cm, and dipped into an (NH4)2S2O8 solution (0.2 mol L−1) to etch the Cu foil for six hours. After the etching process was completed, the samples were rinsed with ultrapure water several times and floated on water for temporary storage. The resulting samples were denoted as PtNPs/GR.
Preparation of modified electrodes
A bare glassy carbon electrode (GCE) was polished using a suspension containing different-sized powders of Al2O3, and washed with ultrapure water and ethanol to remove the adsorbed powder. Then, the GCE was dried in N2 and adhered to the PtNPs/GR floating on the water. During this process, the GCE surface was made to contact the graphene instead of the Pt nanoparticles. The modified electrode, denoted as PtNPs/GR/GCE, was kept vertical in air to dry for about two hours, and the graphene and GCE surfaces were kept in close contact for subsequent electrochemical experiments.The graphene-modified glassy carbon electrode (GR/GCE) was obtained by carrying out a PMMA-assisted transfer of CVD-grown graphene onto the GCE. The PMMA solution was spin-coated onto the graphene that was CVD grown on Cu foils (0.5 cm × 0.5 cm). After curing, the sample was dipped in an (NH4)2S2O8 solution (0.2 mol L−1) to etch the Cu foils for six hours. When the etching was completed, the sample was rinsed with ultrapure water several times and the side without PMMA covered of graphene was adhered to the cleaned surface of the GCE. After the resulting sample was dried, the bare graphene on the GCE was obtained by removing PMMA with acetone. The resulting electrode was denoted as GR/GCE.
3. Results and discussion
Principle
The synthesis of a glassy carbon electrode modified with chemical vapor deposition (CVD)-grown graphene supporting Pt nanoparticles, denoted as PtNPs/GR/GCE, is illustrated in Scheme 1. As shown, the CVD-grown graphene on a Cu foil was sputtered with Pt and then etched. The resulting PtNPs/GR film can be clearly seen to be free standing on the water in the photograph. Then the modified electrode, i.e., PtNPs/GR/GCE, was constructed and tested for its ability to electrochemically detect hydrogen peroxide (H2O2). The application of in situ sputtering made it unnecessary to carry out surface cleaning of Pt nanoparticles and complicated transfers of CVD-grown graphene. Furthermore, the as-prepared composites of CVD-grown graphene and Pt nanoparticles having clean surfaces can stably adhere onto the surface of an electrode using van der Waals forces.28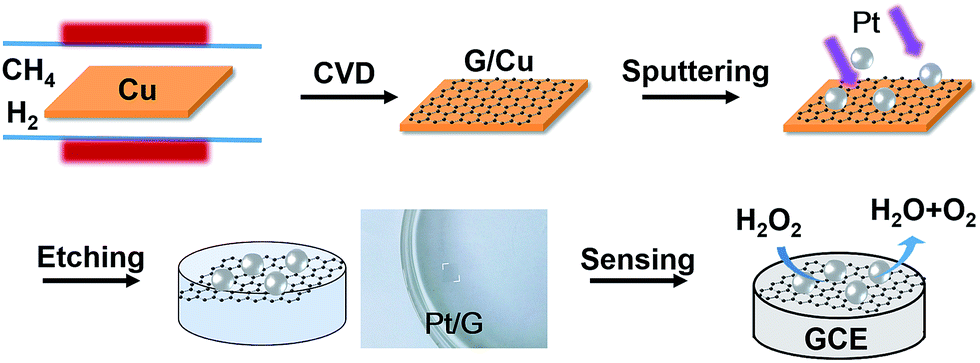 | ||
| Scheme 1 Process used to synthesize PtNPs/GR/GCE. | ||
Characterization of PtNPs/GR
The morphology of the PtNPs/GR film was determined by acquiring transmission electron microscopy (TEM) images, as shown in Fig. 1(A). The image showed graphene having wrinkles with micron-sized lateral dimensions, and hence able to serve as a micro-grid support, as well as Pt nanoparticles homogeneously dispersed on the graphene. The good dispersion of sputtered Pt nanoparticles on the graphene demonstrated the ability of the graphene platform to prevent the Pt nanoparticles from agglomerating and having most of their surfaces blocked. A high-resolution TEM image of a single Pt nanoparticle is shown in the top right of Fig. 1(A). This Pt nanoparticle was measured to have dimensions of about 90 nm, which was the average size of the Pt nanoparticles (see size distribution histogram in inset in the bottom right of Fig. 1(A)).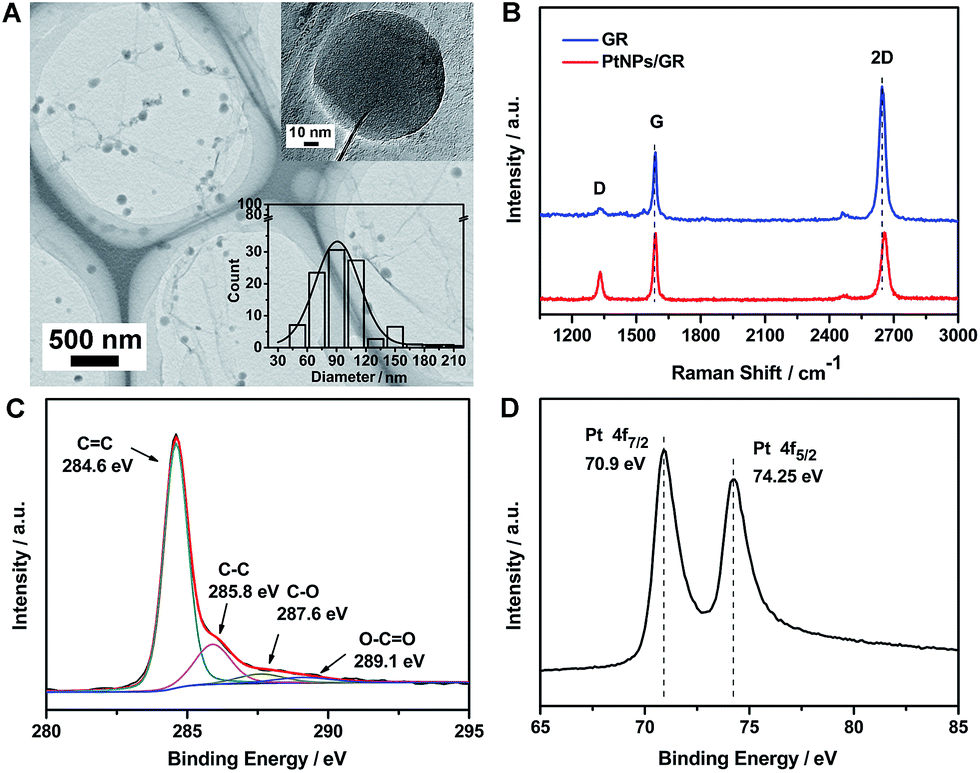 | ||
| Fig. 1 (A) TEM images of PtNPs/GR. Top right inset is an HRTEM image of a single Pt nanoparticle and the bottom right inset shows the distribution of measured diameters of the Pt nanoparticles. (B) Raman spectra of graphene (blue curve) and PtNPs/GR (red curve). (C, D) XPS survey spectrum of PtNPs/GR showing the (C) C 1s and (D) Pt 4f peaks. | ||
The structure of the graphene and PtNPs/GR film were analysed by using a Raman spectrometer (Fig. 1(B)). The graphene yielded a Raman spectrum (blue curve) showing sharp G and 2D peaks, located at ∼2645.7 cm−1 and ∼1588.6 cm−1, respectively, indicating the good crystallinity of the graphene on the Cu foil. The intensity of the 2D peak revealed that the graphene was a single layer, as indicated in previous reports.29,30 The intensity of the D peak located at ∼1329.4 cm−1 was observed to be very low, indicating that the sp2 form of carbon was predominant in the as-prepared PtNPs/GR film. The ratio of the intensity of the 2D peak to that of the G peak was approximately unity for the composite (red curve in Fig. 1(B)), and significantly less than this ratio for the graphene; this result revealed the increased disorder in the composite. The increased disorder can be attributed to graphene rolling and forming wrinkles caused by the deposition of Pt nanoparticles during the sputtering process. In addition, the Raman spectrum of PtNPs/GR film showed a slight blue shift of the 2D peak and increased intensity of the D peak, which was attributed to an increased amount of defects caused during the sputtering process.
The surface chemical composition of the PtNPs/GR film was characterized using X-ray photoelectron spectroscopy (XPS). The C 1s portion of the spectrum of PtNPs/GR can be divided into four peaks, as shown in Fig. 1(C). The peaks at 284.6 eV and 285.8 eV corresponded to the C![[double bond, length as m-dash]](https://www.rsc.org/images/entities/char_e001.gif) C and C–C bonds, respectively, and those at 287.5 eV and 289.1 eV were indexed to CO and O–CO. The higher energy of the sp2 CC bonds suggested the formation of graphene. The formation of the oxygen-containing functional groups was probably caused by the oxidation of graphene during its preparation and storage, but the weak intensities of the peaks corresponding to these functional groups indicated the relative stability of graphene in the experimental conditions. As shown in Fig. 1(D), the Pt 4f portion of the spectrum of the PtNPs/GR film was fitted by two peaks at 70.9 eV and 74.25 eV, which we indexed to Pt(0) 4f 7/2 and Pt(0) 4f 5/2, respectively. All of the observed binding energy values for C 1s and Pt 4f were consistent with those reported in the literature.31 The presence of the Pt 4f peaks confirmed the feasibility of depositing Pt nanoparticles on the surface of graphene using the sputtering technology.
C and C–C bonds, respectively, and those at 287.5 eV and 289.1 eV were indexed to CO and O–CO. The higher energy of the sp2 CC bonds suggested the formation of graphene. The formation of the oxygen-containing functional groups was probably caused by the oxidation of graphene during its preparation and storage, but the weak intensities of the peaks corresponding to these functional groups indicated the relative stability of graphene in the experimental conditions. As shown in Fig. 1(D), the Pt 4f portion of the spectrum of the PtNPs/GR film was fitted by two peaks at 70.9 eV and 74.25 eV, which we indexed to Pt(0) 4f 7/2 and Pt(0) 4f 5/2, respectively. All of the observed binding energy values for C 1s and Pt 4f were consistent with those reported in the literature.31 The presence of the Pt 4f peaks confirmed the feasibility of depositing Pt nanoparticles on the surface of graphene using the sputtering technology.
Electrochemical behaviour of the PtNPs/GR-modified glassy carbon electrodes toward the sensing of H2O2
The electrochemical behavior of the PtNPs/GR-modified glassy carbon electrodes (PtNPs/GR/GCE) toward the H2O2 oxidation reaction was analysed in a phosphate-buffered solution, as shown in Fig. 2. According to cyclic voltammogram (CV) tests at a scan rate of 0.05 V s−1 from −0.3 V to 0.8 V, the capacitance of PtNPs/GR/GCE was found to be greater than those of Pt/rGO/GCE, GR/GCE and GCE in phosphate-buffered solution without H2O2 (dashed line in Fig. 2(A)). When 25 μL of H2O2 (5 μM) was added, the GR/GCE (green solid line) and GCE (black solid line) yielded no obvious peaks in the CV curves, but PtNPs/GR/GCE (red solid line) did yield obvious peaks at 0.05 V and 0.55 V, which indicated a good response of the modified electrode to a low concentration of H2O2. In contrast, the current for Pt/rGO/GCE (blue solid line) showed a very small peak at 0.55 V, which can be accounted for by the stacked layers of graphene.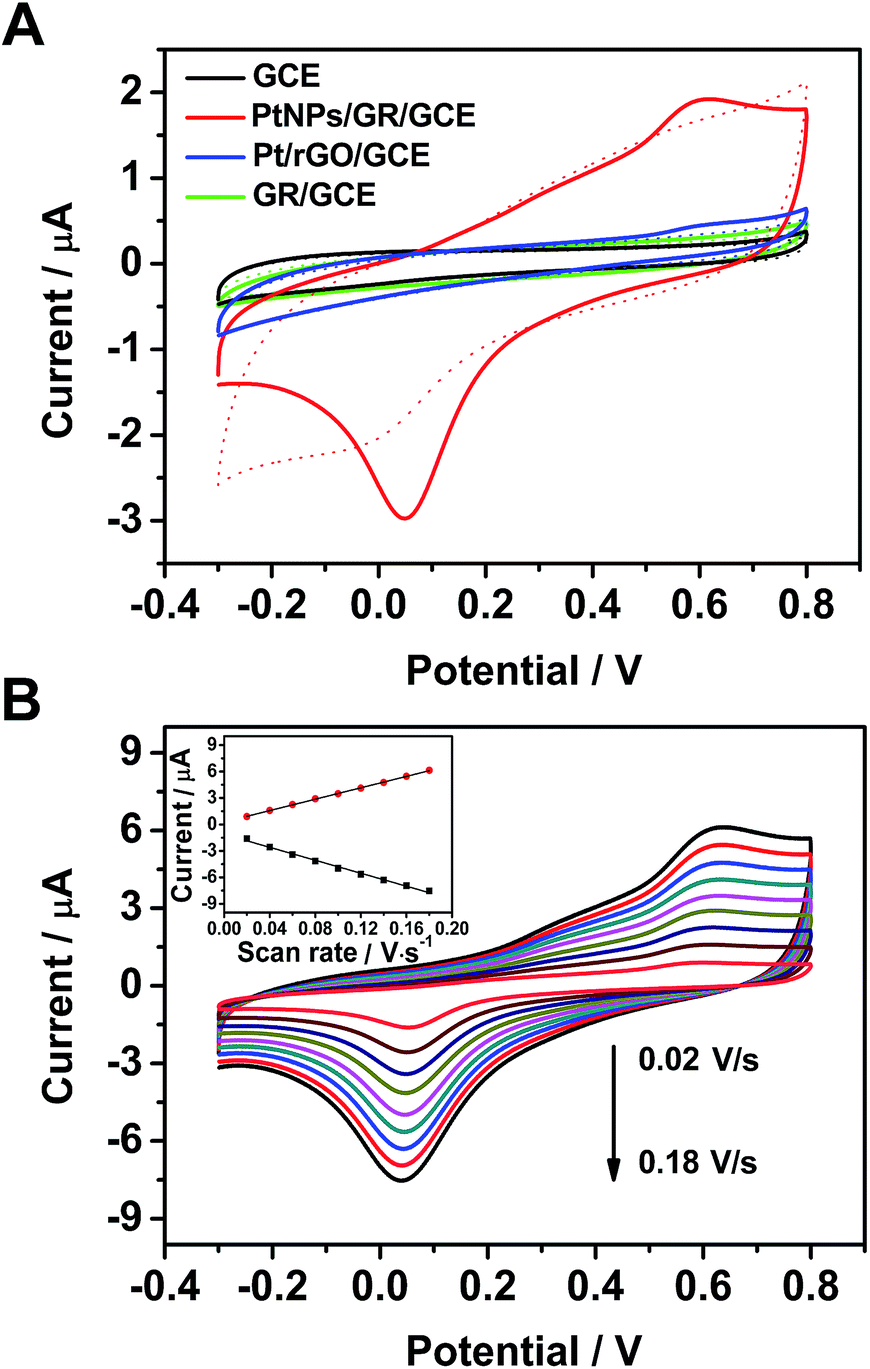 | ||
| Fig. 2 (A) Cyclic voltammogram curves of GCE (black curve), PtNPs/GR/GCE (red curve), Pt/rGO/GCE (blue curve) and GR/GCE (green curve) in a phosphate-buffered solution and in the absence (dashed line) and presence (solid line) of 5 μM H2O2 with a scan rate of 50 mV s−1. (B) PtNPs/GR/GCE in a phosphate-buffered solution containing 5 μM H2O2 at various scan rates with regular intervals of 20 mV s−1. The inset shows the plots of current versus scan rate at 0.05 V and 0.55 V. | ||
The electrochemical characteristics of PtNPs/GR/GCE containing 5 μM H2O2 in the phosphate-buffered solution was further investigated by acquiring CV curves with different scan rate. The redox peak current clearly changed as the scan rate was varied between 0.02 V s−1 to 0.18 V s−1 (in steps of 0.02 V s−1) as shown in Fig. 2(B). As shown in the inset of Fig. 2(B), the peak currents at 0.05 V and 0.55 V each showed a linear dependence on scan rate, with correlation coefficients of 0.995 and 0.999, respectively. The fitted data implied that the dynamics control was an adsorption process.
Amperometric determination of the concentration of H2O2
The amperometric method was used to investigate the ability of PtNPs/GR/GCE to determine the concentration of H2O2 at 0.55 V in a phosphate-buffered solution, as shown in Fig. 3. The solution was bubbled with N2 for 30 minutes and kept stirring when H2O2 added. Different concentrations of H2O2 (25 μL) were injected into the phosphate-buffered solution every 50 s (Fig. 3(A)). When the concentration of H2O2 was increased from 0.5 nM to 0.1 μM via successive injections, the current curve showed a step-wise increase within a response time of less than 3 s (and reached 95% of the maximum response value). The inset of Fig. 3(A) shows an enlarged view of the current–time curve when 0.5 nM H2O2 was injected. A current in the order of magnitude of 10−9 A was observed, and was caused by the hydrophobicity of graphene.32 The current increased when 1 nM H2O2 was injected into the solution, and continued to do so as more H2O2 was injected. This result revealed the good electrochemical performance of the sensor, specifically its ability to respond to a low concentration of H2O2.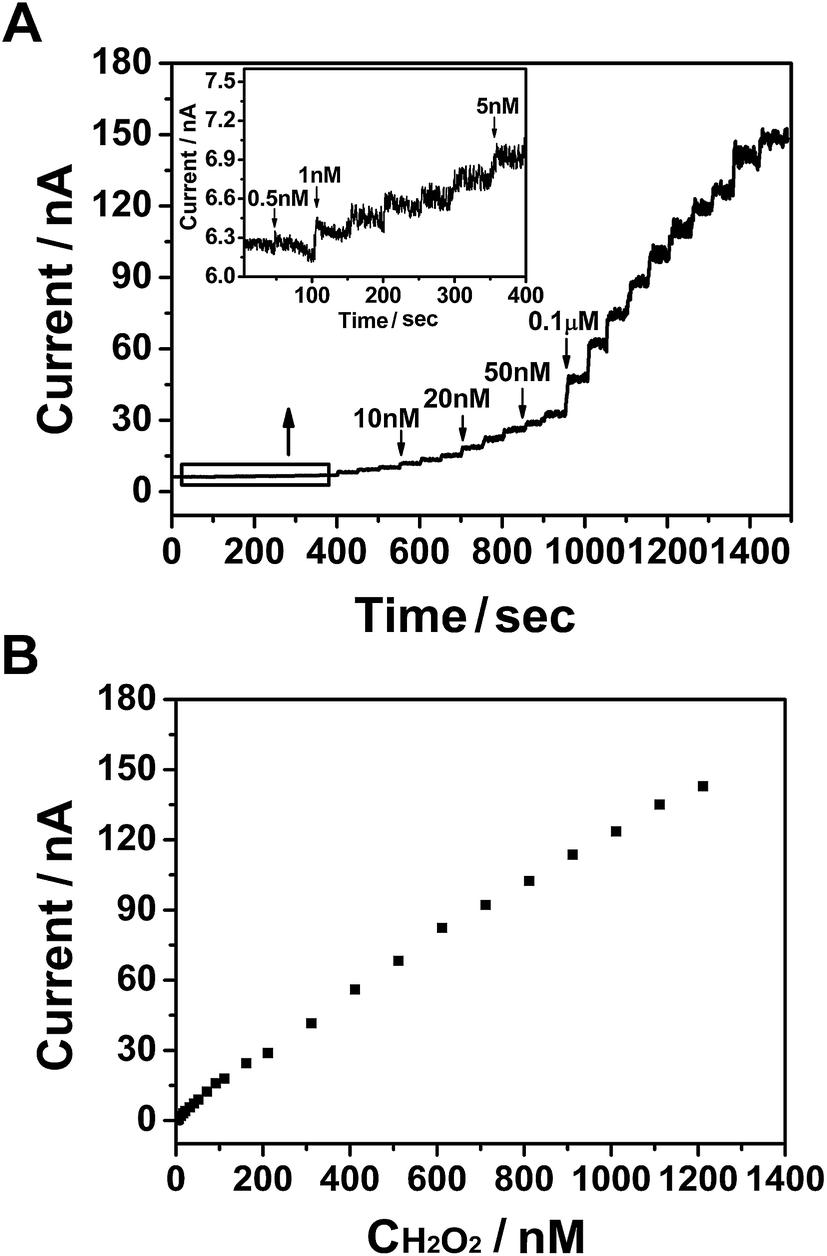 | ||
| Fig. 3 (A) Amperometric curve for PtNPs/GR/GCE with the injection of H2O2 at 0.55 V with regular intervals of 50 s. Inset shows an enlarged view of the curve from 0 to 400 s. (B) Plot of current versus H2O2 concentration. | ||
The response current value versus concentration of H2O2 was plotted in Fig. 3(B), and showed a good linear relationship that followed the equation I = 1.195 × 10⁻¹⁰ × C + 3.539 × 10⁻⁹ (nA, nM, R2 = 0.998). The H2O2 sensor based on PtNPs/GR/GCE exhibited linear detection range from 0.5 nM to 1.286 μM and detection limit of 0.18 nM (S/N = 3), which also showed the excellent potential of this electrode to detect ultralow concentrations of H2O2.
The detection performances of similar materials are listed in Table 1 for comparison. PtNPs/GR/GCE showed a lower detection limit (0.18 nM) at a signal-to-noise ratio of 3 than did the other powder graphene-supported Pt nanoparticles materials. The favourable analytical performance to detect ultralow concentrations of H2O2 was attributed to the good dispersion and untreated surface of the Pt nanoparticles with exposed catalytic active sites on the surface of CVD graphene. Furthermore, the lack of stacking of graphene layers in PtNPs/GR and the lack of agglomeration of Pt nanoparticles, as well as the low initial current, may have been the key factors responsible for the better ability of PtNPs/GR/GCE to detect ultralow concentrations of H2O2.
| Materials | Linear range (μM) | Detection limit (μM) | Ref. |
|---|---|---|---|
| a Pt nanoparticle ensemble on graphene hybrid nanosheet.b Pt nanoparticle-decorated porous graphene.c Pt nanoparticles supported on CVD-grown graphene. | |||
| rGO–PtNPs | 0.05–750.6 | 0.016 | 18 |
| PNEGHNsa | 1–500 | 0.08 | 19 |
| Pt/PGb | 1–1477 | 0.5 | 20 |
| GN–Pt | 2–710 | 0.5 | 33 |
| Pt/GN | 2.5–6650 | 0.8 | 34 |
| PtNPs/GRc | 0.0005–0.001286 | 0.00018 | This work |
The standard addition method was used to detect H2O2 in real samples for the purpose of evaluating the practical application of PtNPs/GR/GCE. Percentage recovery was calculated as listed in Table 2. The results showed satisfactory recovery and relative standard deviations (RSDs), illustrating the potential feasibility of the PtNPs/GR/GCE sensor to detect H2O2 in real samples. The sensor shows 95% of its initial current after having been stored in a desiccator at room temperature for two weeks, indicating the good stability of its electrochemical response to H2O2.
| Samples | Spiked (μM) | Found (μM) | Recovery (%) | Added (μM) | Tested (μM) | Yield (%) | RSD (%) |
|---|---|---|---|---|---|---|---|
| a RSD: relative standard deviation. | |||||||
| 1 | 10 | 10.75 | 107.5 | 5 | 14.94 | 98.80 | 2.40 |
| 2 | 10 | 9.120 | 91.20 | 10 | 19.75 | 97.50 | 3.22 |
| 3 | 10 | 10.23 | 102.3 | 15 | 26.72 | 111.5 | 3.02 |
4. Conclusions
In conclusion, a composite of Pt nanoparticles on CVD-grown graphene (PtNPs/GR) was successfully prepared for the non-enzymatic detection of H2O2. A free-standing PtNPs/GR film was obtained by sputtering Pt on the surface of CVD-grown graphene without transfer of graphene from the growth substrate. Residual-free graphene and a Pt surface with exposed active sites, as well as the good quality of the CVD-grown graphene, contributed to the satisfactory catalytic performance of the composite toward H2O2. The PtNPs/GR/GCE sensor showed a low initial current (with a magnitude of 10−9 A) and detection limit (0.18 nM, S/N = 3), and exhibited higher sensitivity at detecting ultralow concentrations of H2O2 than did previously reported sensors. In addition, the PtNPs/GR/GCE sensor was highly stable and showed a rapid response (2 s). On account of the synthesis process and enhanced catalytic performance, the PtNPs/GR composite exhibited potential applications in H2O2 detection, including in real samples.Acknowledgements
This work was financially supported by the National Natural Science Foundation of China (Grant No. 21475076) and International S&T collaboration Program of China (No. 2015DFA50060).Notes and references
- M. Valko, M. Izakovic, M. Mazur, C. J. Rhodes and J. Telser, Mol. Cell. Biochem., 2004, 266, 37–56 CrossRef CAS PubMed.
- S. G. Rhee, Science, 2006, 312, 1882–1883 CrossRef PubMed.
- M. Deng, S. J. Xu and F. N. Chen, Anal. Methods, 2014, 6, 3117–3123 RSC.
- F. X. Zhan, Q. Yang, Q. F. Wang, Q. L. Zhang, Z. Y. Zhuang, X. Feng, G. Y. Zhang and G. X. Zheng, RSC Adv., 2016, 6, 89940–89943 RSC.
- P. Ju, Y. H. Xiang, Z. B. Xiang, M. Wang, Y. Zhao, D. Zhang, J. Q. Yu and X. X. Han, RSC Adv., 2016, 6, 17483–17493 RSC.
- L. Y. Meng, D. L. Jiang, C. S. Xing, X. M. Lu and M. Chen, RSC Adv., 2015, 5, 82496–82502 RSC.
- W. Chen, S. Cai, Q. Q. Ren, W. Wen and Y. D. Zhao, Analyst, 2012, 137, 49–58 RSC.
- J. Yu, X. Y. Ma, W. Y. Yin and Z. J. Gu, RSC Adv., 2016, 6, 81174–81183 RSC.
- S. Zhang, Q. L. Sheng and J. B. Zheng, RSC Adv., 2015, 5, 26878–26885 RSC.
- S. J. He, B. Y. Zhang, M. M. Liu and W. Chen, RSC Adv., 2014, 4, 49315–49323 RSC.
- S. J. He, Z. G. Chen, Y. Y. Yu and L. J. Shi, RSC Adv., 2014, 4, 45185–45190 RSC.
- X. X. Dong, M. Y. Li, N. N. Feng, Y. M. Sun, C. Yang and Z. L. Xu, RSC Adv., 2015, 5, 86485–86489 RSC.
- R. Zhang and W. Chen, Biosens. Bioelectron., 2017, 89, 249–268 CrossRef CAS PubMed.
- G. Gnana kumar, K. Justice Babu, K. S. Nahm and Y. J. Hwang, RSC Adv., 2014, 4, 7944–7951 RSC.
- A. K. Geim and K. S. Novoselov, Nat. Mater., 2007, 6, 183–191 CrossRef CAS PubMed.
- M. Pumera, Chem. Soc. Rev., 2010, 39, 4146–4157 RSC.
- S. Chen, R. Yuan, Y. Chai and F. Hu, Microchim. Acta, 2013, 180, 15–32 CrossRef CAS.
- S. Palanisamy, H. F. Lee, S. M. Chen and B. Thirumalraj, RSC Adv., 2015, 5, 105567–105573 RSC.
- S. Guo, D. Wen, Y. Zhai, S. Dong and E. Wang, ACS Nano, 2010, 4, 3959–3968 CrossRef CAS PubMed.
- J. Liu, X. Bo, Z. Zhao and L. Guo, Biosens. Bioelectron., 2015, 74, 71–77 CrossRef CAS PubMed.
- S. Park and R. S. Ruoff, Nat. Nanotechnol., 2009, 4, 217–224 CrossRef CAS PubMed.
- N. V. Long, M. Ohtaki, M. Uchida, R. Jalem, H. Hirata, N. D. Chien and M. Nogami, J. Colloid Interface Sci., 2011, 359, 339–350 CrossRef PubMed.
- P. Karam and L. I. Halaoui, Anal. Chem., 2008, 80, 5441–5448 CrossRef CAS PubMed.
- D. A. Brownson, S. A. Varey, F. Hussain, S. J. Haigh and C. E. Banks, Nanoscale, 2014, 6, 1607–1621 RSC.
- D. A. Brownson and C. E. Banks, Phys. Chem. Chem. Phys., 2012, 14, 8264–8281 RSC.
- X. Liang, B. A. Sperling, I. Calizo, G. Cheng, C. A. Hacker, Q. Zhang, Y. Obeng, K. Yan, H. Peng, Q. Li, X. Zhu, H. Yuan, A. R. Hight Walker, Z. Liu, L. M. Peng and C. A. Richter, ACS Nano, 2011, 5, 9144–9153 CrossRef PubMed.
- X. Li, W. Cai, J. An, S. Kim, J. Nah, D. Yang, R. Piner, A. Velamakanni, I. Jung, E. Tutuc, S. K. Banerjee, L. Colombo and R. S. Ruoff, Science, 2009, 324, 1312–1314 CrossRef CAS PubMed.
- T. J. Booth, P. Blake, R. R. Nair, D. Jiang, E. W. Hill, U. Bangert, A. Bleloch, M. Gass, K. S. Novoselov, M. I. Katsnelson and A. K. Geim, Nano Lett., 2008, 8, 2442–2446 CrossRef CAS PubMed.
- A. C. Ferrari, J. C. Meyer, V. Scardaci, C. Casiraghi, M. Lazzeri, F. Mauri, S. Piscanec, D. Jiang, K. S. Novoselov, S. Roth and A. K. Geim, Phys. Rev. Lett., 2006, 97, 187401 CrossRef CAS PubMed.
- L. M. Malard, M. A. Pimenta, G. Dresselhaus and M. S. Dresselhaus, Phys. Rep., 2009, 473, 51–87 CrossRef CAS.
- E. Paparazzo, Carbon, 2013, 63, 578–581 CrossRef CAS.
- J. S. Park, K. D. Kihm, H. Kim, G. Lim, S. Cheon and J. S. Lee, Langmuir, 2014, 30, 8268–8275 CrossRef CAS PubMed.
- F. G. Xu, Y. J. Sun, Y. Zhang, Y. Shi, Z. W. Wen and Z. Li, Electrochem. Commun., 2011, 13, 1131–1134 CrossRef CAS.
- F. Zhang, Z. Wang, Y. Zhang, Z. Zheng, C. Wang, Y. Du and W. Ye, Int. J. Electrochem. Sci., 2012, 7, 1968–1977 CAS.
Footnote |
| † The electrodes supported with reduced graphene oxide powder and modified with Pt nanoparticles (Pt/rGO/GCE) were tested for comparison purposes and were obtained as follows: the ethanol dispersion of rGO (1 mg mL−1) was subjected to ultrasound and dropped onto the surface of a GCE (3 μL); then the resulting GCE was dried and then placed into the sputtering chamber for Pt sputtering. |
| This journal is © The Royal Society of Chemistry 2017 |