 Open Access Article
Creative Commons Attribution 3.0 Unported Licence
Infrared spectroscopy on the role of surfactants during methane hydrate formation
Florian Rauha,
Jens Pfeifferb and
Boris Mizaikoff *a
*a
aInstitute of Analytical and Bioanalytical Chemistry, Ulm University, Ulm, Germany. E-mail: boris.mizaikoff@uni-ulm.de
bPSL Systemtechnik GmbH, Osterode, Germany
First published on 10th August 2017
Abstract
Gas hydrates are ice-like compounds consisting of a rigid water framework hosting small molecules inside crystal cavities. In the present study, a gas hydrate autoclave that enables precise control and observation of temperature and pressure was modified for facilitating in situ mid-infrared spectroscopic studies on the formation of bulk gas hydrates via a polycrystalline silver halide fiber fitted through the vessel serving as active evanescent field sensing element. Methane hydrates were grown inside the autoclave with addition of three different surfactants, i.e., sodium dodecyl sulfate (SDS), dioctyl sodium sulfosuccinate (Aerosol-OT/AOT), and cetylpyridinium chloride (CPC). The accelerating effect of surface-active molecules on the formation of gas hydrates was studied via fiberoptic evanescent field infrared spectroscopy. Thereby, detailed molecular information on the mechanisms of gas hydrate formation and the role of detergents in that process was collected indicating that remaining free guest molecules are in fact trapped within the interstitial water of gas hydrate crystals. Furthermore, the mechanism of gas hydrate formation proposed earlier by our research team for propane could also be confirmed for methane, and for additional detergents thereby leading to a generic mechanism.
Introduction
Gas hydrates are crystalline compounds existing within certain pressure and temperature conditions that are present e.g., in deep sea environments or in permafrost areas. Water molecules form a rigid framework encaging guest molecules such as methane, propane, other short-chained hydrocarbons, sulfur dioxide, carbon dioxide, hydrogen sulfide, or larger molecules including 1,2-dimethylcyclohexane1 among several other compounds within the crystal cavities. Depending on the guest molecule, one of three gas hydrate structures forms, i.e., structure I, II or H. These structures vary in the number of water molecules forming the elemental cell of the crystal, the guest molecule, and thus, the shape and size of the cavities.2–4Natural gas hydrates are mostly generated from natural gas components such as methane. Consequently, substantial amounts of CH4 and other short-chained hydrocarbons are globally stored in oceans and permafrost areas.5–7
Gas hydrates are actively researched not only due to their potential as future energy resource,8–10 but also for sequestration and storage of carbon dioxide that is generated during combustion of harvested methane within depleted natural gas hydrate areas.11,12 Furthermore, gas hydrates frequently form inside gas and oil pipelines, which may lead to plugging and reduced transport, or – in the worst case – destruction of pipes.13,14 Hence, a substantial scientific and industrial focus is evident on the development of effective low-dosage gas hydrate inhibitors. Gas hydrates also enable safe and low pressure storage and transport of technical gases and fuels,15,16 which may eventually play a role in the exploration of space.17 Last but not least, due to global climate change and warming of the oceans gas hydrates are considered representing a severe environmental risk triggering massive global warming if they are dissociated and released as gaseous methane into the atmosphere.18,19 Consequently, understanding the mechanism and potential control of gas hydrate formation and dissociation is essential.
Spectroscopic techniques are widely used in gas hydrate research, since they enable collecting information not only on formation and dissociation, but also on structural data at a molecular level.20
In the present study, mid-infrared fiberoptic evanescent field spectroscopy was used for collecting in situ information on the formation of gas hydrates in presence of various detergents. Infrared spectroscopy is a particularly robust and rapid measurement technique enabling remote sensing at harsh environmental conditions as present in the deep sea or in geological formations.21–24 Surface-active substances are known to accelerate the formation of gas hydrates.25–33 Lo et al. performed infrared attenuated total reflection (IR-ATR) spectroscopic studies on the growth of gas hydrate at the hydrate/water interface in presence of various concentrations of SDS with cyclopentane as the guest molecule. It was found that SDS molecules form monolayers and bilayers at the interface above an SDS concentration of 100 ppm, thus promoting diffusion of the guest molecules into the hydrate phase.34,35
In 2011, our research group presented a seminal study proposing a mechanism for this accelerated gas hydrate formation process. According to this model derived from fiberoptic infrared evanescent field absorption data, the detergent (i.e., SDS) molecules serve as a ‘carrier’ for non-polar gas molecules (i.e., propane) actively translocating these molecules to surfaces where nucleation occurs first. At metal or metal-containing surfaces, water is already present as prestructured clusters that may rapidly form gas hydrate crystals with these gas molecules despite potential thermodynamic barriers.36 In the present study, methane was selected as guest molecule in lieu of propane, as CH4 is the most relevant constituent in natural gas hydrates. Also, two additional detergents, i.e., AOT and CPC were included in the study for proving that the proposed mechanism is indeed generic. AOT revealed an even more pronounced accelerating effect on the formation of gas hydrates compared to SDS, while no gas hydrates could be grown in the presence of CPC even during 21 days of spectroscopic observation.
All experiments were carried out in a gas hydrate autoclave (GHA 200, PSL Sytemtechnik, Claustal-Zellerfeld, Germany) that was modified for enabling in situ mid-infrared spectroscopic observations of the gas hydrate formation via fiberoptic evanescent field absorption spectroscopy.
Experimental
Chemicals
SDS (98.5%), AOT (98%), and CPC (purity data not available) were purchased from Sigma Aldrich (St. Louis, MO, USA) and used without further purification. Methane (99.5%) was purchased from MTI Industriegase (Neu-Ulm, Germany). Polycrystalline silver halide fibers were purchased from Artphotonics (Berlin, Germany).Apparatus
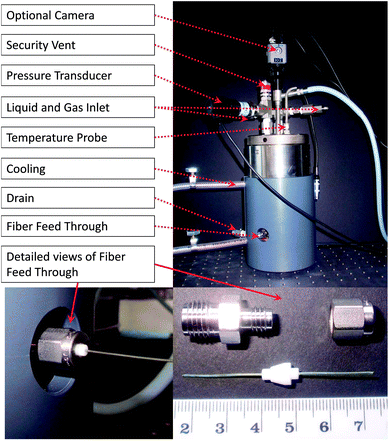
A commercially available gas hydrate autoclave (GHA 200, PSL Systemtechnik, Claustal-Zellerfeld, Germany) with an internal volume of 450 ml was modified with a pressure-tight feed-through for a polycrystalline silver halide fiber serving as active mid-infrared-transparent (3–20 μm) evanescent field sensing element for collecting in situ spectra of bulk gas hydrates. A thread was drilled into either side of the lower part of the vessel (see Fig. 1). Swagelok® tube fittings were fixed into the holes, and the core-only fiber with a diameter of 700 μm was sealed into the vessel via customized Teflon ferrules. The lower part of the autoclave was fitted with an adapted copper cooling coil facilitating space for the fiber feed-through in between the cooling coil windings, which is not available for any other gas hydrate autoclave. All further access ports remain located at the original top lid of the autoclave including gas and liquid inlets, pressure and temperature sensors, and drainage and security valves. The camera shown in Fig. 1 could not be used during these experiments, as the intensity of the light source was inducing degradation of the silver halide fiber inside the autoclave. The lower right part of Fig. 1 exemplarily shows how the fiber is fitted into the vessel. During the experiments, a silver halide fiber with a length of 500 mm was used (i.e., longer than the fiber segment shown for illustration in Fig. 1).The aqueous detergent solution was pumped into the vessel using a Knaur HPLC pump after thoroughly rinsing the autoclave several times with DI water. Gas was supplied directly from a compressed gas cylinder at a maximum pressure of 50 ± 2 bar via a high pressure polyetheretherketone (PEEK) capillary.
Teflon spray was used to lubricate the thread fixing the lid of the autoclave for avoiding the introduction of hydrocarbons from conventional lubricants that may interfere with the detection of C–H vibrations related to methane or detergents.
Infrared radiation provided by a Bruker IR Cube FT-IR spectrometer (Bruker Optik GmbH, Ettlingen, Germany) was coupled into the fiber, which was precisely aligned within the focal point of an off-axis parabolic mirror (OAPM). IR radiation was then propagated via total internal reflection along the core-only fiber resulting in a radially symmetric evanescent field extending from the fiber a few micrometers into the adjacent environment. Thereby, IR absorption spectroscopy of liquids, solids or mixtures thereof (i.e., ‘bulk material’) formed inside the pressure vessel is uniquely enabled. At the distal end of the fiber, IR radiation emanating from the outcoupling facet was collected by another OAPM with the fiber end facet located within the focal point, and thereby collimated. A third OAPM was used to focus the collimated IR beam onto a 1 mm2 liquid N2-cooled mercury–cadmium–telluride (MCT) detector element. The entire experimental set-up was located inside a plexiglas box that was purged with dried and purified air ensuring stable spectral background conditions for the open IR beam path.
Measurement procedure
Deionized water (DI-water) was used to prepare solutions of three detergents (SDS, AOT, CPC) at a concentration of 380 mg L−1 each. The autoclave was thoroughly cleaned with pure DI water prior to each measurement. After drying with dried and purified air, the pressure vessel was rinsed several times with methane to remove remaining air. Thereafter, 300 ml of the detergent solution was pumped into the pressure vessel via the HPLC pump and pressurized with methane until a pressure of approx. 50 bars was reached. The pressure was then released and raised to 50 bars again 3 times for expelling dissolved gases (air) from the aqueous phase. After finally adjusting the pressure again to 50 bars and cooling (to 2 °C), spectral data recording was started along with temperature and pressure traces. Spectra were collected at least every 7 min at a spectral resolution of 2 cm−1 averaging 400 scans.Data processing
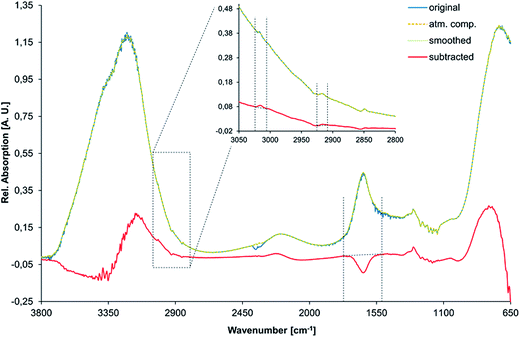
All spectra were processed via the Bruker OPUS software (Bruker Optik GmbH, Ettlingen, Germany) as follows. (i) First, an atmospheric compensation algorithm was applied for removing absorption features arising from atmospheric CO2 and water vapor (a single-channel spectrum of both, the reference and the sample are analysed and transformed into a ratio spectrum, featuring no disturbing bands from atmospheric H2O or CO2). (ii) Thus obtained spectra were smoothed (method based on Savitzky–Golay algorithm using 25 smoothing points) and a spectral subtraction was performed. During this process, the first spectrum that was recorded at the desired temperature of 2 °C (i.e., usually IR spectrum no. 14 after approx. 70 min) was subtracted from all following spectra for emphasizing the spectral changes during gas hydrate formation. (iii) The C–H stretching vibration of methane centered at 3017 cm−1 and the asymmetric stretching vibration of the respective detergent at 2917 cm−1 were integrated between 3007 and 3024 cm−1, and between 2910 and 2924 cm−1, respectively. (iv) The peak area of the H–O–H bending vibration was integrated between 1540 and 1754 cm−1 along with the peak position of the bending/libration combination vibration at 2115 cm−1. (v) Thus obtained integrated peak areas and peak positions were then plotted against time along with the corresponding temperature and pressure traces.Fig. 2 visualizes the spectral data processing routine for an exemplary spectrum of gas hydrate with AOT (i.e., spectrum no. 75 after 375 min) revealing the entire recorded spectral region from 700 to 3800 cm−1 indicating the applied integration boundaries.
Results & discussion
Spectral observations
As reported in our previous study, the spectral features of the detergent, the guest molecule (here, methane), and two vibrational features of water, i.e., the H–O–H bending vibration at approx. 1640 cm−1 (ν2), and the combined vibration of bending and libration at approx. 2115 cm−1 (i.e., ν2 + νL) were analyzed in order to extract information on the molecular mechanism of hydrate formation.36Gaseous methane shows two characteristic absorption features in the mid-infrared range: (i) the degenerated stretching vibration at 3017 cm−1, and (ii) the degenerate deformation vibration at 1306 cm−1.37 Since the deformation vibration is frequently distorted in the spectral region of 1120–1365 cm−1,38 the stretching vibration at 3017 cm−1 was selected for identifying and characterizing methane during gas hydrate formation. Two absorption features are arising from the carbohydrate-chains of the detergents, i.e., the asymmetric (approx. 2920 cm−1) and the symmetric (approx. 2850 cm−1) C–H stretching vibrations. The asymmetric stretching feature, centered at 2917 cm−1, was used to identify and characterize detergents during the formation and growth of gas hydrates, as this spectral feature is slightly more pronounced in the difference spectra compared to the symmetric stretching vibration.
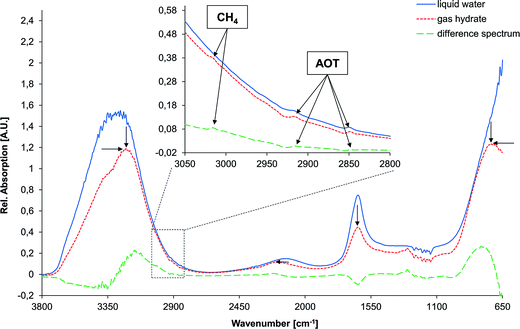
Several changes are evident for the spectrum of water during the phase transition from the liquid state to solid gas hydrate (indicated by black arrows in Fig. 3). The most dominant absorption feature of water is the O–H stretching band centered at approx. 3350 cm−1, which comprises a combination of the stretching vibration ν1, an overtone of the bending vibration 2ν2, and the stretching vibration ν3 of the H2O molecule. This band is subject to a distinct redshift during the phase transition. However, this band was of limited utility for the analysis of gas hydrate formation, as it is strongly affected by spectral noise due to limited transmission of the fiber at low and high wavenumbers. Another prominent absorption feature of water is centered at approx. 700 cm−1 (νL), which is the libration band shifting to higher wavenumbers during gas hydrate formation. Again, due to noise close to the detector cut-off at 675 cm−1 this band appears distorted and was therefore not included into the analysis. Hence, for analyzing the phase transition the peak area of the H–O–H bending vibration at approx. 1640 cm−1 (ν2) was evaluated, which is decreasing in intensity as the aqueous matrix solidifies. Plotting the bending vibration vs. time enables correlating spectral changes with pressure and temperature changes during gas hydrate formation. Likewise, the shift in peak position of the rather weak absorption feature arising from a combination of the bending and the libration mode at approx. 2115 cm−1 (i.e., ν2 + νL in the liquid state) was evaluated vs. time.
Fig. 3 shows the spectral changes of liquid water in the 3800–650 cm−1 regime upon formation of solid gas hydrates including the corresponding difference spectrum, which was used for data analysis. Arrows are indicating the change of each absorption feature, as reported elsewhere.39 The inset shows a detailed view of the C–H stretching region (3050–2800 cm−1) illustrating the small yet distinct absorption features arising from methane and the respective detergent (here, AOT). The peaks were assigned as previously shown.36 During the formation of gas hydrates, the absorption features of the detergent evolve to a constant level, and are significantly higher compared to the beginning of the experiment. The absorption bands of the guest molecule are not detectable once the molecule is enclathrated due to the high absorptivity of the solidified water matrix. Hence, only methane dissolved in liquid water is observable in the mid-infrared spectrum with the spectral characteristics similar to the dissolved detergent.
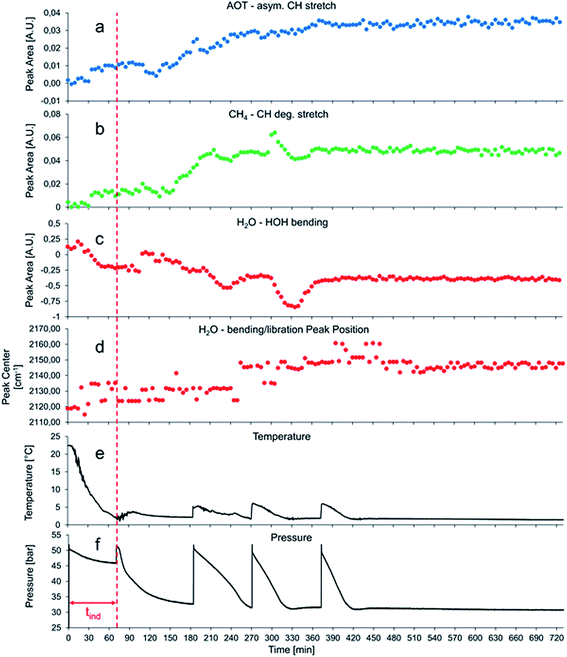
Fig. 4 shows a typical data set obtained during the first 12 h of gas hydrate growth inside the pressure vessel with 380 mg L−1 AOT dissolved in the aqueous phase. Initial hydrate formation is indicated by a pressure drop after 75 min, i.e., there are only minor spectral changes observable in the period of 0–120 min, which are mainly attributed to the decrease in temperature during that observation period. Since the temperature is only monitored in the center of the autoclave (i.e., the liquid phase), it is also conceivable that water ice is forming at the metal vessel surface during the cooling phase contributing to the spectral changes in the beginning of the experiment. Since at elevated pressure the temperature is set to +2 °C, no water ice is supposed to be present within the pressure vessel at later stages of the experiment when gas hydrate formation is observed.
After approximately 130 minutes, shortly before the pressure is raised to 50 bars for the second time (approx. 180 min), spectral features of CH4 and AOT are evolving (see Fig. 4a and b). At the same time, the integrated peak area of the H–O–H bending vibration of H2O starts to decrease. In this initial stage of gas hydrate nucleation and growth, a hydrate slurry is apparently formed, i.e., a suspension of gas hydrate particles within a liquid water matrix. Consequently, the collected IR spectra are representing a mixture of water and gas hydrate absorption features with the features of gas hydrate becoming increasingly pronounced as the experiment proceeds. After 210 and 300 min, a sharp increase of the peak area for the CH4 absorption accompanied by a briefly delayed yet significant decrease of the water absorption band (see Fig. 4b and c) is observed followed by a decrease/increase to approximately the value before the event. This event occurs approx. 30 min after repressurization during the phase of massive gas hydrate formation. This is presumably the phase when diffusive enrichment of CH4 at the surface of the optical fiber is dominating with the detergent actively transporting the non-polar guest molecules to that interface. Given the extensive formation of gas hydrate particles in immediate vicinity or directly at the optical fiber, most methane is enclathrated with its spectral characteristics blocked by the solidifying water matrix.
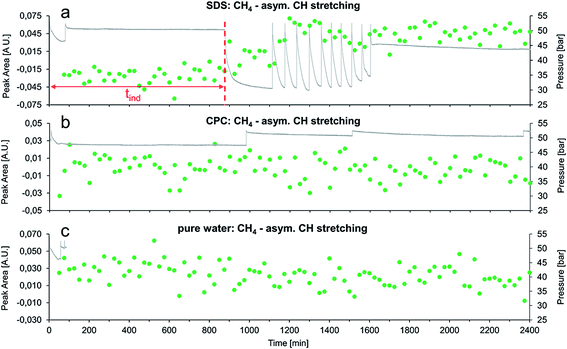
The first step of gas hydrate formation is the so-called induction time (tind), during which labile agglomeration of gas hydrate clusters occurs. Once the clusters have reached a critical size, bulk gas hydrate nucleation and growth is initiated.4,40 This massive gas hydrate formation is indicated by a sharp pressure drop within the vessel, as gas molecules are enclathrated, and thus removed from the gas phase. Since this process is exothermic, the temperature in the autoclave is rising by approx. 3–4 °C serving as the second indicator of hydrate formation, and then slowly decreasing back to 2 °C, as the thermostat cools down the vessel (see Fig. 4e). The induction time tind is marked by a red line in Fig. 4 and 5a.
Fig. 4f shows a minor decrease in pressure in the period of 0–70 min. This results from cooling of the gas hydrate autoclave from room temperature to 2 °C during the first 70 min of the experiments. Once the desired temperature was maintained, the vessel was repressurized to approx. 50 bars. Almost immediately after repressurization, gas hydrate formation was initiated, which is evident by a sharp decrease in pressure and a first albeit small increase of the temperature to 2.5 °C. The pressure decreased to approx. 32 bars, which is the lower limit of the gas hydrate phase stability conditions at 2 °C in the autoclave. At this stage of the experiment the system is in a metastable state, as no gas hydrate can be formed anymore without lowering the pressure, thus exceeding hydrate phase conditions. At this point, the system was repressurized again (at approx. 180 min), thereby initiating extensive gas hydrate formation; this procedure was repeated several times yielding evident repressurization and temperature spikes within the autoclave.
In addition to AOT, two other detergents were studied – SDS and CPC – for investigating whether the developed method enables studying the effects of different chemical additives on the gas hydrate formation characteristics. Furthermore, experiments with pure water were executed as a control.
Fig. 5 summarizes the first 40 h for experiments with SDS, CPC, and pure water via the integrated peak area of the methane asymmetric stretching vibration vs. time.
Evidently, SDS has a similar effect on the gas hydrate growth as AOT, which confirms the results obtained during our previous study.36 These experiments enable directly concluding that the accelerating effect of AOT on gas hydrate growth is significantly more pronounced than for SDS. Using AOT, the first pressure drop occurred right after the first repressurization (i.e., after approx. 75 min), while using SDS the first pressure drop was observed after approx. 870 min at otherwise similar conditions. Furthermore, the methane absorption feature evolved earlier in the AOT experiment compared to the SDS experiment (i.e., 150 min vs. 750 min), which further corroborates the more pronounced transport activity of AOT.
In both experiments, the formation rate of gas hydrates following the induction time was evaluated for the first three repressurization cycles, after gas hydrate nucleation (starting at 180 min for AOT and at 1100 min for SDS, see Fig. 4 and 5, respectively). Therefore, the total time required for the system to reach a stable pressure of approximately 31 bars after repressurization for three times was determined. In the experiment with SDS this time was 180 ± 5 minutes, in the AOT-experiment it was 187 ± 5 minutes. This indicates that the gas hydrate formation rates are approximately the same in both experiments, once nucleation has taken place.
During the experiment with CPC no gas hydrate formation at all was observed (e.g. no significant change in pressure), which was furthermore confirmed by a constant infrared absorption signal of CH4 during the entire duration of the experiments (see Fig. 5b). The same is true for the measurement with neat water. The pressure trace was only recorded for the first 85 minutes of this measurement due to malfunction of the pressure transducer, nevertheless there was no spectroscopic evident for the formation of gas hydrates (see Fig. 5c).
Mechanistic interpretation
In the present study, the mechanism of accelerated gas hydrate growth via the addition of detergents as hypothesized by our research team in 2011 was further substantiated. Furthermore, a significant step towards generalizing the proposed mechanism was established by applying another guest molecule, i.e., methane in lieu of propane, and by investigating two additional detergents next to SDS. While AOT proved an even more pronounced accelerating effect vs. SDS, CPC – a cationic detergent – did not show any accelerating effect at all.The fundamental mechanism proposed by Luzinova et al. will only be briefly summarized herein,36 focusing mainly on the observed differences for CH4 as a guest molecule, and AOT as a detergent.
AOT is considered a double-tailed surfactant, which requires lower dosage compared to SDS for the same decrease in surface tension and activity at the interface between water and hydrate.41,42 This already indicates that at the same concentration the accelerating effect on the gas hydrate formation should be higher for AOT, as observed.
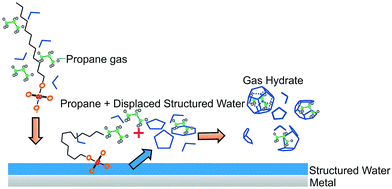
The addition of a detergent to an aqueous solution containing a non-polar compound (here, methane) renders the formation of gas hydrates entropically more favorable. The non-polar guest molecule may readily interact with the non-polar moiety of the detergent, thus establishing detergent-guest molecule associates with high affinity to available surfaces (here, the steel walls of the vessel and the surface of the silver halide fiber). Water is supposed to form structured (i.e., quasi-crystalline) layers at the surface of metals and metal oxides, which release as prestructured water cage fragments, if surface-active molecules such as detergents locally displace these water layers.43–46 As also observed during the experiments reported herein, the concentration of the guest molecule is apparently increasing in close vicinity of such surfaces due to diffusive transport of methane to the surface by the detergent. The coincidence of displacing prestructured water clusters via the surface-active detergent, while at the same time high concentrations of guest molecules are present gives rise to accelerated gas hydrate nucleation at or close to such surfaces, as schematically illustrated in Fig. 6.
A recently published study by Botimer et al. suggests that a detergent – in this case SDS – causes water to form an intermediate solid-like state consisting of ‘empty’ hydrate cages that form gas hydrate upon addition of CH4.47
In the present study, it was observed that the concentration of the guest molecule (CH4) did not decrease after nucleation, but remained at a constant level. Since the enclathration of methane in presence of AOT is occurring comparatively fast, which suggests an incomplete enclathration process in comparison to the much slower nucleation when using SDS. Therefore, a significant amount of CH4 apparently remains dissolved in the interstitial liquid water phase associated with the detergent molecules that are trapped near the fiber surface in between the hydrate particles, and thus remains detectable via IR evanescent field absorbance spectroscopy.
Compared to the data collected by Luzinova et al. on the propane/SDS system, hydrate formation in both, the methane/AOT and the methane/SDS system is significantly faster. The evolution of the C–H stretching feature of the guest molecule starts at approx. 100 h for propane/SDS, at approx. 15 h for methane/SDS, and at approx. 2 h for methane/AOT. While this may in part be a result of instrumental differences (i.e., different pressure vessel), the main reason is attributed to the different guest molecules (i.e., methane vs. propane). While their solubility during gas hydrate formation is quite similar,48,49 their diffusion coefficient in water is different by approx. 33%. Methane has a diffusion coefficient of 1.49 × 10⁻⁵ cm2 s−1 at 25 °C in water at infinite dilution, while the value for propane is 0.97 × 10⁻⁵ cm2 s−1.50 Both coefficients will be considerably lower at gas hydrates formation conditions, particularly at temperatures around 2 °C, yet with only a minor dependence on pressure.51 Therefore, it is safe to assume that the diffusion coefficient of gas-detergent associates is proportional to the diffusion coefficient of the gas itself, since SDS–propane associates will have a proportionally larger hydrodynamic radius compared to SDS–methane associates.
Furthermore, it is anticipated that the physical state of the hydrocarbon phase above the water phase influences the hydrate growth parameters. At the conditions present during the experiments shown in this study, methane remains a gas while propane is a liquid. The density of propane at the hydrocarbon/water interphase is therefore significantly higher than the density of methane. In both cases, a hydrate film is formed at the phase boundary growing into the aqueous phase, thereby depleting the hydrocarbon concentration in the aqueous phase.52–54 This induces that gas has to be redelivered to the aqueous phase by mass transfer across the phase boundary and the hydrate film. As the concentration of propane at the phase boundary is significantly higher, this film is presumably growing faster and less porous in the presence of liquid propane compared to gaseous methane. This leads to a hindered diffusion of additional propane into the water phase, and therefore the growth of bulk propane hydrate in the water phase is slower compared to bulk methane hydrate growth. This hypothesis is supported by a study of Sugaya and Mori, who grew gas hydrates with a fluorocarbon (HFC 134-a) as guest molecule, which was either liquid (by pressurization) or gaseous during the experiments. It was shown that the gas hydrate film that formed at a liquid droplet of HFC 134-a was less porous than on a gaseous bubble.55 A faster growth of methane hydrate is also supported by several studies investigating heat diffusion from the reaction site during hydrate film growth assuming that the transfer of reaction heat to the surrounding phases is the rate determining step during hydrate film growth.56,57
Finally, during the first 12 hours of the AOT experiments shown in the present study, there are two periods of exceptional methane enrichment (i.e., after 210 and 300 min) evident. At the beginning of each of these two periods, methane is enriched near to or at the fiber surface facilitating rapid gas hydrate growth while rapidly decreasing the dissolved methane concentration. This observation is again analogous to the data shown by Luzinova et al., thereby further corroborating the generic nature of the proposed mechanism.
Conclusions
In this study, a gas hydrate autoclave was modified for facilitating in situ mid-infrared fiberoptic evanescent field absorbance spectroscopy of bulk gas hydrates forming at or close to the waveguide surface. This methodology uniquely enables studying the influence of detergents on the gas hydrate formation process at a molecular level.Advanced evidence for the mechanism of accelerated gas hydrate growth via the addition of detergents was discovered revealing that AOT apparently has a similar mechanistic yet significantly more pronounced acceleration effect compared to SDS. It was also spectroscopically confirmed that a cationic surfactant – CPC – did not at all affect the gas hydrate formation. Furthermore, it was shown that the formation of gas hydrates with CH4 as guest molecules is significantly faster than for propane. The resulting incomplete enclathration of methane close to the waveguide surface enabled its IR-spectroscopic detection even during gas hydrate formation via a constant C–H stretching signal, which may only be attributed to methane dissolved in the interstitial liquid water phase dispersing the nucleated gas hydrate particles.
Next studies are anticipated investigating the formation of gas hydrates at conditions closer to real world environments, i.e., with marine sediments present within the pressure vessel for analyzing the formation of methane – and other – hydrates in the pore space of solid particles. Also, bacterial surfactants relevant at deep sea conditions may be studied in lieu of synthetic detergents, which in turn remain of substantial relevance in gas and oil pipeline scenarios.30,58 Finally, from a methodological perspective a miniaturized infrared sensor system is currently in development utilizing quantum cascaded lasers (QCLs) instead of conventional FT-IR spectrometers promising an increased intensity of the molecular signatures. The compact footprint and robustness of such laser-based IR instrumentation lends itself for in-field studies on natural gas hydrate deposits on-ship, in the deep sea, or in permafrost areas.
Acknowledgements
PSL Systemtechnik is thanked for providing a GHA200 gas hydrate autoclave for modification with a mid-infrared fiberoptic feed through system enabling in situ IR spectroscopic studies. Furthermore, the machine shop at Ulm University is acknowledged for assistance in establishing the MIR-FEFS gas hydrate setup. Partial financial support of this work by the European Union FP7 Project SCHeMA – Integrated in situ Chemical Mapping Probes (Grant Agreement Number 614002) is gratefully acknowledged.Notes and references
- T. Nakamura, T. Makino, T. Sugahara and K. Ohgaki, Chem. Eng. Sci., 2003, 58, 269–273 CrossRef CAS.
- K. A. Kvenvolden, Org. Geochem., 1995, 23, 997–1008 CrossRef CAS.
- K. A. Kvenvolden, Chem. Geol., 1988, 71, 41–51 CrossRef CAS.
- E. D. Sloan and C. A. Koh, Clathrate Hydrates of Natural Gases, CRC Press, 3rd edn, 2007 Search PubMed.
- Z. R. Chong, S. H. B. Yang, P. Babu, P. Linga and X.-S. Li, Appl. Energy, 2016, 162, 1633–1652 CrossRef.
- S.-M. Lu, Renewable Sustainable Energy Rev., 2015, 41, 884–900 CrossRef.
- H. Marín-Moreno, M. Giustiniani, U. Tinivella and E. Piñero, Mar. Pet. Geol., 2016, 71, 76–82 CrossRef.
- I. Chatti, A. Delahaye, L. Fournaison and J.-P. Petitet, Energy Convers. Manage., 2005, 46, 1333–1343 CrossRef CAS.
- Y. F. Makogon, J. Nat. Gas Sci. Eng., 2010, 2, 49–59 CrossRef CAS.
- Y. F. Makogon, S. A. Holditch and T. Y. Makogon, J. Pet. Sci. Eng., 2007, 56, 14–31 CrossRef CAS.
- H. Lee, Y. Seo, Y.-T. Seo, I. L. Moudrakovski and J. A. Ripmeester, Angew. Chem., Int. Ed., 2003, 42, 5048–5051 CrossRef CAS PubMed.
- J.-H. Yoon, T. Kawamura, Y. Yamamoto and T. Komai, J. Phys. Chem. A, 2004, 108, 5057–5059 CrossRef CAS.
- E. G. Hammerschmidt, Ind. Eng. Chem., 1934, 26, 851–855 CrossRef CAS.
- C. A. Koh and A. Sum, Natural Gas Hydrates in Flow Assurance, Gulf Professional Publishing, 2010 Search PubMed.
- P. K. Chattaraj, S. Bandaru and S. Mondal, J. Phys. Chem. A, 2011, 115, 187–193 CrossRef CAS PubMed.
- A. A. Khokhar, J. S. Gudmundsson and E. D. Sloan, Fluid Phase Equilib., 1998, 150–151, 383–392 CrossRef.
- A. Oancea, O. Grasset, E. Le Menn, O. Bollengier, L. Bezacier, S. Le Mouélic and G. Tobie, Icarus, 2012, 221, 900–910 CrossRef CAS.
- J.-P. Henriet, Gas Hydrates: Relevance to World Margin Stability and Climate Change, Geological Society of London, 1998 Search PubMed.
- M. Maslin, M. Owen, R. A. Betts, S. Day, T. D. Jones and A. Ridgwell, in Climate Forcing of Geological Hazards, ed. B. McGuire and M. Maslin, John Wiley & Sons, Ltd, 2013, pp. 250–277 Search PubMed.
- F. Rauh and B. Mizaikoff, Anal. Bioanal. Chem., 2011, 402, 163–173 CrossRef PubMed.
- M. Kraft, M. Jakusch, M. Karlowatz, A. Katzir and B. Mizaikoff, Appl. Spectrosc., 2003, 57, 591–599 CrossRef CAS PubMed.
- F. Rauh, M. Schwenk, B. Pejcic, M. Myers, K.-B. Ho, L. Stalker and B. Mizaikoff, Talanta, 2014, 130, 527–535 CrossRef CAS PubMed.
- F. Rauh and B. Mizaikoff, Anal. Methods, 2016, 8, 2164–2169 RSC.
- F. Rauh and B. Mizaikoff, Appl. Spectrosc., 2016, 70, 1214–1227 CrossRef CAS PubMed.
- N. Ando, Y. Kuwabara and Y. H. Mori, Chem. Eng. Sci., 2012, 73, 79–85 CrossRef CAS.
- H. Ganji, M. Manteghian, K. Sadaghiani zadeh, M. R. Omidkhah and H. Rahimi Mofrad, Fuel, 2007, 86, 434–441 CrossRef CAS.
- U. Karaaslan, E. Uluneye and M. Parlaktuna, J. Pet. Sci. Eng., 2002, 35, 49–57 CrossRef CAS.
- U. Karaaslan and M. Parlaktuna, Ann. N. Y. Acad. Sci., 2000, 912, 735–743 CrossRef CAS.
- K. Okutani, Y. Kuwabara and Y. H. Mori, Chem. Eng. Sci., 2008, 63, 183–194 CrossRef CAS.
- R. Rogers, G. Zhang, J. Dearman and C. Woods, J. Pet. Sci. Eng., 2007, 56, 82–88 CrossRef CAS.
- J. Verrett, D. Posteraro and P. Servio, Chem. Eng. Sci., 2012, 84, 80–84 CrossRef CAS.
- F. Wang, Z.-Z. Jia, S.-J. Luo, S.-F. Fu, L. Wang, X.-S. Shi, C.-S. Wang and R.-B. Guo, Chem. Eng. Sci., 2015, 137, 896–903 CrossRef CAS.
- Y. Zhong and R. E. Rogers, Chem. Eng. Sci., 2000, 55, 4175–4187 CrossRef CAS.
- C. Lo, J. S. Zhang, A. Couzis, P. Somasundaran and J. W. Lee, J. Phys. Chem. C, 2010, 114, 13385–13389 CAS.
- C. Lo, J. Zhang, P. Somasundaran and J. W. Lee, J. Colloid Interface Sci., 2012, 376, 173–176 CrossRef CAS PubMed.
- Y. Luzinova, G. T. Dobbs, Y. Raichlin, A. Katzir and B. Mizaikoff, Chem. Eng. Sci., 2011, 66, 5497–5503 CrossRef CAS.
- T. Shimanouchi, Tables of Molecular Vibrational Frequencies, National Bureau of Standards, 1972 Search PubMed.
- Spektroskopische Methoden in der organischen Chemie, ed. M. Hesse, H. Meier and B. Zeeh, Thieme, Stuttgart, 7. überarb. Aufl., 2005 Search PubMed.
- G. T. Dobbs, Y. Luzinova, B. Mizaikoff, Y. Raichlin and A. KatzirProceedings of the 6th International Conference on Gas Hydrates (ICGH 2008), Vancouver, British Columbia, Canada, July 6–10, 2008 Search PubMed.
- R. L. Christiansen and E. D. Sloan, Ann. N. Y. Acad. Sci., 1994, 715, 283–305 CrossRef CAS.
- D. Daniel-David, F. Guerton, C. Dicharry, J.-P. Torré and D. Broseta, Chem. Eng. Sci., 2015, 132, 118–127 CrossRef CAS.
- O. Salako, C. Lo, A. Couzis, P. Somasundaran and J. W. Lee, J. Colloid Interface Sci., 2013, 412, 1–6 CrossRef CAS PubMed.
- N. J. English and J. M. D. MacElroy, Chem. Eng. Sci., 2015, 121, 133–156 CrossRef CAS.
- M. A. Henderson, Surf. Sci. Rep., 2002, 46, 1–308 CrossRef CAS.
- V. Ostroverkhov, G. A. Waychunas and Y. R. Shen, Phys. Rev. Lett., 2005, 94, 46102 CrossRef PubMed.
- J. Zheng, W.-C. Chin, E. Khijniak, E. Khijniak Jr and G. H. Pollack, Adv. Colloid Interface Sci., 2006, 127, 19–27 CrossRef CAS PubMed.
- J. D. Botimer, D. Dunn-Rankin and P. Taborek, Chem. Eng. Sci., 2016, 142, 89–96 CrossRef CAS.
- J. Gaudette and P. Servio, J. Chem. Eng. Data, 2007, 52, 1449–1451 CrossRef CAS.
- P. Servio and P. Englezos, J. Chem. Eng. Data, 2002, 47, 87–90 CrossRef CAS.
- E. L. Cussler, Diffusion: Mass Transfer in Fluid Systems, Cambridge University Press, 2009 Search PubMed.
- W. Sachs, J. Pet. Sci. Eng., 1998, 21, 153–164 CrossRef CAS.
- E. M. Freer, M. S. Selim and E. D. Sloan, Fluid Phase Equilib., 2001, 185, 65–75 CrossRef CAS.
- Y. Ito, R. Kamakura, S. Obi and Y. H. Mori, Chem. Eng. Sci., 2003, 58, 107–114 CrossRef CAS.
- R. Ohmura, S. Kashiwazaki and Y. H. Mori, J. Cryst. Growth, 2000, 218, 372–380 CrossRef CAS.
- M. Sugaya and Y. H. Mori, Chem. Eng. Sci., 1996, 51, 3505–3517 CrossRef CAS.
- Y. H. Mori, J. Cryst. Growth, 2001, 223, 206–212 CrossRef CAS.
- T. Uchida, T. Ebinuma, J. Kawabata and H. Narita, J. Cryst. Growth, 1999, 204, 348–356 CrossRef CAS.
- S. K. Satpute, B. D. Bhawsar, P. K. Dhakephalkar and B. A. Chopade, Indian J. Mar. Sci., 2008, 37, 243 CAS.
| This journal is © The Royal Society of Chemistry 2017 |

