
 Open Access Article
 This Open Access Article is licensed under a Creative Commons Attribution-Non Commercial 3.0 Unported Licence
Novel mefenamic acid PVC membrane sensor based on a new Cd Schiff's base complex containing a phenanthroline unit
Mohammad Noroozi *ab and
Hassan Keypoura
*ab and
Hassan Keypoura
aFaculty of Chemistry, Bu-Ali Sina University, Hamedan 65174, Iran. E-mail: norouzim@ripi.ir; mo.noroozi@gmail.com; Tel: +98 83 38358077
bResearch Institute of Petroleum Industry (RIPI), Center of Kermanshah, Iran
First published on 10th August 2017
Abstract
In this study, a PVC membrane electrode modified with a Cd Schiff base complex was constructed as a novel, sensitive and selective structured carrier for checking trace amounts of mefenamic acid in real samples. A novel macrocyclic Schiff base complex ([CdL2Cl]ClO4·2H2O) was synthesized via the Cd(II) templated [1 + 1] cyclocondensation of 2,9-dicarboxaldehyde-4,7-diphenyl-1,10-phenanthroline with N-(2-aminoethyl)-1,3-propanediamine. The effects of the parameters such as working solution pH, repeatability, reproducibility, response time and selectivity to mefenamic acid were investigated. This sensor responds to mefenamic acid in the wide linear range from 1.0 × 10⁻⁹ to 4.0 × 10⁻² mol L−1 with a limit of detection of 5.01 × 10⁻⁹ mol L−1 at pH 3–8.5. The proposed sensor has a fast response time and can be applied for at least 5 months without any significant divergence in the currents.
Introduction
Mefenamic acid or (2-[(2,3-dimethylphenyl)amino]benzoic acid) (Scheme 1), is a non-steroidal anti-inflammatory drug with anti-inflammatory, analgesic and antipyretic properties. It is a member of the anthranilic acid derivatives class of NSAID drugs, and is used to treat moderate pain and is sometimes used to prevent migraines associated with menstruation.1 It is not widely used due to its side effects.2 | ||
| Scheme 1 Chemical structures of the mefenamic acid and [CdL2Cl]+. | ||
Mefenamic acid works by blocking the action of a substance in the body called cyclo-oxygenase (COX). This compound is involved in the production of various chemicals in the body, and the upregulation of prostaglandin formation, which on the other hand leads to an increase in vascular permeability, edema, hyperalgesia, pyrexia and inflammation.3
Adults are usually given 250 to 500 milligrams three times daily for short-term treatment of medical conditions such as menstrual pain, arthritis, muscle pain, tooth and headaches, post-surgical pain, and fever in children. Symptoms following acute mefenamic acid overdoses are usually limited to lethargy, drowsiness, nausea, vomiting, and epigastric pain, which are reversible with supportive care. Gastrointestinal bleeding can occur. Hypertension, acute renal failure, respiratory depression, and coma may occur but are rare. There are no specific antidotes for an overdose of mefenamic acid.4 So, there is a vital request for simple, rapid, selective and sensitive methods to determine mefenamic acid in pharmaceutical formulas and human serum samples. Several analytical methods have already been reported for the determination of mefenamic acid including potentiometric,5 flow injection analysis,6 spectrophotometry,7–11 HPLC method,12–16 stability-indicating HPTLC determination,17 different chromatographic methods such as TLC-densitometric,18 RP-HPLC-DAD method,19 spectrofluorimetry method,20 titration methods,21 electrochemical sensors,22 atomic absorption spectrometry,23 nuclear magnetic resonance spectroscopy24 and magneto carbon paste electrode.25 Electrochemical methods are preferred over optical methods because they are relatively rapid, show high sensitivity and selectivity. Recently, several methods have been used for increase selectivity, sensitivity, detection limit and other property of potentiometric sensors. For example, using of electrodes with structure of various materials such as a new synthesized Schiff base complexes have been used modifiers.26,27
Coordination chemistry of transition metal complexes with Schiff base ligands is an imperative and charming branch of chemistry. The coordination compounds containing Schiff base ligands are considerably important and play a vital role in industry, technology and life courses.28,29
The use of Schiff bases as potentiometric sensors has been done for determinations of cations and anions.30,31 Highly selective poly(vinyl chloride) (PVC) membrane electrode based on Schiff bases complexes as new carriers towards cations and anions selective electrode were reported.32–34 The compounds of 1,10-phenanthroline (phen) with different structural and chemical properties, have been studied. The metal complexes with phen-based ligands have photophysical, photochemical and catalytic properties35–37 hence, recently, they used for construction of effective luminescent materials and photoswitchable molecular devices.38
In the present work, we have prepared novel PVC membrane sensor based on the synthetic Cd Schiff base complex (Scheme 1) carrier and investigated it as a selective sensor for mefenamic acid. The reported results indicate the membranes act as a suitably selective mefenamic acid sensor.
Experimental
Reagents and materials
Mefenamic acid (MA) was purchased from Sigma-Aldrich. The pharmaceutical sample, MA capsule (250 mg, Alhavi Pharmaceutical Company, Iran), was purchased from local drug stores. Human serum was obtained from Iranian Blood Research and Fractionation Holding Company (IBRFC). Analytical grade reagents such as dibutyl phthalate (DBP), dioctyl phthalate (DOP), tris(2-ethylhexyl)phosphate (TEHP), dioctyl sebacate (DOS), bathocuproine (BCP), N-(2-aminoethyl)-1,3-propanediamine, tetrahydrofuran (THF), sodium tetraphenylborate (NaTPB), high relative molecular weight PVC were used as received from Merck or Fluka. Other reagents and solvents used were of analytical grade and obtained from Merck, Fluka or Sigma-Aldrich. All the solutions were prepared with double distilled water.Apparatus
Electrochemical measurements were performed by means of a 797 VA computerized (Metrohm). A three electrodes system was used in this work with a new Cd Schiff base complex PVC membrane containing a phenanthroline unit as working electrode, a saturated Ag/AgCl as a reference electrode and a platinum wire as counter electrode. All potentials were reported vs. the Ag/AgCl reference electrode. Metrohm pH-meter was used for pH measurements.The standard procedure of the United States Pharmacopeia (USP) employed for the assay of mefenamic acid in raw materials and the concentration of mefenamic acid in real samples utilizes a HPLC method.39 Agilent 1100 series HPLC system was used for this study which consists of degasser, binary pump, auto sampler with Rheodyne Technology, column compartment and UV/Vis detector.
The FT-IR measurements were performed using KBr disc on a Shimadzu Fourier Transform Infrared spectra (FT-IR) 8400, NMR spectra were obtained on an FT-NMR Jeol 90 MHz and the UV/Vis spectra were obtained by UV-Vis spectrometer Scinco S-2100.
Synthesis and characterization of the [CdL2Cl]ClO4·2H2O
![[double bond, length as m-dash]](https://www.rsc.org/images/entities/char_e001.gif) O), 1622 (νCNAr), 1548, 1504, 1452, 1402, 1300, 768, 708 (νCCAr). 1H NMR (CDCl3): δH = 9.61 (2H, CHO), 8.41, 7.55, 7.48, 7.32, 7.22 (14H, Ar). 13C NMR (CDCl3): δC = 189.3 (2C, CHO), 152.4, 138.2, 127.1, 115.6 (24C, Ar).
O), 1622 (νCNAr), 1548, 1504, 1452, 1402, 1300, 768, 708 (νCCAr). 1H NMR (CDCl3): δH = 9.61 (2H, CHO), 8.41, 7.55, 7.48, 7.32, 7.22 (14H, Ar). 13C NMR (CDCl3): δC = 189.3 (2C, CHO), 152.4, 138.2, 127.1, 115.6 (24C, Ar).
 | ||
| Scheme 2 Schematic step-by-step synthesis of the [CdL2Cl]+. | ||
![[thin space (1/6-em)]](https://www.rsc.org/images/entities/char_2009.gif) :H2O (3:1). The resulting solution was heated for 18–24 h (Scheme 2). The volumes of solution was reduced to 20–30 ml, then sodium perchlorate was added. The resulting precipitate was filtered. The crystalline compound was separated by slow diffusion of Et2O vapor into the MeOH/MeCN solution of the over solid (yield 0.24 g (40%)).
:H2O (3:1). The resulting solution was heated for 18–24 h (Scheme 2). The volumes of solution was reduced to 20–30 ml, then sodium perchlorate was added. The resulting precipitate was filtered. The crystalline compound was separated by slow diffusion of Et2O vapor into the MeOH/MeCN solution of the over solid (yield 0.24 g (40%)).Preparation and characterization of the 2-hydroxy ethylammonium formate (2-HEAF)
2-Amino ethanol (17.97 g, 30 mmol), was put in a round bottom flask. Then, the flask was placed in an ice bath. Under vigorous stirring, 11.4 ml of formic acid was added dropwise to the flask during 50 min and this solution was stirred for 20 h at room temperature. Then a viscous clear liquid was obtained. No crystal or solid was seen when the liquid sample was kept at 20 °C for about 1 month, according to literature the obtained ionic liquid has simple salt structure.41Preparation of membrane electrode
The general procedure to construct the membrane electrode is expressed in various papers.42–44 First, 30 mg of powdered PVC, 54 mg of plasticizer TEHP, 2.4 mg of 2-HEAF and 2.4 mg of synthetic CdL2Cl carrier fully mixed in 4.8 ml of THF. After stirring, the mixture was transferred into a glass tube with a diameter of 2 cm. The mixture was remained at room temperature for 24 h. After evaporation of the solvent an oily concentrated liquid was appeared. A Pyrex tube (3–5 mm o.d.) was also put into the mixture for a few seconds, so that a clear membrane of almost 0.3 mm thickness was formed. Then, the tube was pulled out from the mixture and retained for 24 h at the room temperature. Afterward, the tube was loaded with 1.0 × 10⁻³ mol L−1 of mefenamic acid as the internal filling solution. Eventually, the electrode was prepared by the soaking in a 1.0 × 10⁻³ mol L−1 of mefenamic acid solution overnight before to use.Preparation of pharmaceutical samples
Ten capsules of the mefenamic acid pharmaceutical sample (250 mg, Alhavi Pharmaceutical Company, Iran) were weighed accurately to obtain the average weight equivalent to one capsule. They were thinly mixed and homogenized. Equivalent to the average weight of one capsule content was accurately weighed and transferred into the glass vessel. The powder was dissolved in 10 ml of NaOH:methanol (1:9 v/v) solution and then diluted to 25 ml with the double distilled water. Absolute methanol and 0.1 mol L−1 of NaOH were used to prepare NaOH:methanol solution (1:9 v/v). This mixture was filtered. Then, by using NaNO3, its ionic strength was adjusted to 0.5 mol L−1. The pH was also kept on 4.7 ± 0.1 with a diluted solution of NaOH or HNO3 before volume completion (100 ml) and final pH adjustment was made by the acetate buffer solution. 10 ml of this solution, was used for analysis with the mefenamic acid-sensitive electrode using the standard addition method.
Preparation of human serum
1.0 ml of the human serum was diluted to 10.0 ml with the ethanol solution. This mixture was transferred into the small centrifuge tube, and the precipitated proteins were then separated by centrifugation at 5000 rpm for 20 min before analysis. Then the volume of this solution was adjusted to 25 ml by using double distilled water.45 Subsequently, the resulting serum sample was analyzed by the proposed sensor for the mefenamic acid detection.Emf measurements
Emf measurements with the membrane electrode were done by the following cell:Hg/Hg2Cl2, KCl (saturated)|internal solution mefenamic acid (1.0 × 10⁻³ mol L−1)|PVC membrane|mefenamic acid (1.0 × 10⁻³ mol L−1)|Hg/Hg2Cl2, KCl (saturated). A Metrohm 692 pH/mV meter was also used during the experiments at 25.0 ± 0.1 °C.
Results and discussion
Characterization of the [CdL2Cl]ClO4·2H2O
The FT-IR absorption spectrum of [CdL2Cl]ClO4 in the region 400–4000 cm−1 provides information about bonding in the complex. The data are corresponding with the existence of imine bond, this complex shows the ν(CN) mode at 1638.4 and 1650.3 cm−1, which is indicative the prosperous Schiff base condensation, while no bands ascribable to CO (1706 cm−1) or NH2 groups are discovered. The absorptions in the range 3259–3279 cm−1 are attributed to the symmetric ν(N–H secondary amine) stretching vibrations. The FT-IR spectra of the perchlorate salt show a strong, unsplit absorption band, focused at 1093–1106 cm−1 and a sharp band at 623 cm−1, attributed with the asymmetric Cl–O bending mode, characteristic of non-coordinated perchlorate. The 1H NMR spectrum of the complex exhibits a broad signal due to the 1H imine resonance at 8.22 and 8.33 ppm, demonstrating the non-equivalence of the 1H two imine environments. In the characteristic region of phenanthroline protons (7.53–7.75 ppm) five signals were seen. Also, aliphatic hydrogens are seen at 1.33–2.65 ppm and secondary amines proton at 2.03 ppm. The 13C NMR spectrum displays that the imine carbon atoms, 161.64 and 157.23 ppm are chemically non-equivalence. In the characteristic region the signals of aromatic ring carbons (119.21–149.11 ppm), six peaks are observed.
The results of elemental analysis of this complex, confirms the molecular formula C31H31N5Cl2O6Cd. Anal. found: C, 50.94; H, 4.10; N, 9.24. Calc. for C31H31N5Cl2O6Cd: C, 49.45; H, 4.15; N, 9.30.
Complexation study by spectrophotometric method
In order to confirm the formation of a complex between mefenamic acid and [CdL2Cl]+, electronic spectra of a solution containing a [CdL2Cl]+ (1.0 × 10⁻³ mol L−1) and the same concentration of the mefenamic acid, mefenamic acid and CdL2 each alone were obtained by UV-Vis spectroscopy (spectra CdL2/MA, MA and CdL2 in Fig. 1a, respectively).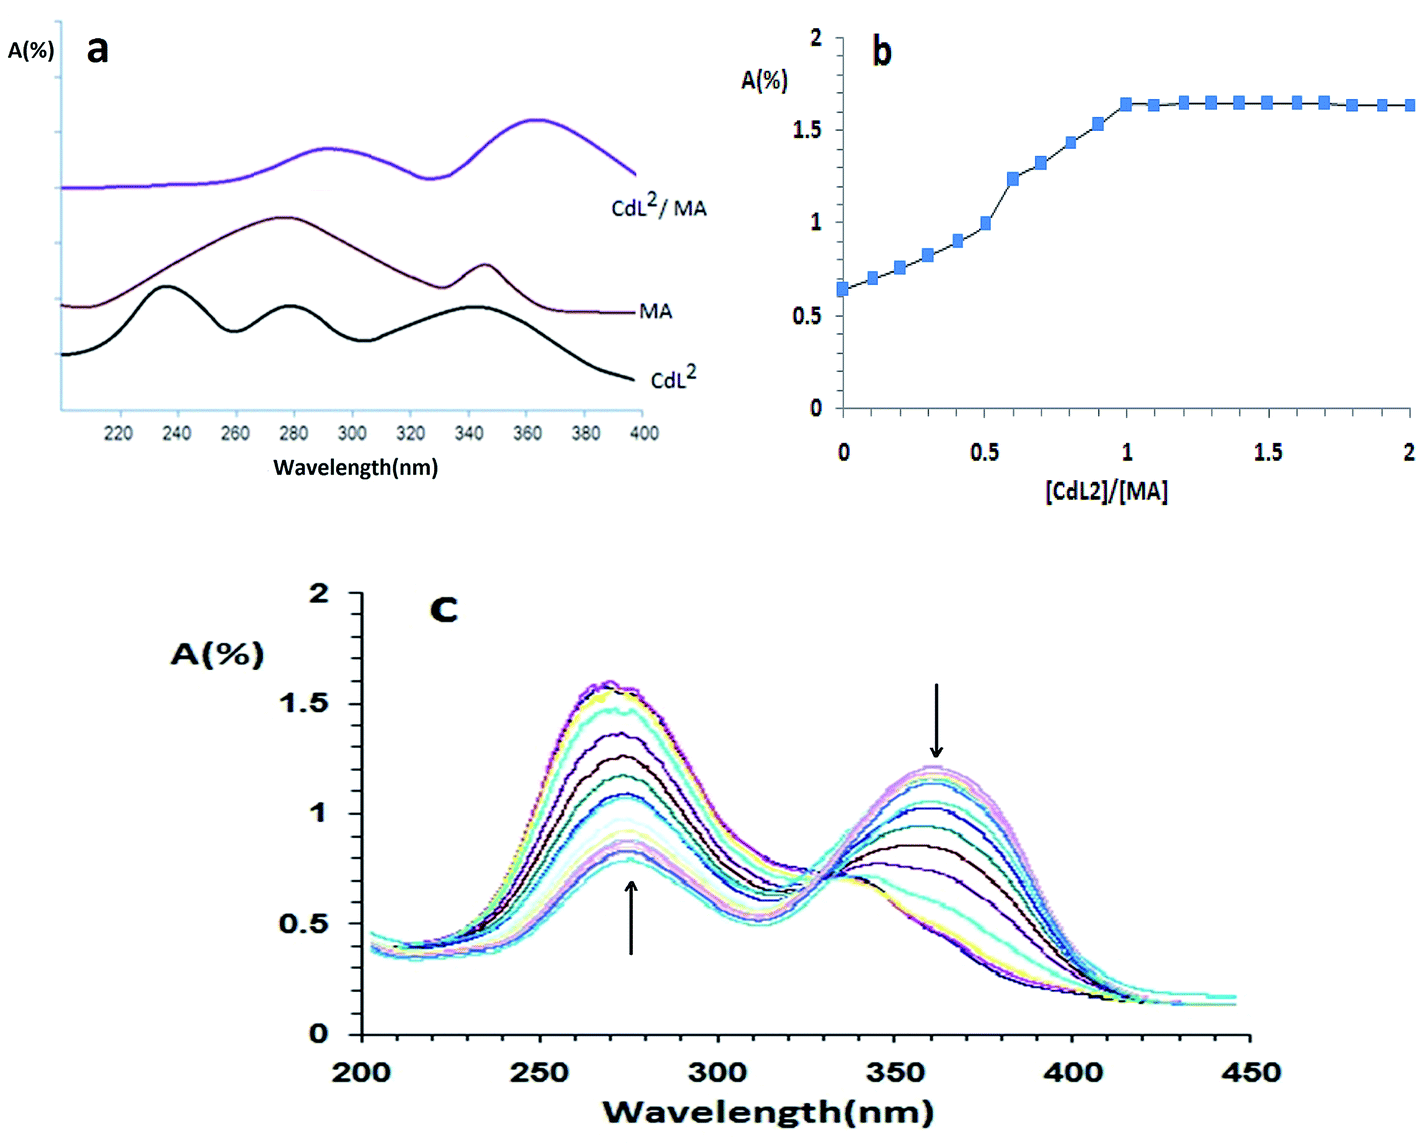 | ||
| Fig. 1 A UV-Vis absorption spectra of solutions containing a concentration of CdL2 (1.0 × 10⁻³ mol L−1) and mefenamic acid (CdL2/MA), CdL2 and mefenamic acid (MA) (a), plot of absorbance at 288 nm as function of mole ratio of [CdL2]/[MA] (b) and electronic spectra of mole ratio of [CdL2]/[MA] (c). | ||
In the electronic spectra of [CdL2Cl]+ complex, possess a series of strong absorption maxima at approximately 236, 278 and 340 nm, assigned as intra ligand phen π → π*, n → π* transition and spin-allowed metal-to-ligand charge transfer transitions (MLCT), respectively.46–48
Upon coordination this complex with mefenamic acid, there are minor changes of these bands. Compared these spectra together shows that the absorption peaks of a combination of CdL2/MA shifted to larger wavelengths (red shift) compared to the absorption peaks for CdL2.
The composition of the formed complex between [CdL2Cl]+ and MA had been established using mole ratio method49 at constant [CdL2Cl]+ concentration (1.0 × 10⁻³ mol L−1) and varying MA concentrations. The obtained mole ratio plot at a wavelength of 288 nm for mefenamic acid/[CdL2Cl]+ complex (as show in Fig. 1b and c) confirms the 1:1 complex formation. The complex formation constant at 25 °C is evaluated by the absorbance-mole ratio data, and nonlinear least-squares cure-fitting program KINFIT.50 The results show that the [CdL2Cl]+ with an appropriate formation constant (pKf = 5.37 ± 0.01), forms the stable complex with mefenamic acid. Therefore, synthetic [CdL2Cl]+ carrier was used to create the mefenamic acid membrane sensor as a selective and sensitive carrier.
Effect of the membrane composition on the response of the electrode
Certainly, it can be said that the sensitivity, linearity, and selectivity of the membrane sensor depends considerably on to the membrane ingredients, the nature of the solvent and properties of the additive and plasticizer which are employed.51,52 Therefore, it will be important to optimize of the membrane formulation and analytical parameters such as carrier, PVC, plasticizer and additive material. Thus, the influence of the amount and nature of plasticizer and amount of additive and Schiff base complex [CdL2Cl]+ on the potential response of the mefenamic acid sensor were studied. The results are shown in Table 1. This data shows that the best performance was seen for the membrane electrode no. 9 with the amounts 25, 45, 2 and 2 mg for PVC, TEHP, 2-HEAF and [CdL2Cl], respectively. For the construction of the ten electrodes, the amount of PVC which is used constant (25 mg). Since in construction of many PVC membrane electrodes a plasticizer/PVC ratio at about 2 has obtained in very characteristics,53 this ratio was hold at about 2 in the optimization of the ingredients of the proposed MA membrane electrode.| Electrode no. | Composition | Slope (mV per decade) | Dynamic range (mol L−1) | |||
|---|---|---|---|---|---|---|
| PVC (mg) | Plasticizer (mg) | Additive (mg) | CdL2Cl (mg) | |||
| 1 | 25 | 45 (DOP) | 0 | 1.0 | −23.5 ± 0.2 | 2.0 × 10⁻⁶ to 1.0 × 10⁻³ |
| 2 | 25 | 45 (DOS) | 0 | 2.0 | −32.7 ± 0.3 | 3.0 × 10⁻⁶ to 2.0 × 10⁻² |
| 3 | 25 | 45 (DBP) | 0 | 1.0 | −35.6 ± 0.5 | 2.0 × 10⁻⁵ to 3.0 × 10⁻² |
| 4 | 25 | 45 (TEHP) | 0 | 2.0 | −37.2 ± 0.6 | 1.0 × 10⁻⁴ to 1.0 × 10⁻² |
| 5 | 25 | 45 (TEHP) | 1.0 (NaTPB) | 1.0 | −36.3 ± 0.3 | 2.0 × 10⁻⁵ to 2.0 × 10⁻² |
| 6 | 25 | 45 (TEHP) | 1.0 (NaTPB) | 2.0 | −40.1 ± 0.8 | 1.0 × 10⁻³ to 1.0 × 10⁻² |
| 7 | 25 | 45 (TEHP) | 2.0 (NaTPB) | 1.0 | −40.5 ± 0.3 | 2.0 × 10⁻⁵ to 3.0 × 10⁻³ |
| 8 | 25 | 45 (TEHP) | 2.0 (NaTPB) | 2.0 | −32.7 ± 0.5 | 2.0 × 10⁻⁴ to 1.0 × 10⁻³ |
| 9 | 25 | 45 (TEHP) | 2.0 (2-HEAF) | 2.0 | −49.6 ± 0.2 | 1.0 × 10⁻⁹ to 4.0 × 10⁻² |
| 10 | 25 | 45 (TEHP) | 2.0 (2-HEAF) | 1.0 | −44.5 ± 0.5 | 1.0 × 10⁻⁶ to 3.0 × 10⁻² |
Plasticizers used in the manufacture of membrane sensors, especially PVC-based polymer, must have unique physical and chemical properties such as high lipophilicity and molecular weight, low tendency to exudation from the polymeric matrix, low vapor pressure, and high capacity to dissolve the substrate, an appropriate amount of viscosity and dielectric constant.54 As seen in Table 1, among four plasticizers of PVC electrodes (DOP, DOS, DBP, TEHP), TEHP has best sensitivity and the widest linear range of the membrane sensor based on Schiff base complex. These results show a synergism between lipophilicity and polarity of TEHP to reach an intermediate value.
The lipophilic additive salts are also required to add into the membrane compositions to decrease the ohmic resistance, response time and anionic interference of cation-selective membrane. Moreover, in order to aim to improve the performance electrodes, the use of additives may enhance the response behaviors, sensitivity, and selectivity. Additives may also catalyze the kinetic of exchange at the sample-membrane surface and increase significantly the selectivity.55 Generally, the PVC membrane electrodes (no. 1–4, Table 1) without additive used show the low Nernstian slopes. Instead adding NaTPB and 2-HEAF increase the performance of the membrane and increase the slope (Fig. 2).
 | ||
| Fig. 2 Variation of membrane potential of PVC based membranes of Schiff base with varying concentrations of MA: without plasticizer (electrode no. 3, 4), with NaTBP and HEAF (electrode no. 6, 9). | ||
Thus, NaTPB and 2-HEAF additives by reducing ohmic resistance,56 improving the response behavior, selectivity of electrode,57 catalyze the exchange kinetics at the sample-membrane interface58 and increasing the extraction capability and efficiency of ionophore lead to significant improvement in electrode response.59
As it clears from Table 1, add 2 mg of these additives have a greater performance and due to their amazing properties influence on Nernstian slope 2-HEAF more than NaTPB. This difference in performance of this additives can be due to various reasons like differences in the physical and chemical properties and causes different interactions with membrane composition. Conductivity of the 2-HEAF liquid, at room temperature is 3.3 mS cm−1 which is reasonably high. Also viscosity of the ionic liquid is highly temperature dependent, thus, this reveals that molecular mobility is mostly self-diffusive in nature. Electrochemical stability of the ionic liquid is important when redox reactions are performed in such a medium. Redox stability of the ionic liquid must be imposed by the reduction potential of the ammonium cation and oxidation potential of the formate anion. The cyclic voltammetry indicates a useful stability range of about 1.1 V (between −0.1 and +1.1 V). Those limits practically do not change after 20 times of oxidation–reduction cycle. Despite its high ionic conductivity, the liquid shows also high solvating ability for some inorganic salts and polymers. Moreover, its low melting temperature (−82.8 °C) makes the ionic liquid promising for low temperature reactions.41
This feature reduces the glass transition temperature of the polymer (Tg) that, should also be considered, which must be lower than the temperature of the room.60
Existence of carboxylate anionic and ammonium cationic sites in the membrane are probably fully protonated within the membrane phase. In contrast, however, recently suggested that some of the carboxyl sites in PVC membranes may in fact be ionized and that the tight binding of mefenamic acid to the surface of these membranes is due to electrostatic interactions between these ionic sites and the mefenamic acid. Therefore, this additive catalyze the exchange kinetics at the sample-membrane interface.61
Finally, 1 and 2 mg of the complex of Schiff base [CdL2Cl]+ as a carrier used in the manufacture of electrodes. Thus the results show that the best sensitivity and linear range was obtained for a membrane having a composition as ionophore: PVC:TEHP:2-HEAF:[CdL2Cl], 25:45:2:2, respectively. Thus, as is clear in Fig. 2 the proposed electrode (no. 9) with the percent ratio, is the best composition ratios that leads to obtain the wide dynamic concentration range (linearity range) 1.0 × 10⁻⁹ to 4.0 × 10⁻² mol L−1, the Nernstian compliance slope of 49.6 ± 0.2 mV per decade, linear response and correlation coefficient r = 0.989 and the detection limit 5.01 (±0.2) × 10−9 mol L−1 at pH = 5.2.
Effect of pH on the electrode response
The pH of the sample solution effects on the sensor selectivity and on the linear dynamic range, so pH effects are examined in most developed sensors.62,63 Hence, the sensor's potential response of the test solutions were measured in the pH 2 to 11 and the results illustrated in Fig. 3. The pH was adjusted by the concentrated HCl or NaOH on electrode number 9 in Table 1, at fixed concentration (1.0 × 10⁻³ mol L−1) of mefenamic acid. | ||
| Fig. 3 Effect of pH of the test solution (1.0 × 10⁻³ mol L−1 of mefenamic acid) on the potential response of the mefenamic acid selective electrode. | ||
As seen in Fig. 3, in the range 3.0–8.5, the potential is independent of to pH. Furthermore, some drifts in the potentials are seen. So, this pH range was considered as the working pH range of the sensor. The potential drifts, at higher pH values, may be attributed to the diffuse of hydroxyl ions into the membrane and reaction with the positive nitrogen sites in the 2-HEAF additive. At lower pH values, the observed drift is maybe attributed to the protonated form of the mefenamic acid which causes a poor interaction with the 2-HEAF additive and CdL2Cl.64 Thus, one of the benefits of the sensor made in this study is that it can be used in the pH range of biological solutions (almost neutral pH). The acetate buffer solution was employed to adjust the pH of the whole test solutions.
Response time, repeatability, reproducibility, and stability of the electrode
Dynamic response time is an significant factor for the sensitive sensor, thus in this work, the average practicable response time has been registered for the selective electrode (no. 9) by choosing a suitable concentration of the mefenamic acid (Fig. 4). To measure the response time of the proposed sensor the concentrations of the test solution has been successively changed from 1.0 × 10⁻⁹ to 4.0 × 10⁻² M. As it is seen, the dynamic response times of the membrane electrode were gained in a very short time 10 s and potentials remained constant for at least 10 min when the potentials registered from low to high concentrations and vice versa. This is most likely assign to fast exchange kinetics of complexation–decomplexation of MA with the ionophore of the test solution membrane interface. The prepared electrode could be employed for at least 50 days without observing any significant variation in response characteristics (sensors every three days, after adjustment and preparation, was used for 1 hour, then dried and kept). The results display that the average of slopes, detection limits and linear dynamic ranges are −49.4 ± 0.2 mV per decade, 5.01 (±0.2) × 10−9 (±0.02) and 1.0 (±0.1) × 10−9 to 4.1 (±0.2) × 10−2 mol L−1, respectively. The main life time factors of the proposed sensor were also checked. This prominent feature was properly due to the best lipophilicity of the ion exchange and plasticizer which results in potential stability and long lifetime of the membrane electrode. | ||
| Fig. 4 Dynamic response time of the mefenamic acid electrode for step changes in the concentration of mefenamic acid: (a) 1.0 × 10⁻² mol L−1, (b) 1.0 × 10⁻³ mol L−1, (c) 1.0 × 10⁻⁴ mol L−1, (d) 1.0 × 10⁻⁵ mol L−1, (e) 1.0 × 10⁻⁶ mol L−1, (f) 1.0 × 10⁻⁷ mol L−1, (g) 1.0 × 10⁻⁸ mol L−1 and (h) 1.0 × 10⁻⁹ mol L−1. | ||
Selectivity and interference
The selectivity is the most important characteristics, because it determines the extent of efficiency of any membrane sensor in real sample measurement. Various types of methods for the determination of selectivity coefficients of ion selective electrodes have been proposed.65 The most favorite method for the determination of selectivity coefficient is the mixed solution method (MSM).66 Nevertheless, the mixed solution method choosen since it frequently corresponds more nearly to the status in sample. In this work, several solutions are prepared with a constant activity of the mefenamic acid (1.0 × 10⁻² mol L−1) and different activity of the various interfering materials, and the potential response was recorded.The resultant values of the selectivity coefficients are shown in Table 2. The result was shown, all the coexist species such as surfactants, sugars, metal ions, anions, vitamins, amino acids were not expected to interfere on applicability of the proposed mefenamic acid-selective sensor. Therefore, no interference was observed from the presence of various interfering materials in the ratios commonly used in pharmaceutical preparations.
| Interfering | Ksel | Interfering | Ksel | Interfering | Ksel |
|---|---|---|---|---|---|
| Mg2+ | 4.31 × 10⁻⁴ | Br− | 4.25 × 10⁻⁴ | Vitamin B6 | 1.81 × 10⁻⁵ |
| Ca2+ | 3.45 × 10⁻⁴ | Cl− | 6.16 × 10⁻⁴ | Triton X-100 | 7.52 × 10⁻⁴ |
| Ni2+ | 2.19 × 10⁻³ | HPO42− | 4.11 × 10⁻⁴ | Glucose | 6.04 × 10⁻³ |
| Zn2+ | 5.11 × 10⁻³ | S2O32− | 3.21 × 10⁻⁴ | Fructose | 2.17 × 10⁻⁵ |
| Cu2+ | 5.62 × 10⁻⁴ | ClO4− | 1.91 × 10⁻³ | Lactose | 3.38 × 10⁻⁵ |
| Fe2+ | 6.48 × 10⁻³ | Benzoate | 1.51 × 10⁻⁴ | Citric acid | 1.48 × 10⁻³ |
| NO3− | 2.58 × 10⁻⁵ | Vitamin A | 1.08 × 10⁻⁵ | Oxalic acid | 2.55 × 10⁻³ |
| SCN− | 2.24 × 10⁻³ | Vitamin C | 2.36 × 10⁻⁵ | D-Argenine | 4.76 × 10⁻⁵ |
| I− | 3.40 × 10⁻³ | Vitamin E | 6.21 × 10⁻⁵ | L-Lysine | 1.38 × 10⁻⁵ |
Response mechanism of the membrane electrode
Electrodes using PVC membranes doped with complexes, including Schiff base complexes have demonstrated potentiometric anion-selectivity sequences. These deviations are caused by the direct interaction between the central metal of the membrane, active components and analyte anion and steric effect associated with the structure of the ligand. Recently, structures of various metales mefenamato complexes have been reported.67–69 As shown clearly in Fig. 2, demonstrates the suggested the coordination scheme of mefenamat with centre in Cd-Schiff base ionophore (Scheme 3). Therefore, the chance of central Cd(II) interaction with MF− is increased, resulting in high potential selectivity of the electrode based on [CdL2] towards MF−. | ||
| Scheme 3 Suggested interaction scheme of the ionophore [CdL2Cl], with meftamate ion. | ||
Analytical applications
In order to check the analytical applicability of the suggested sensors for determination of MA in real samples, membrane electrode (no. 9) has been applied for the pharmaceuticals and human serum samples by means of a standard addition method. After pre-preparation of the samples (mefenamic acid capsule and human blood), these solutions were analyzed under optimum conditions. The results are shown in Table 3. The results gained by proposed mefenamic acid-sensitive electrode highly compatible with the results gained by the official method of USP. Therefore, the sensor provides a proper alternative for the determination mefenamic acid in real samples. The recoveries of the methods were in the range of 95–104.1%.| Sample | Initial value (mg) | Found value by the proposed sensor (mg) |
|---|---|---|
| a The values of mefenamic acid in the sample.b The values of pure mefenamic acid added to the sample. | ||
| Mefenamic acid capsules (250 mg) | 250a | 247.4 ± 5.7 |
| 250a + 10b | 258.1 ± 3.4 | |
| 250a + 15b | 264.6 ± 1.2 | |
| 250a + 20b | 271.7 ± 1.4 | |
| 250a + 30b | 285.7 ± 3.2 | |
| 250a + 50b | 306.7 ± 2.5 | |
| Human blood | 0a + 20b | 20.6 ± 1.7 |
| 0a + 30b | 29.3 ± 1.4 | |
| 0a + 40b | 38.2 ± 1.2 | |
| 0a + 50b | 51.8 ± 1.7 | |
The concentration of mefenamic acid in solutions was checked by the Food and Drug Department of Tehran University of Medical Sciences with HPLC method.
The limit of detection and linear range of the proposed electrode were compared with other previously reported methods, and the results were displayed in Table 4. The result was shown, the proposed method has a wider linear range than those reported for mefenamic acid determination.
| Method | Limit of detection (ng mL−1) | Linear range (ng L−1) | Ref. |
|---|---|---|---|
| a Forced vortex assisted.b Solid phase extraction.c Cloud point extraction. | |||
| Spectrophotometry | 2160 | 10–60 | 7 |
| FVAa-LIME spectrophotometry | 3.1 | 0.01–0.9 | 70 |
| SPEb-HPLC-UV | 7 | 0.01–0.3 | 71 |
| HPLC-UV | 15 | 0.025–2 | 72 |
| CPEc-spectrofluorimetry | 9000 | 0.05–5 | 20 |
| Chemiluminescence | 51 | 0.05–6 | 73 |
| Nanowires modified carbon paste electrodes-voltammetric | 0.0014 | 0.00005–0.0009 | 74 |
| Gas-liquid chromatograph | 50 | 0.02–1.3 | 75 |
| Polymer grafted silica gel solid-phase extraction, HPLC | 0.46 | — | 76 |
| Potentiometry | 149.59 | 0.24–2410 | 77 |
| PVC membrane sensor based on Schiff base complex – potentiometry | 1.20 | 0.00024–9651.4 | This work |
As clearly shown in Table 4, the sensor which is prepared on this work, is easily compete with nanostructured sensors and its linear range and limit of detection are better than other sensors. In addition, it should be noted that the construction of the sensor is easier and low costs than nanostructured sensors.
It is necessary to mention, that in all the experiments that we worked on with the human serum, were performed in compliance with the relevant laws in Iran and institutional guidelines. These laws based on Total Quality Management (TQM) safety regulations. Clinical laboratories, due to their susceptibility to potential risks, are priorities in all activities concerning safety issues in hospitals. Total Quality Management (TQM) is a model considered by WHO for clinical laboratories safety development.78
Conclusions
In conclusion, PVC membrane electrode modified with new Cd Schiff base complex was constructed describes as a novel, sensitive and selective structured proper carrier for administrating trace amounts of mefenamic acid in real samples. The mentioned sensor is superior to nearly all reported electrodes regarding in terms of detection limit, working concentration range and wide pH range. This sensor shows reasonable reproducibility over a period of 5 months. So, the proposed sensor is an improvement over the reported electrodes such as easy preparation, low cost, wide linear concentration range, low detection limit, suitable pH range, fast response time of ∼13 s, Nernstian behavior. The high selectivity of the proposed sensor done to determine the mefenamic acid in various real samples. The unique features of sensor developed in this study compared to other previously reported methods certainly are ease of operation, simplicity, low limit of detection, appropriate response range of real examples.Acknowledgements
We are grateful to the Bu-Ali Sina University and the Ministry of Science, Research Institute of Petroleum Industry (RIPI) for their partial support of this project.References
- S. Muraoka and T. Miura, Life Sci., 2003, 72, 1897–1907 CrossRef CAS PubMed
.
- T. Pringsheim, W. J. Davenport and D. Dodick, Neurology, 2008, 70, 1555–1563 CrossRef CAS PubMed
- A. Almasirad, A. Shafiee, M. Abdollahi, A. Nearest, N. Shahrokhinejad, N. Vousooghi, S. A. Tabatabai and R. Khorasani, Med. Chem. Res., 2011, 20, 435–442 CrossRef CAS
- C. V. Winder and D. H. Kaump, Ann. Phys. Med., 1967,(suppl.), 7–49 Search PubMed
- Z. Kormosh and O. Matviychuk, Chin. Chem. Lett., 2013, 24, 315–317 CrossRef CAS
- F. A. Aly, S. A. Al-Tamimi and A. A. Alwarthan, Anal. Chim. Acta, 2000, 416, 87–96 CrossRef CAS
- A. Raza, J. Anal. Chem., 2008, 63, 244–247 CrossRef CAS
- D. Prajapati and H. Raj, Int. J. Pharm. Sci. Res., 2012, 3(10), 3766–3776 CAS
- B. R. Dhumal, K. P. Bhusari, M. H. Ghante and N. S. Jain, Indo Am. J. Pharm. Res., 2015, 5(11), 3643–3650 CAS
- A. Niazi, M. D. Torkman and N. Khorshidi, Journal of Nanoanalysis, 2015, 02, 46–56 Search PubMed
- Z. A. Kormosha, O. Y. Matviichuk and Y. R. Bazel, J. Anal. Chem., 2014, 69(10), 960–964 CrossRef
- H. B. Sadeghi, H. A. Panahi, M. Mahabadi and E. Moniri, Iran. J. Pharm. Res., 2015, 14, 765–773 CAS
- M. R. Rezaei kahkha, M. Kaykhaii, M. Shafii-afrani and Z. Sepehri, Anal. Methods, 2016, 8, 5978–5983 RSC
- B. R. Dhumal, K. P. Bhusari, M. R. Tajne, M. H. Ghante and N. S. Jain, J. Appl. Pharm. Sci., 2014, 4(12), 060–064 Search PubMed
- N. H. Binhashim and M. M. Hammami, European Journal of Pharmaceutical and Medical Research, 2016, 3(71), 6–21 Search PubMed
- F. F. Al-Qaim, M. P. Abdullah, M. R. Othman and W. M. A. Wan Mohd Khalik, Int. J. Chem. Sci., 2014, 12(1), 62–72 CAS
- S. F. Saleh, S. M. Dereaya and M. A. Omar, Int. J. Chem. Anal. Sci., 2014, 5(1), 55–60 CAS
- H. Rivai, W. K. Putri and F. Armin, J. Chem. Pharm. Res., 2016, 8(1), 565–570 CAS
- M. M. Morcoss, N. S. Abdelwaha, N. W. Ali and M. T. Elsaady, J. Chromatogr. Sci., 2017, 1–7 Search PubMed
- A. B. Tabrizi, Bull. Korean Chem. Soc., 2006, 27, 1199–1202 CrossRef CAS
- N. P. Kobzar, S. G. Isajev, O. M. Ovechnikova and O. O. Pavlij, J. Org. Pharm. Chem., 2006, 4, 67–70 CAS
- M. Hasanzadeha, N. Shadjoub, L. Saghatforoushc and J. Ezzati, Colloids Surf., B, 2012, 92, 91–97 CrossRef PubMed
- M. Y. Khuhawar, T. M. Jehangir and F. M. A. Rind, J. Chem. Soc. Pak., 2001, 23, 226–228 CAS
- S. Husain, M. Kifayatullah and R. Sekar, Indian J. Chem. Technol., 2001, 8, 191–194 CAS
- T. Madrakian, E. Haghshenas, M. Ahmadi and A. Afkhami, Biosens. Bioelectron., 2015, 68, 712–718 CrossRef CAS PubMed
- S. X. Santos and E. T. G. Cavalheiro, J. Braz. Chem. Soc., 2014, 25, 1071–1077 Search PubMed
- A. A. Jimoh, A. Helal, M. N. Shaikh, A. Aziz, Z. H. Yamani, A. A. Ahmed and J. P. Kim, J. Nanomater., 2015, 7 Search PubMed
- R. Peng, D. Li, T. Wu, X. P. Zhou and S. W. Ng, Inorg. Chem., 2006, 45, 4035–4046 CrossRef CAS PubMed
- W. K. Dong, Y. X. Sun, Y. P. Zhang, L. Li, X. N. He and X. L. Tong, Inorg. Chim. Acta, 2006, 362, 117–124 CrossRef
- M. R. Ganjali, T. Poursaberi, M. Hosseini, M. Salavati-Niasari, M. Yousefi and M. Shamsipur, Anal. Sci., 2002, 18, 289–292 CrossRef CAS PubMed
- M. R. Ganjali, M. R. Pourjavid, M. Rezapour, T. Poursaberi, A. Daftari and M. Salavati-Niasari, Electroanalysis, 2004, 16, 922–927 CrossRef CAS
- A. K. Gupta, A. K. Singh, S. Sameena and B. Gupta, Anal. Chim. Acta, 2006, 566, 5–10 CrossRef
- M. Shamsipur, M. Yousefi, M. Hosseini and M. R. Ganjali, Anal. Lett., 2001, 34, 2249 CrossRef CAS
- M. H. Mashhadizadeh, A. Mostafavi, H. Allah-abadi and I. Sheikhshoai, Sens. Actuators, B, 2006, 113, 930–936 CrossRef CAS
- C. R. Luman and F. N. Castellano, in Comprehensive Coordination Chemistry, ed. J. A. MCleverty, T. J. Meyer and A. B. P. Lever, Elsevier, Oxford, UK, 2004, vol. 1, p. 25 Search PubMed
- J. Bossert and C. Daniel, Coord. Chem. Rev., 2008, 252, 2493–2503 CrossRef CAS
- A. L. Cambot, M. Cantuel, Y. Leydet, G. Jonusauskas, D. M. Bassani and N. D. McClenaghan, Coord. Chem. Rev., 2008, 252, 2572–2584 CrossRef
- Y.-N. Chen, Y. Fan and J. Ni, Dalton Trans., 2008, 573–581 RSC
- United States Pharmacopeia National Formulary, USP 26, NF 21, Rockville, 2003, p. 1141 Search PubMed.
- C. J. Chandler, L. W. Deady and J. A. Reiss, J. Heterocycl. Chem., 1981, 18, 599–605 CrossRef CAS
- N. Bicak, J. Mol. Liq., 2005, 116, 15–18 CrossRef CAS
- S. Chandra, A. Malik, P. K. Tomar, A. Kumar and S. Sadwal, Anal. Bioanal. Electrochem., 2011, 3, 379–392 Search PubMed
- S. Chandra, P. K. Tomar, I. Singh, A. Kumar, A. Malik and A. Singh, J. Indian Chem. Soc., 2011, 88, 1739–1744 Search PubMed
- P. K. Tomar, S. Chandra, A. Malik and A. Kumar, Anal. Bioanal. Electrochem., 2011, 3, 119–133 Search PubMed
- Y. L. Hao, Vox Sang., 1979, 36, 313–320 CrossRef CAS PubMed
- S. F. Mason, Quart. Rev., 1961, 15, 287 RSC
- J. N. Murrell, The theory of the electronic spectra of organic molecules, Methuen, London, 1963, p. 91 Search PubMed
- H. H. Jaffe and M. Orchin, Theory & Applications of Ultraviolet Spectroscopy, John Willy, N. Y., 1962, p. 287 Search PubMed
- M. Shamsipur and J. Ghasemi, J. Coord. Chem., 1995, 36, 183–194 CrossRef
- V. A. Nicely and J. L. Dye, J. Chem. Educ., 1971, 48, 443 CrossRef
- M. Shamsipur, M. Javanbakht, M. R. Ganjali, M. F. Mousavi, M. V. Lippolis and A. Garace, Electroanalysis, 2002, 14, 1691–1698 CrossRef CAS
- S. Amarchand, S. K. Menon and Y. K. Agrawal, Electroanalysis, 2000, 12, 522–526 CrossRef CAS
- T. Rosatzin, E. Bakker, K. Suzuki and W. Simon, Anal. Chim. Acta, 1993, 280, 197–208 CrossRef CAS
- E. Bakker, P. Bühlmann and E. Prestsch, General Characteristics, Chem. Rev., 1997, 97, 3083–3132 CrossRef CAS PubMed
- T. Masadome, J. G. Yang and T. Imato, Microchim. Acta, 2004, 144, 217–220 CrossRef CAS
- M. Shamsipur, A. Soleymanpour, M. Akhond, H. Sharghi and A. R. Hasaninejad, Sens. Actuators, B, 2003, 89, 9–14 CrossRef CAS
- J. Janata, M. Josowicz, P. Vansek and D. Devaney, Anal. Chem., 1998, 70, 179R–208R CrossRef CAS
- B. Rezaei, S. Meghdadi and V. Nafisi, Sens. Actuators, B, 2007, 121, 600–605 CrossRef CAS
- P. Kane and D. Diamond, Talanta, 1997, 44, 1847–1858 CrossRef CAS PubMed
- A. Vandenberg and D. N. Reihoudt, Anal. Chem., 1993, 59, 2827–2829 CrossRef
- S. C. Ma, N. A. Chaniotakis and M. E. Meyerhoff, Anal. Chem., 1988, 60(20), 2293–2299 CrossRef CAS PubMed
- V. A. Ensafi and M. Fouladgar, Sens. Actuators, B, 2009, 136, 326–331 CrossRef
- A. A. Ensafi and M. Fouladgar, Sens. Actuators, B, 2006, 113, 88–93 CrossRef CAS
- A. Morales-Bahnik, R. Czolk, J. Reichert and H. Ache, Sens. Actuators, B, 1993, 13, 424–426 CrossRef CAS
- M. B. Gholivand, A. Babakhanian, H. Derakhshi, S. Najafi, M. Joshaghani, A. Eshghi and S. Farajie, Sens. Lett., 2012, 10, 1–6 CrossRef
- V. P. Y. Gadzekpo and G. D. Christian, Anal. Chim. Acta, 1984, 164, 279–282 CrossRef CAS
- L. Tabrizi, H. Chiniforoshan, P. M. Ardle, M. Ebrahimi and T. Khayamian, Inorg. Chim. Acta, 2015, 432, 176–184 CrossRef CAS
- M. Edrissi, N. Razzaghi Asl and B. Madjidi, Turk. J. Chem., 2008, 32, 505–519 CAS
- J. Feng, X. Du, H. Liu, X. Sui, C. Zhang, Y. Tang and J. Zhang, Dalton Trans., 2014, 43, 10930–10939 RSC
- M. Hashemi, P. Zohrabi and M. Torkejokar, Sep. Purif. Technol., 2017, 176, 126–133 CrossRef CAS
- F. Rezaei, Y. Yamini, M. Moradi and B. Ebrahimpour, Talanta, 2013, 105, 173–178 CrossRef CAS PubMed
- M. R. Rouini, A. Asadipour, Y. H. Ardakani and F. Aghdasi, J. Chromatogr. B: Anal. Technol. Biomed. Life Sci., 2004, 800, 189–192 CrossRef CAS
- F. A. Aly, S. A. Al-Tamimi and A. A. Alwarthan, Anal. Chim. Acta, 2000, 416, 87–96 CrossRef CAS
- L. Liu and J. Song, Anal. Biochem., 2006, 354, 22–27 CrossRef CAS PubMed
- S. A. Bland, J. W. Blake and R. S. Ray, J. Chromatogr. Sci., 1976, 14, 201–203 CrossRef CAS PubMed
- H. B. Sadeghi, H. A. Panahi, M. Mahabadi and E. Moniri, Iran. J. Pharm. Res., 2015, 14(3), 765–773 CAS
- A. O. Santini, H. R. Pezza and L. Pezza, Sens. Actuators, B, 2007, 128, 117–123 CrossRef CAS
- WHO, Laboratory Quality Management System training toolkit: handbook, WHO Lyon Office, Lyon, France, 2009, pp. 14–28 Search PubMed
| This journal is © The Royal Society of Chemistry 2017 |