
 Open Access Article
 This Open Access Article is licensed under a
 Creative Commons Attribution 3.0 Unported Licence
Slipdisc: a versatile sample preparation platform for point of care diagnostics†
I. Banerjee a,
T. Saliha,
H. Ramachandraiaha,
J. Erlandssonb,
T. Petterssonb,
A. C. Araújoc,
M. Karlssonc and
A. Russom*a
a,
T. Saliha,
H. Ramachandraiaha,
J. Erlandssonb,
T. Petterssonb,
A. C. Araújoc,
M. Karlssonc and
A. Russom*a
aDivision of Proteomics and Nanobiotechnology, Science for Life Laboratory, KTH Royal Institute of Technology, Stockholm, Sweden. E-mail: aman.russom@scilifelab.se; Tel: +46 8790 9863
bFibre and Polymer Technology, Wallenberg Wood Science Centre, KTH Royal Institute of Technology, Stockholm, Sweden
cCalmark Sweden AB, Stockholm, Sweden
First published on 12th July 2017
Abstract
We report a microfluidic sample preparation platform called “Slipdisc” based on slipchip technology. Slipdisc is a rotational slipchip that uses a unique hand-wound clockwork mechanism for precise movement of specially fabricated polycarbonate discs. In operation, the microchannels and microchambers carved on the closely aligned microfluidic discs convert from continuous filled paths to defined compartments using the slip movement. The clockwork mechanism introduced here is characterised by a food dye experiment and a conventional HRP TMB reaction before measuring lactate dehydrogenase (LDH) enzyme levels, which is a crucial biomarker for neonatal diagnostics. The colorimetry based detection of LDH was performed with an unmodified camera and an image analysis procedure based on normalising images and observing changes in red channel intensity. The analysis showed a close to unity coefficient of determination (R2 = 0.96) in detecting the LDH concentration when compared with a standard Chemical Analyser, demonstrating the excellent performance of the slipdisc platform with colorimetric detection. The versatile point of care sample preparation platform should ideally be suited for a multitude of applications at resource-limited settings.
1 Introduction
A point of care (POC) device can go a long way in addressing the needs of fast and accurate diagnostics for neonates specially in resource limited settings (RLS). It is extremely crucial to develop such a device for RLS as more than a million babies die the world over within the first few hours in the absence of proper diagnostics and subsequent treatment.1 Several biomarkers have been recently identified as indicators for neonatal diseases and the early detection of such biomarkers can help save several new lives.2 Amongst these, LDH present in blood plasma is a crucial biomarker offering clinical benefits for several respiratory and metabolic disorders in new-borns e.g., intensive care needs,3 transient tachypnea,4 necrotizing enterocolitis (NEC),5 and asphyxia.6,7 However, a robust POC sample preparation device for LDH detection is missing.A POC device aimed for usage in RLS has to significantly simplify and minimize the amount of sophisticated instrumentation required. To date, significant progresses have been made in miniaturization and simplification of biological experiments in the form of centrifugal microfluidics based,8–11 microtiter plate based,12,13 lateral flow assays,14 and more recently slipchip based systems.15–21 Valve based systems need external electrical actuators and pumps to control the flow of liquid. Centrifugal microfluidic devices based on polycarbonate (PC) materials have significantly simplified the operation and manufacturing of valve based systems. However, centrifugal microfluidics require power sources to operate and high precision mechanics for flow control and detection. Microtiter plate based devices suffer from inherent deficiencies in storing samples for longer periods of time as they are open microfluidic systems and unsuitable for POC unless the tests are carried out in laboratories.
The slipchip technique can be a suitable answer to such a demand as it has proven to be a reliable technique for multiplexed manipulation of liquids in nanoliter volumes, involving minimum external power sources and no external pumps and valves.15 Slipchip is based on slipping sample volumes in a series of alternately positioned top and bottom wells forming a continuous channel. The linear or rotational slip movement brings the sample in contact with reagents. However, the currently available slipchip devices are not disposable, as they have been mainly made of glass, imposing high fabrication cost due to usage of cleanroom facilities. PDMS based slipchip devices are rather difficult to manufacture in large scale because of the long curing times of PDMS substrate, manual handling of thin elastomeric materials and absence of robust bonding methods of PDMS to glass.22 Also, hydrophobic, therapeutic and fluorescent molecules have a tendency to diffuse in PDMS walls reducing the accuracy, reproducibility and consistency of PDMS made diagnostic devices as well as the possibility of storing reagents in them for longer times.16 Microfluidic devices on waxed paper unlike PDMS devices are much easier to manufacture and have been developed using slipchip technology.16 However, paper microfluidics generally suffer from their inherent limitations on sensitivity and detection which may make it less useful for a broad range of analytes used in immunoassays.23
We report a versatile clockwork based device called “Slipdisc” that is based on the rotational slipchip technology. The novelty of the device is a unique hand-winded clockwork mechanism for locking the slipdisc in position which helps to carry out precise and controlled movements for every step of a bioassay. The manufacturing process does not need cleanroom facilities as it is needed for expensive glass fabrication but instead relies on commercially available polycarbonate optically transparent disc layers that significantly reduces the fabrication times to less than an hour, reduces the cost and makes it easily disposable after one time usage. The slipdisc as a closed system is suitable for long term storage and carrying out microliter to nanoliter volume biological reactions in solution phase. We characterise the clockwork slip mechanism by demonstrating the mixing of two food dyes and a bioassay involving reaction of three different concentrations of horseradish peroxidase (HRP) enzyme with tetramethylbenzidine (TMB) substrate.
We use the slipdisc to detect sensitive levels of lactate dehydrogenase enzyme (LDH) in blood plasma. The possibility of using the slipdisc as a multiplex, low-cost and easy to use point of care device that can detect LDH levels goes a long way in diagnosis of critical illnesses in new-borns at the onset of clinical signs and can significantly reduce new-born mortality rate.
2 Methods and materials
Slipdisc apparatus
The slipdisc is based on a clockwork mechanism, especially designed to allow for the sequential rotation of the top holder in relation to its bottom counterpart. The apparatus consists of a top plexiglass holder having mini-grooves along its circumference and a bottom plexiglass holder maintained with four clocksprings. The clocksprings are initially engaged in the mini-grooves and the clockwork is in a semi locking position. The clockwork is unlocked by applying a minimal twisting force and rotating the top holder successively. In the release state, the top holder is rotated from one groove to the next, activating the locking mechanism by engaging the next clockspring to the mini-groove (Fig. 1).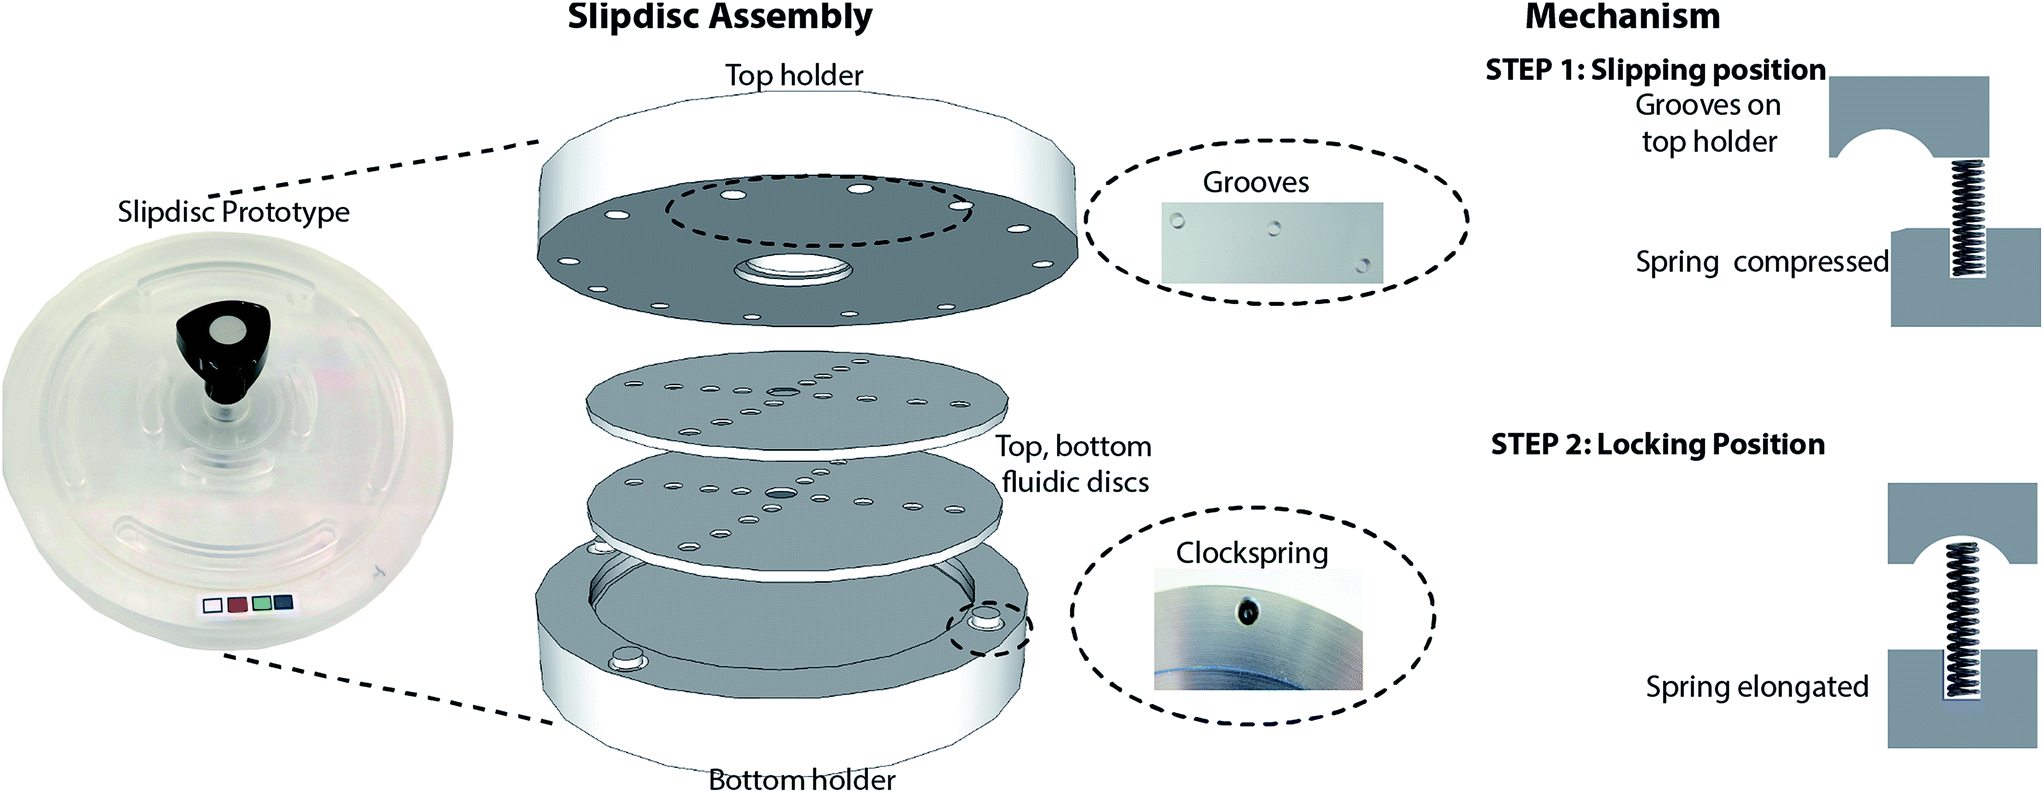 | ||
| Fig. 1 Schematic representation of assembly of mechanism of the slipdisc. The apparatus includes a top and a bottom holder and two rotational discs, with clockwork grooves on the top holder and clock springs at the bottom holder. At step 1 the spring is locked to the groove (at the top holder) followed by step 2 which is the slipping step and the spring is fit into its slot until it becomes fully expanded when it finds the next groove on the top holder. | ||
The top and bottom discs are placed on the bottom holder which has a slot cut out to accommodate the discs. During assembly, first a bottom disc superhydrophobically coated is placed on the bottom holder slot and a thin layer of inert mineral oil HFE 7100 is spread evenly over it. Next, a superhydrophobically coated top disc is aligned carefully with the bottom disc and due to capillary effect the thin oil uniformly spreads between the discs. The thin oil film successfully eliminates the air bubbles possibly developed in the course of alignment. The top holder is mounted and locked through the same slot previously used to secure the bottom holder and the discs. The samples are loaded via apertures cut out on the top holder when the discs are placed onto their positions and the clockwork is engaged or in locked position (Fig. 1). A fluidic path is established along a hydrophilic channel between the two discs.
Polycarbonate disc fabrication
The top and bottom discs are optically transparent polycarbonate discs purchased from Axxicon. Two different PET films (3M 90775 80 μm thick and 3M 9019 14 μm thick) were first laser cut to design an alternating or continuous pattern of top and bottom wells. They were then bonded to the discs using a custom made bonding machine. The top disc was drilled to generate 1 mm holes at the start and end of the fill up channel to facilitate sample pipetting into the hydrophilic channel between the two superhydrophobically coated discs. The overall manufacturing time of a pair of the disposable discs was less than fifteen minutes. Two different characterisation experiments were carried out to demonstrate the functionality of the clockwork mechanism in performing biological assays. The designs on the discs were based on the volume of substrate needed to react with the sample volume. The first design used for characterising the device (Fig. 2), involves a series of alternating wells on the top and bottom discs acting as bridges in connecting each other based on the slipchip technology. A second design (ESI Fig. S1†) is used for carrying out the LDH assay and requires an unequal ratio of the samples reacting to the dried reagents coated on the bottom disc. The height of the wells in the bottom are less than the height of the wells on the top disc which also significantly reduce the wasted samples compared to previously reported slipchip microfluidic devices.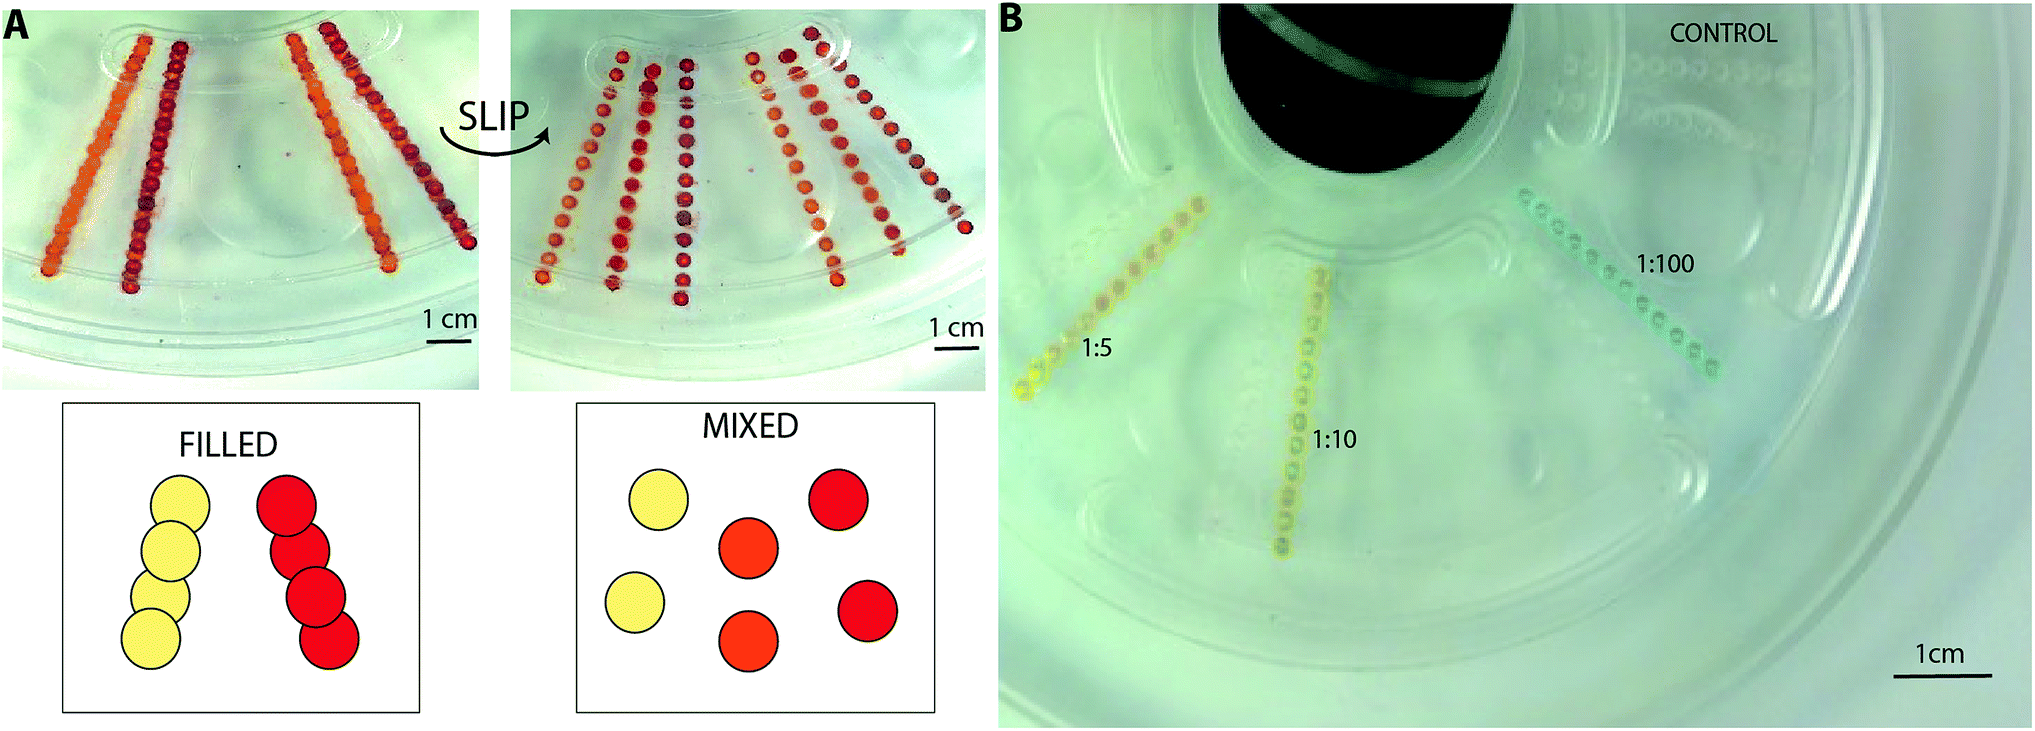 | ||
Fig. 2 Two step characterisation of the slipdisc: (A) schematic representation of the filling and mixing process and characterisation with the food dyes are filled first in a series of alternating wells forming a continuous path on the bottom and top discs. A slip step compartmentalizes the wells and the reagents on the top wells are mixed with reagents in the bottom wells. (B) Characterisation with a two-step enzymatic bioassay using the same principle to (A). Three different concentrations of the HRP enzyme to PBS solution (1![[thin space (1/6-em)]](https://www.rsc.org/images/entities/char_2009.gif) :5, 1:10, and 1:100) reacting with the TMB substrate with a single click step and producing three different colors. A control solution with no HRP enzyme produces no colour. :5, 1:10, and 1:100) reacting with the TMB substrate with a single click step and producing three different colors. A control solution with no HRP enzyme produces no colour. | ||
Superhydrophobic coating
The super hydrophobic coating on the films/discs were produced with Alkyl Ketene Dimer (AKD) according to a semi-continuous rapid expansion from supercritical solutions (RESS) method with some small modifications.24 In brief, approximately 2 g of AKD (purchased from EKA Chemicals Bohus, Sweden) was placed in a pressure cell followed by the pre-heating cell, nozzle and heated to 70 °C, and 90 °C respectively. Upon reaching the set temperatures the pump was filled with CO2 (purchased from Strandmöllen AB, Ljungby, Sweden) and pressurized to the working pressure of 25 MPa. The valves connecting the chamber to the pump were opened and the chamber was filled with scCO2. As the scCO2 entered the chamber it dissolved AKD which was transported in the scCO2 from the cell to the nozzle where the scCO2 expanded and the AKD precipitated and was deposited on the surface. The polycarbonate discs are located under the nozzle when the steady state spraying condition is obtained. In order to achieve an uniform coating the discs were rotated at a constant rotational speed. The contact angles of the coated surface as well as uncoated surface was performed with a 2 megapixel portable USB microscope with adjustable focal length (Acquiris ACQ-USB2MAG200, Sweden).HRP and LDH assay
We assessed the capability of the slipdisc to perform a colorimetric assay using two bioassays and a food dye based experiment. The first bioassay involved peroxidase from horseradish (HRP) enzyme (Sigma Aldrich, USA) reacting with 3,3′,5,5′-tetramethylbenzidine (TMB) substrate (Sigma Aldrich, USA). Three different ratios (1:5, 1:10 and 1:100) of HRP enzyme were prepared by diluting HRP with phosphate buffered saline solution (PBS). The second bioassay was based on LDH chemistry developed for use in neonates (Calmark AB; Karlstad, Sweden). The in-house developed colorimetric LDH assay is optimized to take plasma sample and deliver quantitative colorimetric detection. In this work, the LDH detection reagents were immobilized on the disc reaction wells and upon exposure to the sample, the developed color is detected. In order to construct a standard curve for the LDH enzyme, heparinized plasma samples were spiked with 6 different concentrations of the LDH enzymes (supplied by Lee Biosolutions, USA) that ranged from clinically normal to abnormal concentrations. The final concentration in each plasma sample is verified via reference method using the Beckman Coulter Chemical Analyzer (USA), AU480, at an accredited laboratory at the department of Clinical Chemistry, Karolinska Hospital, Solna, Sweden. Phosphate buffered saline (PBS) is mixed with the LDH reagents and used as a negative control for the assay. The designed wells were filled with LDH detection reagents (CALMARK AB; Karlstad, Sweden) and dried at the room temperature for 30 minutes in a clean, dust-free area. Each plasma sample was mixed with different concentrations of LDH substrate detection reagents in a ratio of 1:5 (LDH to plasma ratio). This also needed the top disc to be designed in such a way that it can hold higher volumes of liquid compared to the bottom one as shown in ESI section (Fig. S1).† The depth or thickness of the wells on the top disc was five times higher than the bottom disc wells (3M 90775 80 μm thick for top and 3M 9019 14 μm thick carrier tapes for bottom). Phosphate buffered saline (PBS) is mixed with the LDH reagents and used as a negative control for the assay. The ability of LDH to convert lactate to pyruvate is measured in the presence of nicotinamide-adenine dinucleotide (NAD+). The initial rate of NADH oxidation is directly proportional to LDH activity in the sample. The presence of LDH in the sample causes a purple colour to develop, due to the formation of formazan from the chromogenic Nitro Blue Tetrazolium (NBT) (ESI Fig. S3†).
Imaging
The images were taken with a commercially available camera Canon Powershot G16 for analysis. The lighting conditions were supposed to be uniform through out the process and minor variations that occurred were compensated by an image normalisation technique as explained later in Section 3. The color development of the LDH assay takes place where the plasma in the top well comes in contact with the dried reagent in the bottom well, which is the overlapping area of the top and bottom wells. The image processing is only carried out for this overlapping area. The red (R), green (G) and blue (B) intensity values were chosen from hundreds of selected points in the overlapping area before averaging them to attain the final mean values. This process was repeated for each of the 6 wells for a single concentration of LDH. Finally, a mean value of each of R, G and B channels were obtained after averaging all the values from the wells. The image processing and data analyses, including linear regression correlation, were conducted using Matlab software (Mathworks, Natick, MA) along with its Image processing toolbox.3 Results and discussion
Device and PC discs characterisation
We evaluated the performance of the slipdisc platform in terms of its capability to carry out bioassays with colorimetric detection. The slipdisc was filled with two food dyes using two pipettes (one containing the food dye and the other applying suction force) in order to enable uniform loading and avoid leaking the substrate between the top and the bottom discs. The two dyes are forming different continuous paths due to series of alternating wells carved on the top and the bottom discs. A single slip disconnects this path and vertically positions the wells filled with red colors over yellow color wells in the bottom, which leads to color mixing due to diffusion. This results in three series of wells containing orange, red and yellow colors as shown in Fig. 2. Further to show the slipdisc functionality for carrying out bioassays, we demonstrate the reaction of three different concentrations of HRP enzyme to TMB substrate to produce distinctly different colors that can be used in a colorimetric assay.The contact angle measurements carried out showed that the superhydrophobic coating with AKD yields a contact angle equal to 150 degree. Table 1 below shows the contact angles for the various surfaces used, i.e. polyethylene terephthalate (PET) film, polycarbonate (PC), coated PET surface, polycarbonate surface with coating removed.
| Material | Coating | Contact angle (degrees) |
|---|---|---|
| Polycarbonate | No | 66 |
| PET | No | 67 |
| Coated PC | Superhydrohobic | 150 |
In order to make hydrophilic channels on the surface of the coated discs for sample insertion, a metal drill is manually scratched slowly to remove the superhydrophobic coating from the wells surface on the discs. When the superhydrophobic material is removed from the wells, the surface becomes hydrophilic again, i.e. a contact angle less than 90 degrees.
Colorimetric LDH assay
The slipdisc is designed to carry out diagnostic assays with the aid of commercial smartphones or cameras or any device that is sensitive to red, green and blue values. The images are captured in specific intervals and are processed via a computer or a smartphone and using a Matlab code especially developed as explained in the Imaging section.The slipdisc was used to conduct the LDH assay and the images of the colours developed in the wells were processed using an image processing technique that only considered the red channel (R) intensity as shown in Fig. 3. The R intensity was chosen for subsequent analysis due to its higher correlation coefficient with a change in concentration of LDH. The images were captured at different times after slipping, using a Canon PowerShot G16 camera (12.1 megapixel, 6.1–30.5 mm). Fig. 3 compares the normalized red color intensity for different times i.e., 1, 5, 10 and ≥15 minutes. The experiments show that the colour. development process stabilizes approximately after 10 minutes and the following colour changes are insignificant after 10 minutes. Two pipettes are used in the process of loading the samples into the slipdisc, one contains the plasma sample and the other is used to gently apply suction at the other end so that the sample goes in smoothly with out any turbulence. Fig. 4A shows the slipdisc where the samples are loaded in a channel adjacent to the wells previously coated with the dried reagenT. Fig. 4B shows the fully developed color (i.e., due to formation of formazan) at six different concentrations of LDH in plasma starting from the control sample with a very low concentration of 96 U L−1 to very high concentration of 1830 U L−1. This is followed with a slip leading to color formation and depending on the concentration of LDH in plasma, different shades of color are produced.
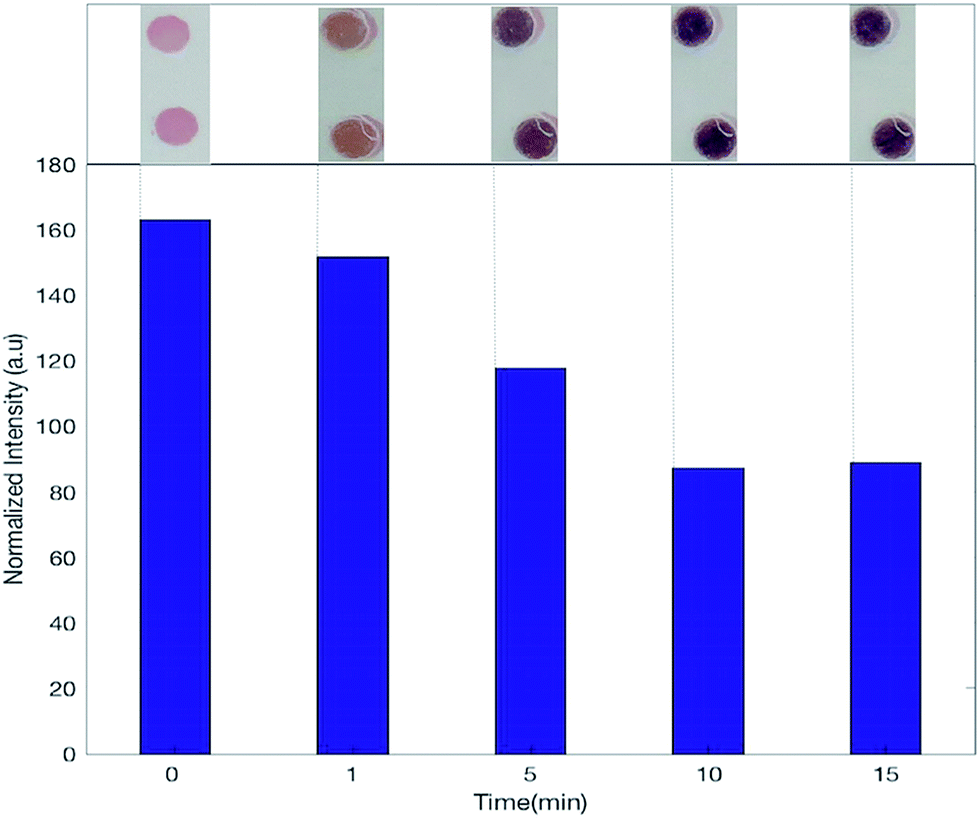 | ||
| Fig. 3 Color development (changing from light pink to purplish over time) for a LDH concentration of 1362 U L−1 in plasma sample. The normalized intensity (a.u) is stable and shows a constant value from 10 minute onwards which indicates 10 minutes as the optimum time for color development. | ||
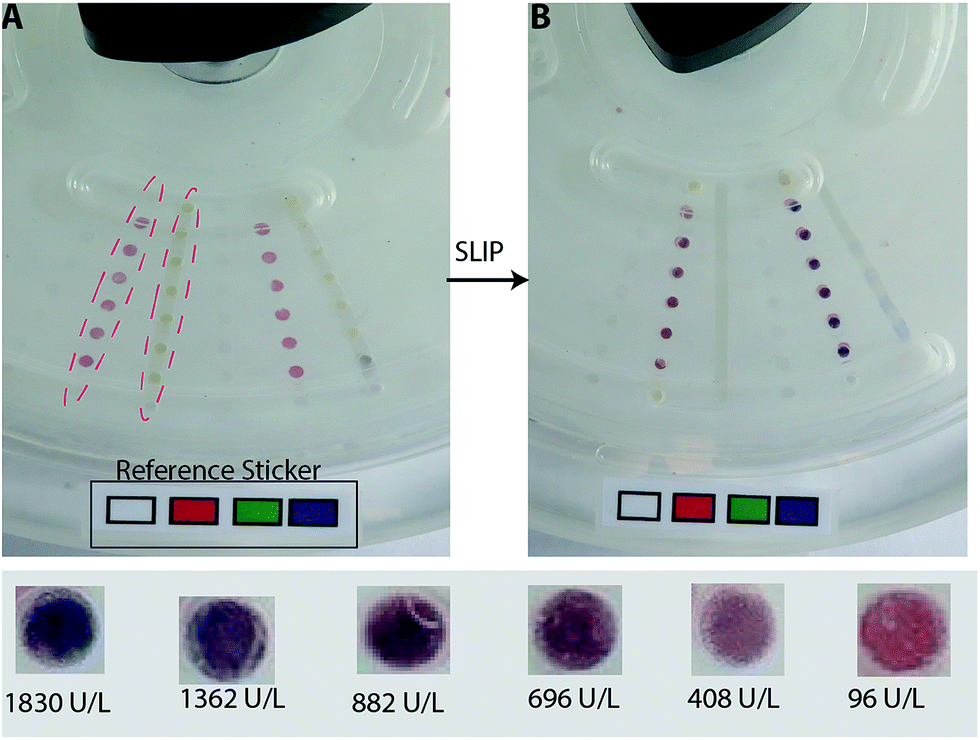 | ||
| Fig. 4 (A) The plasma sample is pipetted in a continuous channel carved on the bottom and top slipdisc and the reagents are spotted and dried on the wells carved on the bottom slipdisc (marked in red boxes). The reference sticker has the black and white colors on it and the R channel values on the sticker are used as standards for image normalisation. (B) Two different concentrations of LDH in plasma; inset shows the different shades of pink color developed on slipping after 10 minutes at six different concentrations of LDH in plasma. | ||
The RGB values of black and white color on a pasted sticker printed from a HP Color Laserjet Pro MFP M277 was used as reference for the maximum and minimum of RGB value. In order to sustain the satisfactory lighting conditions for the measurement, the camera was set in a controlled-light environment and the ability of the slipdisc to quantify LDH enzyme was evaluated by designing a standard curve with the clinically relevant concentrations. The red channel intensity showed a high coefficient of determination, R2 ≥ 0.98 (P < 0.0001), compared to 0.88 and 0.85 (P < 0.0002 and <0.0053) in the green and blue channels, respectively as shown in Fig. 5 and ESI data respectively.† This confirms the viability of the red channel for accurately predicting the unknown concentrations of LDH. Picking RGB values from images for colorimetric detection is a standard procedure of image analysis and has been reported elsewhere.25–29 The R value for the well (Rwell) was calculated by extracting the R value of the well from the image (Rwell_actual) and subtracting the R value of black color in the sticker of the same image (Bwell_actual). The R value for black color (Bwell_ref) is 0 and the R value for white color (Wwell_ref) is 255. However, in the images captured, the R value for white and black colors are between these two extreme values. In order to standardize these values a normalization ratio (T) is defined based on the R values of the black and white color:
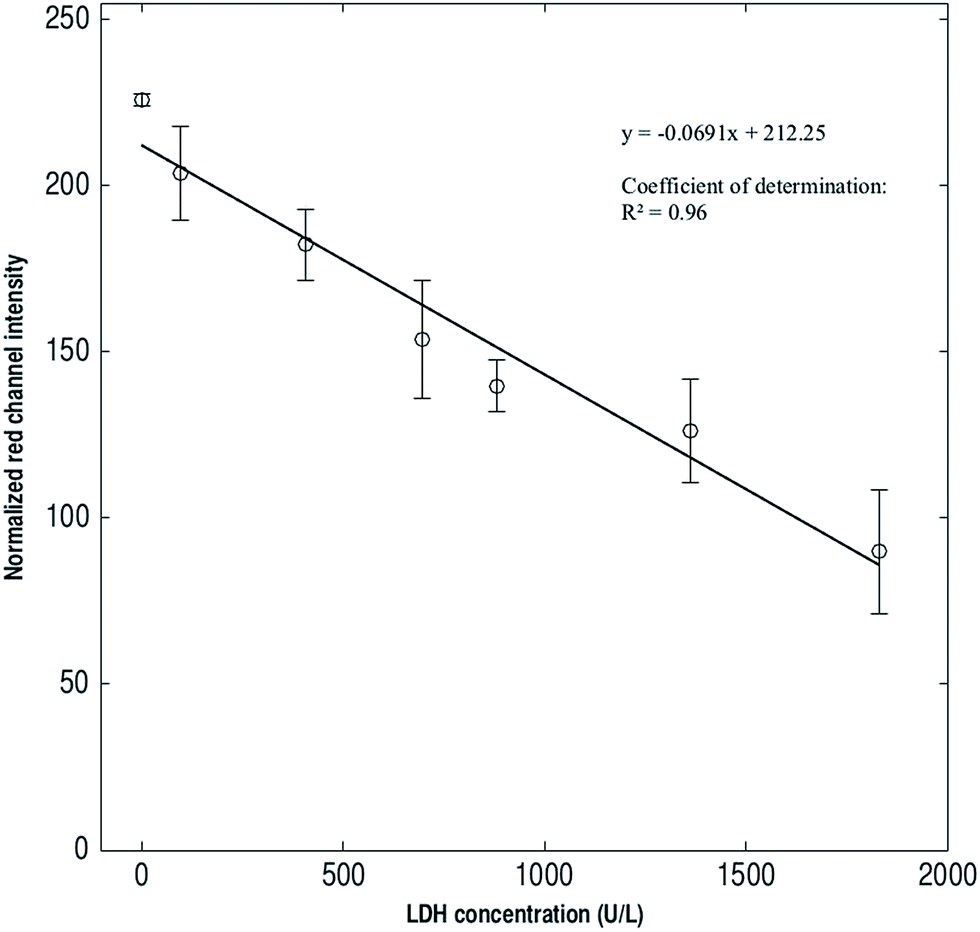 | ||
| Fig. 5 Scatter plot of LDH concentrations versus normalized red channel intensity after 10 minutes. The error bars indicate standard deviations, above is the equation for the best fit line connecting all the points with a coefficient of determination of 0.96 and a negative sample correlation coefficient of −0.98. | ||
Fig. 5 shows the correlation between the LDH concentrations in plasma and the colour intensity of red channel i.e., normalised value in RGB channel developed in the images captured. The correlations of blue channel and green channel with LDH concentration can be found in the ESI section (Fig. S4).†
We compared our results with those provided by the Beckman Coulter Chemical Analyzer and obtained excellent correlation of (r = −0.98) for the LDH assay. This high negative correlation implies that the changes in LDH concentrations vary inversely and linearly with the variation of R channel intensity from a higher to a lower value. The strong correlation obtained show that the slipdisc is a powerful diagnostic device that can be used in resource limited settings for measuring LDH levels.
| T = (Wwell_ref −Bwell_ref)/(Wwell) | (1) |
This ratio is then multiplied to the R values (Rwell) obtained for all the pixels in the images to get a normalised R value (Rwell_nor):
| Rwell_mod = (Wwell_ref − Bwell_ref) × Rwell/(Wwell) | (2) |
| Rwell = Rwell_actual − Bwell_actual | (3) |
| Wwell = Wwell_actual − Bwell_actual | (4) |
It has been recently shown that the Exmor R sensors used in the camera of the commercially available smartphones have been successfully used for colorimetric detection in the LAMP assay.30 The Canon G16 camera uses the Sony BSI CMOS sensor (1/1.7 inch) image sensors with high resolution (1.85 μm unit pixel) and sensitivity in RGB channels. The images can be standardized using the same strategy used for smartphones and cameras as long as the sensor is clearly able to distinguish between R, G and B values. The image analysis procedure here is specifically designed to measure the LDH level in the plasma sample. A similar approach based on observing correlation coefficients with change in sample concentration can be adapted for detection of any bioassay which has a uniform change in the intensity of either R, G or B channels with time.
Neonatal diagnostics
The significance of developing a device for LDH detection goes a long way in establishing a portable low cost point of care device for detecting signs of critical illnesses in newborn babies. LDH is a non specific biomarker for several critical illnesses in newborn babies as already pointed out in the First section. Further, slipdisc can be used by minimally trained professionals and its accuracy is at par with clinically available devices like Beckman Coulter counter at detecting LDH concentrations. Thus, it can save a million newborn lives every year if taken to clinicians operating at resource limited settings. A smartphone based user interface accompanies the slipdisc to give clinicians accurate LDH concentrations from 10 μL blood samples of newborn babies in a turnaround time of 10 minutes. The ability to detect multiple concentrations of LDH ranging from 0 U L−1 to as high as 1800 U L−1 establishes the sensitivity of detection of the slipdisc for a wide range of LDH concentrations.For implementation of POC testing, with the complexity of neonatal screening, there is need for simple, affordable, standardized, multi-parametric testing equipment that can generate sensitive and specific results using small blood volumes. Traditional paper based lateral flow (LFA) assays is the most widely used POC diagnostic assay platform today. However, low sensitivity, high variability and lack of multiplexing ability have narrowed the range of applicability of such POC diagnostic devices. In this work, using plastics, we replace today's nitrocellulose substrates in LFAs, thereby removing the current inherent limitations in limit of detection that ultimately stem from the irreproducible microstructure, surface chemistry and opaqueness of natural materials. Here, we combine the benefits of microfabrication with the simplicity of LFA using low-cost plastics with low-cost manufacturing techniques. We have developed a simple (hand-winded) microfluidic platform making use of slipchip technology. The features of slipchip technology demonstrated in previous reports have been extreme sensitivity for carrying out real time PCR,31 multiplex digital PCR,32 as well as the possibility of long term storage on the chip.33 This makes slipchip based devices an ideal concept for RLS and as such it has been used in multiple applications. In this work, a clockwork mechanic driven rotating slipdisc mechanism driving all microfluidic sample handling can easily be combined with mobile phone based detection for multiple sample-in-result-out POC tests.
4 Conclusion
The slipdisc is designed to address the high demands for a low cost, portable and highly sensitive POC test device for the resource limited settings. The slipdisc employs a novel portable clockwork mechanism and a smartphone to process the sample and reagents and conduct diagnostic assays. The slipdisc functionality has been experimentally evaluated and its viability for measuring the level of LDH in plasma samples has been tested. The experiment results have been compared with the existing clinical diagnostic method and an excellent agreement between the results was observed. The slipdisc can further be modified to conduct more complex assays such as separating plasma from whole blood in order to fully integrate the assay. In comparison with the previous slipchips the rotational discs are made of polycarbonate which are inexpensive and easy to fabricate.Acknowledgements
The funding for the project was provided by KTH-SLL. We are also thankful to Amin Kazemzadeh and Mary Amasia for their help at different times of the project.References
- R. E. Black, S. Cousens, H. L. Johnson, J. E. Lawn, I. Rudan, D. G. Bassani, P. Jha, H. Campbell, C. F. Walker and R. Cibulskis, Lancet, 2010, 375, 1969–1987 CrossRef.
- M. Meem, J. K. Modak, R. Mortuza, M. Morshed, M. S. Islam and S. K. Saha, J. Glob. Health, 2011, 1, 201–209 Search PubMed.
- M. Thoresen, X. Liu, S. Jary, E. Brown, H. Sabir, J. Stone, F. Cowan and M. Karlsson, Acta Paediatr., 2012, 101, 1038–1044 CrossRef CAS PubMed.
- S. Ozkiraz, Z. Gokmen, S. B. Boke, H. Kilicdag, D. Ozel and A. Sert, J. Matern.-Fetal Neonat. Med., 2013, 26, 1245–1248 CrossRef CAS PubMed.
- K. Ganguli, D. Meng, S. Rautava, L. Lu, W. A. Walker and N. Nanthakumar, Am. J. Physiol.: Gastrointest. Liver Physiol., 2013, 304, G132–G141 CrossRef CAS PubMed.
- G. M. Lackmann and U. Töllner, Neuropediatrics, 1995, 26, 192–198 CrossRef CAS PubMed.
- M. Karlsson, E. Wiberg-Itzel, E. Chakkarapani, M. Blennow, B. Winbladh and M. Thoresen, Acta Paediatr., 2010, 99, 1139–1144 CrossRef CAS PubMed.
- D. C. Duffy, H. L. Gillis, J. Lin, N. F. Sheppard and G. J. Kellogg, Anal. Chem., 1999, 71, 4669–4678 CrossRef CAS.
- R. Burger, P. Reith, G. Kijanka, V. Akujobi, P. Abgrall and J. Ducrée, Lab Chip, 2012, 12, 1289–1295 RSC.
- M. Amasia, M. Cozzens and M. J. Madou, Sens. Actuators, B, 2012, 161, 1191–1197 CrossRef CAS.
- R. Burger, D. Kirby, M. Glynn, C. Nwankire, M. O'Sullivan, J. Siegrist, D. Kinahan, G. Aguirre, G. Kijanka and R. A. Gorkin, Curr. Opin. Chem. Biol., 2012, 16, 409–414 CrossRef CAS PubMed.
- C. J. Choi and B. T. Cunningham, Lab Chip, 2007, 7, 550–556 RSC.
- C. J. Choi, A. R. Belobraydich, L. L. Chan, P. C. Mathias and B. T. Cunningham, Anal. Biochem., 2010, 405, 1–10 CrossRef CAS PubMed.
- W. Su, X. Gao, L. Jiang and J. Qin, J. Chromatogr. A, 2015, 1377, 13–26 CrossRef CAS PubMed.
- W. Du, L. Li, K. P. Nichols and R. F. Ismagilov, Lab Chip, 2009, 9, 2286–2292 RSC.
- H. Liu, X. Li and R. M. Crooks, Anal. Chem., 2013, 85, 4263–4267 CrossRef CAS PubMed.
- W. Liu, D. Chen, W. Du, K. P. Nichols and R. F. Ismagilov, Anal. Chem., 2010, 82, 3276–3282 CrossRef CAS PubMed.
- C. Shen, P. Xu, Z. Huang, D. Cai, S.-J. Liu and W. Du, Lab Chip, 2014, 14, 3074–3080 RSC.
- F. Shen, E. K. Davydova, W. Du, J. E. Kreutz, O. Piepenburg and R. F. Ismagilov, Anal. Chem., 2011, 83, 3533–3540 CrossRef CAS PubMed.
- L. Ma, S. S. Datta, M. A. Karymov, Q. Pan, S. Begolo and R. F. Ismagilov, Integr. Biol., 2014, 6, 796–805 RSC.
- L. Li, M. A. Karymov, K. P. Nichols and R. F. Ismagilov, Langmuir, 2010, 26, 12465–12471 CrossRef CAS PubMed.
- C. F. Carlborg, T. Haraldsson, K. Öberg, M. Malkoch and W. van der Wijngaart, Lab Chip, 2011, 11, 3136–3147 RSC.
- L. Rivas, M. Medina-Sánchez, A. de la Escosura-Muñiz and A. Merkoçi, Lab Chip, 2014, 14, 4406–4414 RSC.
- P. Olin, S. B. Lindström, T. Pettersson and L. Wågberg, Langmuir, 2013, 29, 9079–9089 CrossRef CAS PubMed.
- N. A. Rakow and K. S. Suslick, Nature, 2000, 406, 710–713 CrossRef CAS PubMed.
- C. J. Musto, S. H. Lim and K. S. Suslick, Anal. Chem., 2009, 81, 6526–6533 CrossRef CAS PubMed.
- A. K. Yetisen, J. L. Martinez-Hurtado, A. Garcia-Melendrez, F. da Cruz Vasconcellos and C. R. Lowe, Sens. Actuators, B, 2014, 196, 156–160 CrossRef CAS.
- L. Shen, J. A. Hagen and I. Papautsky, Lab Chip, 2012, 12, 4240–4243 RSC.
- A. M. Khan, N. Rajpoot, D. Treanor and D. Magee, IEEE Trans. Biomed. Eng., 2014, 61, 1729–1738 CrossRef PubMed.
- J. Rodriguez-Manzano, M. A. Karymov, S. Begolo, D. A. Selck, D. V. Zhukov, E. Jue and R. F. Ismagilov, ACS Nano, 2016, 10, 3102–3113 CrossRef CAS PubMed.
- M.-N. Tsaloglou, R. J. Watson, C. M. Rushworth, Y. Zhao, X. Niu, J. M. Sutton and H. Morgan, Analyst, 2015, 140, 258–264 RSC.
- F. Shen, B. Sun, J. E. Kreutz, E. K. Davydova, W. Du, P. L. Reddy, L. J. Joseph and R. F. Ismagilov, J. Am. Chem. Soc., 2011, 133, 17705–17712 CrossRef CAS PubMed.
- S. Begolo, F. Shen and R. F. Ismagilov, Lab Chip, 2013, 13, 4331–4342 RSC.
Footnote |
| † Electronic supplementary information (ESI) available: Additional figure of the slipchip design for LDH assay, the principle of the LDH assay and color intensity versus LDH concentration for the green and blue colors. See DOI: 10.1039/c7ra05209j |
| This journal is © The Royal Society of Chemistry 2017 |