 Open Access Article
Creative Commons Attribution 3.0 Unported Licence
Novel antibacterial application of photovoltaic Cu2SnS3 (CTS) nanoparticles†
A. C. Lokhande a,
A. Shelkeb,
P. T. Babara,
Jihun Kimac,
Dong Ju Leed,
Il-Chul Kimd,
C. D. Lokhandee and
Jin Hyeok Kim*a
aOptoelectronic Convergence Research Centre, Department of Materials Science and Engineering, Chonnam National University, Gwangju 500-757, South Korea. E-mail: jinhyeok@chonnam.ac.kr; abhi4502@gmail.com
bThin Film Physics Laboratory, Department of Physics, Shivaji University, Kolhapur 416 004, M.S, India
cSchool of Electrical Engineering and Computer Science, Gwangju Institute of Science and Technology, 123 Cheomdangwagi-ro, Buk-Gu, Gwangju 500-712, South Korea
dDepartment of Biological Sciences, Chonnam National University, 77 Youngbong-ro, Buk-gu, Gwangju 61186, Republic of Korea
eCentre for Interdisciplinary Research, D. Y. Patil University, Kolhapur 416004, India
First published on 5th July 2017
Abstract
In the present work, Cu2SnS3 (CTS) nanoparticles were synthesized using the hot injection method. The structural, compositional and optical properties of the nanoparticles were evaluated using the X-ray diffraction (XRD), Raman spectroscopy, transmission electron microscopy (TEM) and UV-visible spectroscopy techniques, respectively. The XRD and Raman studies confirmed the formation of monoclinic CTS nanoparticles. The TEM and UV-visible spectroscopy studies indicated the formation of spherical nanoparticles in the size range of 10–12 nm with a band gap of 1.24 eV. The CTS nanoparticles were tested for antibacterial activity against Gram-positive (Staphylococcus aureus) and Gram-negative (Escherichia coli) bacteria strains by the agar-well diffusion method. The antibacterial activity of the nanoparticles was identified by determining the zone of inhibition (ZOI) and minimal inhibitor concentration (MIC). The study results reveal that the synthesized nanoparticles possessed excellent antibacterial activity against both bacterial strains, indicating the potential of the material for further research in biocidal applications. Finally, a plausible mechanism of antibacterial activity of the nanoparticles is proposed.
1. Introduction
The unceasing search for non-toxic and earth-abundant materials for solar cell applications has gained momentum in recent years due to proliferating environmental and energy concerns.1 The emerging ternary semiconductor compound Cu2SnS3 (CTS) possesses similar optical properties to Cu2ZnSnS4 (CZTS) and offers to alleviate its structural complexity due to the reduced number of elements.2 The ternary semiconductor CTS is an intensively researched material due to its favorable properties such as high absorption coefficient (105 cm−1), tunable band gap (1.1–1.5 eV) and ability to be produced from earth-abundant and non-toxic materials.3,4 These alluring properties of the compound have prompted intensive research work in the fabrication of CTS based thin film solar cells, which have enhanced the power conversion efficiency from 0.11% to 4.6%.2,5 While the intriguing properties of CTS have attracted enormous attention for photovoltaic applications, it has also been employed in various other applications such as Li-batteries, H2 production, photocatalysis, waste-water treatment and gas sensing.6–9 Despite these wide applications, the antibacterial activity of CTS still remains unexplored.Various inorganic materials such as ZnO, TiO2, Ag and Au have been previously employed for antibacterial activities.10–14 Recently, the antibacterial activity of CZTS against Gram-positive and Gram-negative bacteria has been demonstrated, indicating the high activity of the material against bacterial growth.15 The specific advantages of these inorganic materials for antibacterial application are the use of non-toxic earth-abundant materials and the fact that they are synthesized using simple methods. Also, these materials contain elements that are important for metabolic activity in humans.15 The human body is composed of various major elements like O2, N2, S and trace elements like Cu, Zn, Sn, etc. The human body contains roughly 75 mg of Cu, which acts as a catalyst in the formation of melanin for pigmentation of skin and has an active role in the repair of tissues. Sn (1–3 mg) plays an effective role in relieving low blood pressure and stomach parasites whereas S is a building block of proteins, cells and tissues. The other important aspect which should be considered is the toxicity of these inorganic elements. Earlier studies have demonstrated that materials containing Cu, Zn, Sn and S in small quantities showed a negligible negative effect on the human body but a greater effect on bacteria.15–17 Hence, the non-toxic nature of these inorganic elements combined with the low elemental cost makes them effective for biocidal applications. Inspired by these facts, in the current study, we have successfully demonstrated for the first time the antibacterial activity of CTS against pathogenic strains, and a plausible mechanism for the antibacterial activity of CTS nanoparticles is discussed.
CTS nanoparticles have previously been synthesized using chemical methods such as solvothermal, hydrothermal, microwave and hot injection.18–21 The hot injection method possesses the advantage of close control over the size, shape and stoichiometry of the nanoparticles, making it an attractive method for nanoparticle synthesis. Nanoparticle synthesis with a cost effective approach is highly demanding. Proper experimental design, solvents and chemical precursor selection are vital for the cost effectiveness of nanoparticle synthesis. Metal precursor sources such as chloride, iodide, acetate and acetylacetonate are currently employed for CTS nanoparticle synthesis by the hot injection method.22–25 The cost of metal precursor sources adds to the cost of nanoparticle synthesis. Compared to the above metal precursors, sulfate precursor sources are cheap and hence can undeniably reduce the cost, making nanoparticle synthesis more economical. Recently, we have demonstrated the effect of metal precursor sources on CTS nanoparticle synthesis for photovoltaic application.3 The current work demonstrates the synthesis of CTS nanoparticles from a cost effective sulfate metal precursor source and its antibacterial activity against bacterial strains (Gram-positive and Gram-negative bacteria). The synthesized nanoparticles are characterized using a comprehensive range of techniques and their antibacterial activity is assessed in terms of the zone of inhibition (ZOI) using the agar well diffusion method.
2. Experimental details
2.1 Synthesis of CTS nanoparticles
All chemicals were used as received without further purification. Copper sulfate (CuSO4·XH2O), tin sulfate (SnSO4·2H2O), sulfur powder and oleylamine (OLA) were purchased from Sigma-Aldrich. In a typical synthesis, 1.5 mM copper sulfate and 1 mM tin sulfate solutions were mixed in 20 ml OLA in a three neck flask. The mixture was purged with argon and the temperature was raised to 140 °C, and the mixture was aged for 10 min to form a Cu + Sn complex. After complex formation, the temperature was raised to 240 °C and then 3 mM sulfur powder dissolved in 5 ml OLA was swiftly injected into the flask. The reaction was further aged for 10 min to form a black precipitate. After completing the reaction, the reaction mixture was naturally cooled to room temperature and centrifuged at 5000 rpm for 10 min. The precipitate was washed with acetone and deionized water four times to remove by-products. Finally, the obtained black powder was dried in the oven at 80 °C for 6 h and used for further characterization and application.2.2 Characterization
The structural properties of the CTS nanoparticles were studied using high-resolution powder X-ray diffraction (PXRD) with Ni-filtered Cu-Kα radiation of 1.5405 Å (X'pert PRO, Philips, Eindhoven, Netherlands). The Raman spectra of the CTS samples were recorded in the range of 150–500 cm−1 by using a micro-Raman spectrometer (Via Reflex UV Raman microscope, Renishaw, U.K. at the KBSI Gwangju Center) employing a He–Ne laser source with an excitation wavelength of 488 nm and resolution of 1 cm−1 at 15 mW laser power. A high-resolution transmission electron microscopy image was obtained using a high-resolution JEOL-3010 microscope. An optical absorption study was carried out in the wavelength range of 200–1000 nm using a UV-Vis-NIR spectrophotometer (Cary 100, Varian, Mulgrave, Australia). The bacterial colonies were visually characterized using field emission scanning electron microscopy (FE-SEM, Model: JSM-6700F, Japan).2.3 Antibacterial assay
Stock cultures were seeded on agar slants for activation. The slants were incubated at 37 °C for 24 hours and then used for further experiments. All media, glassware and other necessary equipment such as micropipette tips, syringes etc. were autoclaved at 121 °C at 15 lbs pressure for 15 minutes. The nutrient agar was allowed to cool to about 37 °C. Each flask was inoculated with a single organism (Escherichia coli or Staphylococcus aureus). Nutrient agar from each seeded flask was poured into separate Petri plates and allowed to set. Two wells were prepared in each plate, one for control and the other for testing. A 1 mg sample of CTS nanoparticles was loaded into the well. The plates were then incubated at 37 °C for 24 hours and the ZOIs were measured in mm. The minimal inhibitory concentration (MIC) was determined by observing the growth of microorganisms after overnight incubation.3. Results and discussion
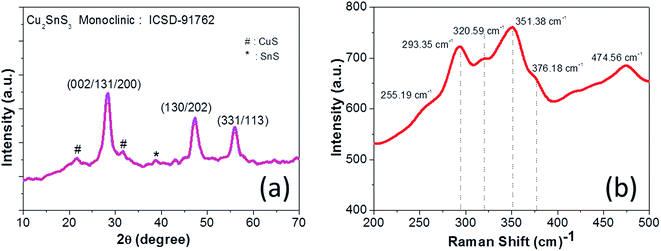
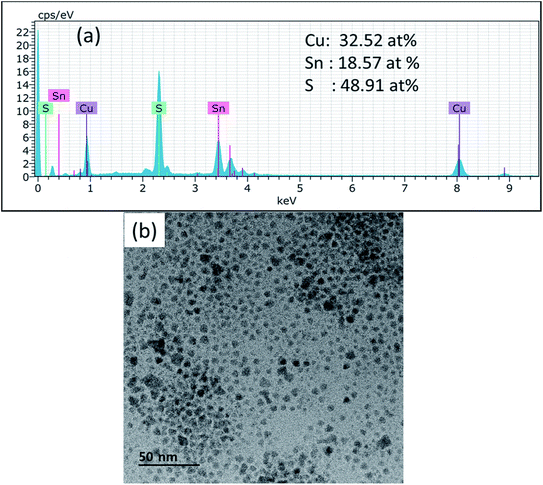
The XRD pattern of CTS nanoparticles shown in Fig. 1(a) clearly shows the existence of (002/131/200), (133/202) and (331/113) peaks, indicating the formation of the monoclinic Cu2SnS3 phase (ICSD: 91762) with preferred growth orientation along the (002/131/200) plane. The observed XRD result is consistent with the literature report.2 The broad nature of the XRD peaks indicates the formation of smaller sized nanoparticles, with the size of the nanoparticles estimated as 8 ± 2 nm. Apart from these characteristic CTS peaks, the additional peaks observed in the spectra at 2θ = 21.65°, 31.72° and 38.61° are attributed to secondary CuS and SnS phases (marked by ‘#’ and ‘*’ for CuS and SnS, respectively, in Fig. 1(a)). As CTS is a ternary compound, it is formed from the reaction between CuS and SnS,1 hence the possibility of forming these secondary phases is relatively high. The polymorphic nature of CTS allows it to stabilize in various crystal structures, namely cubic, tetragonal and monoclinic, which all produce similar diffraction patterns.2 Hence, Raman scattering was further used as a complementary technique for structure determination due to its sensitivity to atomic vibration. The Raman spectrum shown in Fig. 1(b) depicts the intense vibrational mode peaks at 293.35 cm−1, 320.59 cm−1, 351.38 cm−1 and 376.18 cm−1 that correspond to the monoclinic Cu2SnS3 phase, and matches well with the literature report.26 The observed slight shift in the Raman peak positions in the present work compared with the literature report can be attributed to the slight deviation in the elemental composition. The shoulder peak at 320.59 cm−1 is attributed to Cu–Sn atomic bond vibration and the broad nature of these vibrational peaks is associated with the phonon confinement effect. The vibrational mode peaks at 255.19 cm−1 and 474.56 cm−1 observed in the spectrum correspond to SnS and CuS secondary phases, respectively. Hence, the presented Raman result is well consistent with the XRD result and confirms the formation of the monoclinic Cu2SnS3 phase with minor CuS and SnS secondary phases. The formation of the CuS secondary phase is more prominent than that of SnS, which can be explained by the principle of hard and soft acids and bases (HSAB), where the soft Lewis base (S) preferentially reacts with the soft Lewis acid (Cu) than with the hard Lewis acid (Sn).27 This preferential reaction leads to a difference in the chemical reactivity of the two cations with the anions and hence eventually leads to phase segregation. Thus, the chemical reactivity of the precursors significantly influences the phase formation.The typical optical absorption curve of the CTS nanoparticles depicted in Fig. 2(a) indicates broad optical absorption in the wavelength range of 350–800 nm (visible to near-IR region), highly desirable for photovoltaic application. The corresponding band gap plot shown in Fig. 2(b) was generated by extrapolating a straight line of the plot (αhv)2 as a function of the photon energy hv (α = absorption coefficient, h = Planck's constant and v = frequency). The estimated band gap was found to be 1.24 eV and is consistent with the reported values.1,3 The optimal band gap of these nanoparticles reveals their suitability as a photo-absorber material for solar cell application. The EDX spectrum of the CTS nanoparticles presented in Fig. 3(a) confirms the presence of Cu (32.52 at%), Sn (18.57 at%) and S (48.91 at%) in the approximate stoichiometric ratio of the Cu2SnS3 compound but with slightly depleted copper and sulfur contents. The slight deviation in stoichiometric composition can be attributed to the difference in chemical reactivity of the precursors as mentioned before. The TEM image (Fig. 3(b)) of the CTS nanoparticles apparently reveals dispersed particles with spherical shapes, having an average particle size in the range of 10–12 nm. Some particles with larger sizes (20 nm) are also visible, which can be attributed to the aggregation of smaller particles to form larger particles. The average particle size of the nanoparticles is consistent with the size evaluated from the XRD study.
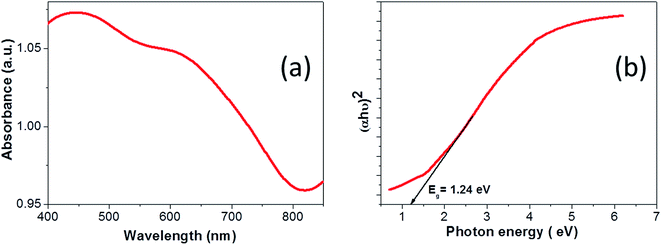 | ||
| Fig. 2 (a) Optical absorbance spectrum of CTS nanoparticles and (b) band gap plot of CTS nanoparticles. | ||
The antibacterial activity of the CTS nanoparticles against Gram-positive and Gram-negative bacteria was evaluated by determining the ZOI and MIC. Fig. 4 indicates the antibacterial activity of the CTS nanoparticles. The bacterial ZOI is clearly seen for the tested bacteria after 24 h incubation. The observed radius of the ZOI is 22 mm and 15 mm for E. coli (Gram-negative) (Fig. 4(a)) and S. aureus (Gram-positive) (Fig. 4(b)), respectively. The difference in the area of the ZOI may be attributed to the differences in cell membrane structure and thickness of the bacterial cell walls. The bacterial cell wall thickness of S. aureus and E. coli is approximately 80 nm and 10 nm, respectively.28 Hence, due to the higher cell wall thickness of S. aureus bacteria, the radius of the ZOI is smaller than that of E. coli, as the cell wall resists the diffusion of nanoparticles and the damage that they cause to the cell membrane, thereby protecting the cytoplasmic fluid and hence the bacterium. Fig. S1(a and b)† represents the MIC of E. coli and S. aureus, respectively. The observed MIC was 3 ml for E. coli and 1 ml for S. aureus. Thus, it is clear that the CTS particles exhibit notable antibacterial activity against bacterial strains.
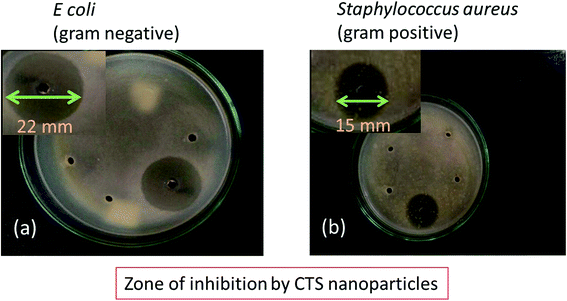 | ||
| Fig. 4 Photographs of the zone of inhibition (ZOI) of CTS nanoparticles for (a) Gram-negative (E. coli) and (b) Gram-positive (S. aureus) bacteria. | ||
Fig. 5(a and b) represents the FE-SEM images of reference E. coli untreated with CTS nanoparticles. As seen from the images, E. coli with uniform cell texture having an average cell length of 3.2 μm and a cell width of 1.24 μm are observed. However, for the bacteria treated with CTS nanoparticles (Fig. 5(c–f)), significant changes in the cellular structure are noticed. The average cell width is reduced to 0.9 μm while the length is increased to 6 μm (Fig. 5(c and d)). The observed increased cell length and the reduced cell width are attributed to the extrusion of cytoplasmic fluid from the cell membrane, thereby damaging the cell texture (Fig. 5(e and f)). Thus, the damage to the cell structure caused by the nanoparticles results in bacterial growth inhibition and death. Similarly, Fig. 6(a and b) indicates the FE-SEM images of reference S. aureus bacteria untreated with CTS nanoparticles while Fig. 6(c–f) represents the FE-SEM images of the S. aureus treated with CTS nanoparticles. As seen from the images, it is clear that the reference S. aureus bacteria untreated with CTS nanoparticles bear smooth and uniform spherical cell texture with a cell diameter of 0.7 μm (Fig. 6(a and b)). For the case of S. aureus treated with the nanoparticles, the antibacterial effect is associated with shrinkage of cellular texture followed by the rupture of the cell membrane leading to extrusion of intracellular fluids (Fig. 6(c and d)). The extrusion of intracellular fluids damages the cell, rendering it with an intricate shape (Fig. 6(e and f)). Also to be noticed, the diameter of the cells increases to (1.2 μm) for the bacteria treated with nanoparticles (Fig. 6(c–f)), indicating their inability to undergo cell division. The change in the cell dimensions of the reference and the nanoparticle-treated bacteria is indicated in Table 1 while the changes in the cellular structure of the bacteria are indicated in Fig. S2 and S3.† As seen from Table 1, significant changes in the cell dimensions of the treated E. coli (cell width/length ratio reduces from 0.38 to 0.15 and the ratio of cell surface area/volume increases from 12.09 to 15.01) and S. aureus (cell diameter increases from 0.7 to 1.2 μm and the ratio of cell surface area/volume reduces from 8.55 to 5.02) are observed.
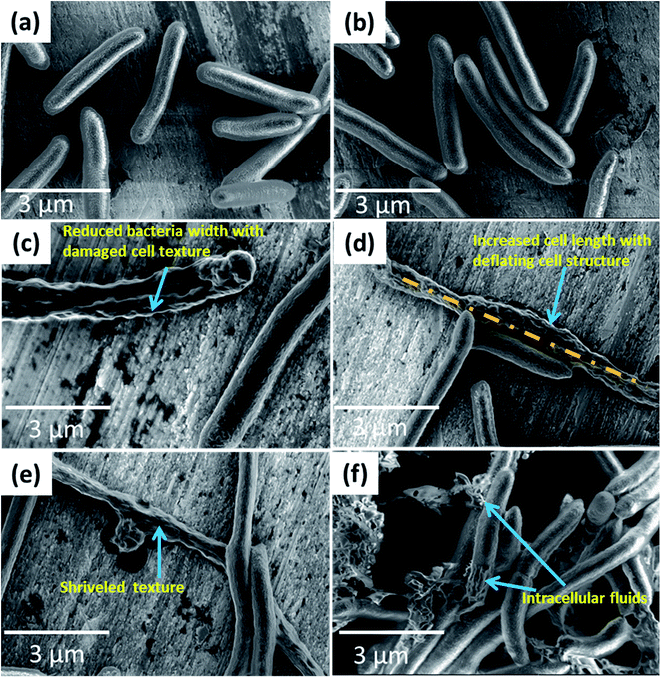 | ||
| Fig. 5 FE-SEM images of E. coli bacteria (a, b) without CTS nanoparticles treatment and (c–f) with CTS nanoparticles treatment. | ||
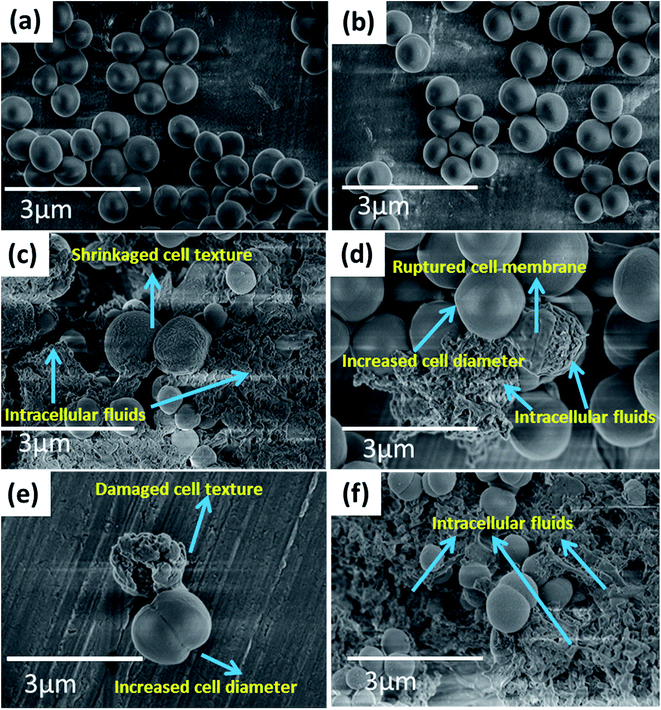 | ||
| Fig. 6 FE-SEM images of S. aureus bacteria (a, b) without CTS nanoparticles treatment and (c–f) with CTS nanoparticles treatment. | ||
| Cell dimension | Reference E. coli | Treated E. coli | Reference S. aureus | Treated S. aureus |
|---|---|---|---|---|
| Cell width (μm) | 1.24 ± 0.4 | 0.9 ± 0.4 | — | — |
| Cell length (μm) | 3.2 ± 0.5 | 6 ± 0.5 | — | — |
| Width/length | 0.38 | 0.15 | — | — |
| Cell diameter (μm) | — | — | 0.7 ± 0.3 | 1.2 ± 0.3 |
| Cell volume (μm)3 | 1.23 | 1.215 | 0.18 | 0.9 |
| Cell surface area (μm)2 | 14.88 | 18.24 | 1.54 | 4.52 |
| Surface area/volume | 12.09 | 15.01 | 8.55 | 5.02 |
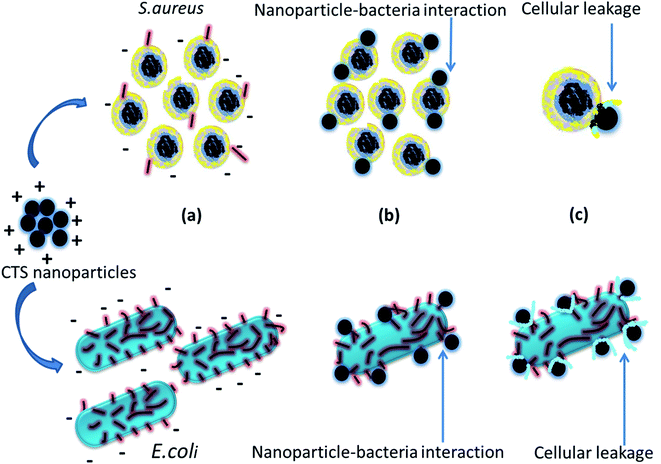
So far, several mechanisms for the antibacterial activity of nanoparticles have been proposed. (1) The nanoparticles diffuse and interact with the bacterial cell wall, proteins and nucleic acids, resulting in structural and chemical damage to the bacteria leading to their death; and (2) reactive oxygen species (ROS) are formed, which damage DNA, proteins and lipids in the cell wall, causing its breakdown, leading to leakage of cytoplasmic fluid.15,18,19 However, in the antibacterial activity of CTS nanoparticles, we propose a mechanism based on the electrostatic interaction between opposite charges (Fig. 7). It has been previously reported that the bacterial cell wall has a net negative charge and chalcogenide-based nanoparticles have a net positive charge (Fig. 7(a)), as evaluated from their isoelectric point (IEP).29,30 Hence, the electrostatic attraction (between opposite charges) results in direct interaction between CTS nanoparticles and bacterial cell walls (Fig. 7(b)). The nanoparticles form strong bonds with thiol, amino and carboxyl groups of the bacterial membrane and damage the cell wall, leading to extrusion of internal fluids, proteins, DNA and other genetic materials, eventually resulting in bacterial death (Fig. 7(c)). Also, the smaller size of the nanoparticles (high surface-to-volume ratio) provides maximum surface area for interaction with the bacterial membrane.
Thus, the antibacterial effect of CTS nanoparticles on the treated bacteria is associated with restriction of cell division and extrusion/leakage of cytoplasmic fluids from the cell membrane, leading to cell death. Hence, the antibacterial effect of CTS nanoparticles is realized for both Gram-positive and Gram-negative bacterial strains.
In a previous study of antibacterial activity of Ag nanoparticles against E. coli bacteria, the Ag nanoparticles somehow interacted with the bacterial membrane despite their negative charge, and restricted bacterial growth.31 Thus, the actual mechanism of the interaction of nanoparticles with the bacterial membrane is still unclear. However, a further study on the interaction between nanoparticles and bacteria will provide further insight to more clearly understand the antibacterial activity of nanoparticles. The presented antibacterial effect of CTS nanoparticles provides new scope for further research in biocidal applications.
4. Conclusions
Spherical CTS nanoparticles with sizes ranging between 10 and 12 nm have been synthesized by the hot injection method and their antibacterial activity was studied against Gram-positive (S. aureus) and Gram-negative (E. coli) bacterial strains. The antibacterial effect is associated with the leakage of cytoplasmic fluids from the bacterial cell membrane and with changes in the cell structure that inhibit cell replication. The study results reveal that the synthesized nanoparticles possess excellent antibacterial activity against both bacterial strains, indicating the potential of the material for further research in biocidal applications.Acknowledgements
This work was supported by the Human Resources Development program (No. 20164030201310) of the Korea Institute of Energy Technology Evaluation and Planning (KETEP) Grant funded by the Korea government Ministry of Trade, Industry and Energy and supported by the Technology Development program to solve climate changes of the National Research Foundation (NRF) funded by the ministry of Science, ICT and Future Planning (2016936784).References
- A. C. Lokhande, K. V. Gurav, E. Jo, C. D. Lokhande and J. H. Kim, J. Alloys Compd., 2016, 656, 295–310 CrossRef CAS.
- A. C. Lokhande, R. B. V. Chalapathy, M. He, E. Jo, M. Gang, S. A. Pawar, C. D. Lokhande and J. H. Kim, Sol. Energy Mater. Sol. Cells, 2016, 153, 84–107 CrossRef CAS.
- A. C. Lokhande, K. V. Gurav, E. Jo, M. He, C. D. Lokhande and J. H. Kim, Opt. Mater., 2016, 54, 207–216 CrossRef CAS.
- A. C. Lokhande, S. A. Pawar, E. Jo, M. He, A. Shelke, C. D. Lokhande and J. H. Kim, Opt. Mater., 2016, 58, 268–278 CrossRef CAS.
- M. Nakashima, J. Fujimoto, T. Yamaguchi and M. Izaki, Appl. Phys. Express, 2015, 8, 042303 CrossRef.
- H. Wu, D. Liu, H. Zang, C. Wei, B. Zeng, J. Shi and S. Yang, Carbon, 2012, 50, 4847–4855 CrossRef CAS.
- B. Qu, H. Li, M. Zhang, L. Mei, L. Chen, Y. Wang, Q. Li and T. Wang, Nanoscale, 2011, 3, 4389 RSC.
- F. Chen, J. Zai, M. Xu and X. Qian, J. Mater. Chem. A, 2013, 1, 4316–4326 CAS.
- A. C. Lokhande, A. A. Yadav, J. Y. Lee, M. He, S. J. Patil, V. C. Lokhande, C. D. Lokhande and J. H. Kim, J. Alloys Compd., 2017, 709, 92–103 CrossRef CAS.
- S. Das and B. B. Dhar, RSC Adv., 2014, 4, 46285–46292 RSC.
- R. Tankhiwale and S. K. Bajpai, Colloids Surf., B, 2012, 90, 16–20 CrossRef CAS PubMed.
- L. Sun, Y. Qin, Q. Cao, B. Hu, Z. Huang, L. Ye and X. Tang, Chem. Commun., 2011, 47, 12628–12630 RSC.
- N. M. Shinde, A. C. Lokhande and C. D. Lokhande, J. Photochem. Photobiol., B, 2014, 136, 19–25 CrossRef CAS PubMed.
- N. Shinde, A. Lokhande, J. Bagi and C. Lokhande, Mater. Sci. Semicond. Process., 2014, 22, 28–36 CrossRef CAS.
- R. Saravana Kumar, S. Maddirevula, M. Easwaran, S. H. S. Dananjaya and M. D. Kim, RSC Adv., 2015, 5, 106400–106405 RSC.
- H. Yang, L. A. Jauregui, G. Zhang, Y. P. Chen and Y. Wu, Nano Lett., 2012, 12, 540–545 CrossRef CAS PubMed.
- J. J. Hostynek and H. I. Maibach, Rev. Environ. Health, 2003, 18, 153–183 CAS.
- S. Okano, S. Takeshita and T. Isobe, Mater. Lett., 2015, 145, 79–82 CrossRef CAS.
- F. Chen, J. Zai, M. Xu and X. Qian, J. Mater. Chem. A, 2013, 1, 4316–4326 CAS.
- W. Li, X. Han, Y. Zhao, L. Liu, J. Wang, S. Yang and T. Tanaka, Mater. Lett., 2014, 125, 167–170 CrossRef CAS.
- N. Tipcompor, S. Thongtem and T. Thongtem, Superlattices Microstruct., 2015, 85, 488–496 CrossRef CAS.
- Q. Liu, Z. Zhao, Y. Lin, P. Guo, S. Li, D. Pan and X. Ji, Chem. Commun., 2011, 47, 964–966 RSC.
- L. Yi, D. Wang and M. Gao, Chem. Eng. Commun., 2012, 14, 401–404 CAS.
- J. Chang and E. R. Waclawik, Chem. Eng. Commun., 2013, 15, 5612–5619 CAS.
- M. Kruszynska, J. Parisia and J. Kolny-Olesiaka, Z. Naturforsch., A: Phys. Sci., 2014, 69, 446–450 CrossRef CAS.
- M. Nakashima, T. Yamaguchi, H. Itani, J. Sasano and M. Izaki, Phys. Status Solidi C, 2015, 12, 761–764 CrossRef CAS.
- R. G. Pearson, J. Chem. Educ., 1968, 45(9), 581 CrossRef CAS.
- M. R. J. Salton and K.-S. Kim, Medical Microbiology, 4th edn, 1996, ch. 2 Search PubMed.
- M. Valodkar, S. Modi, A. Pal and S. Thakore, Mater. Res. Bull., 2011, 46, 384–389 CrossRef CAS.
- X. Hou, Y. Li, J. J. Yan and C. W. Wang, Mater. Res. Bull., 2014, 60, 628–633 CrossRef CAS.
- I. Sondi and B. Salopek-Sondi, J. Colloid Interface Sci., 2004, 275, 177–182 CrossRef CAS PubMed.
Footnote |
| † Electronic supplementary information (ESI) available. See DOI: 10.1039/c7ra05194h |
| This journal is © The Royal Society of Chemistry 2017 |

