 Open Access Article
Fabricating an anionic polyacrylamide (APAM) with an anionic block structure for high turbidity water separation and purification†
Li Feng ab,
Huaili Zheng*ab,
Baoyu Gaoc,
Shixin Zhangab,
Chuanliang Zhaoab,
Yuhao Zhouab and
Bincheng Xuab
aKey Laboratory of the Three Gorges Reservoir Region's Eco-Environment, Ministry of Education, Chongqing University, Chongqing 400045, China. E-mail: zhl6512@126.com; Fax: +86 23 65120827; Tel: +86 23 65120827
bNational Centre for International Research of Low-carbon and Green Buildings, Chongqing University, Chongqing 400045, China
cShandong Key Laboratory of Water Pollution Control and Resource Reuse, School of Environmental Science and Engineering, Shandong University, Jinan 250100, China
First published on 1st June 2017
Abstract
Ultraviolet (UV)-initiated template polymerization (UTP) was used as a feasible strategy to prepare a novel anionic polyacrylamide (APAM) with a microblock structure. In the template copolymerization system, acrylamide (AM) and sodium allylsulfonate (SAS) were used as monomers, and poly (allylammonium chloride) (PAAC) as a template. The chemical properties of the polymers were observed by Fourier transform infrared spectroscopy (FT-IR), scanning electron microscope (SEM), 1H (13C) nuclear magnetic resonance spectroscopy (1H (13C)), and thermogravimetry/differential scanning calorimetry (TG/DSC). Results showed that the novel anionic microblock structure was formed in the template copolymer. Besides, the results of the association constant (KM) indicated that the copolymerization followed I Zip-up (ZIP) template polymerization mechanism, which indicated the formation of the microblock structure again. Parameters such as pH and dosage that affected the flocculation performance, flocculation kinetics and the FTIR spectra of the generated flocs were investigated to further observe the effect of anionic microblocks on flocculation performance and understand the relationship between the flocs and flocculants. Flocculation experimental results demonstrated that the anionic microblocks in the template copolymer could enhance the charge neutralization and bridging ability, and therefore an excellent flocculation performance of treating high turbidity water was observed.
1. Introduction
The increasing establishment of mining and processing plants, smelting plants and coking factories have contributed much to the national economic and societal development.1–3 However, the industry waste water generated by these plants severely destroys and pollutes the natural water environment and further threatens human health, since this industry waste water is infamous for high turbidity caused by high levels of suspended solids (SS).4–6 The task of separating suspended solids becomes more and more challenging and hard because these suspended solids are always negatively/positively charged and these colloidal particles suspend stably in the water.7 According to statistics, the turbidity of the waste water has reached 10![[thin space (1/6-em)]](https://www.rsc.org/images/entities/char_2009.gif) 000 NTU in some cases in China.8 Therefore, it becomes an important issue for environment engineers to separate and remove these suspended solids form waste water efficiently.
000 NTU in some cases in China.8 Therefore, it becomes an important issue for environment engineers to separate and remove these suspended solids form waste water efficiently.
In the process of waste water treatment, flocculation is regarded as an important purification technique and has been widely applied due to its prominent advantages such as high efficiency, low cost and simple operation compared with other purification techniques.9,10 As a common and widely used flocculant, the synthetic polyelectrolyte, especially the anionic polyacrylamide (APAM) has got more and more attention in waste water treatment because its excellent solid-water separation performance. On one hand, the particles with opposite charge can be thoroughly neutralized and destablized by the anionic chemical group.11,12 On the other hand, these destabilized particles will be captured by the molecule chain of APAM to agglomerate and form large and compact flocs, and thus flocculation occurs.13 During the solid-water separation process, the main mechanisms involved are charge neutralization, bridging and electrostatic patching, which have been demonstrated by many previous studies.14,15 Up to now, a series of anionic polyacrylamide with high flocculation performance have been developed and applied in the waste water treatment.16,17 However, the defect of the APAM, namely, the disordered and random distribution of anionic units in the polymer chain, seriously restricts the further enhancement of the solid-water separation ability. In addition to the molecular weight (MW) and the density of the anionic monomer, the configuration and the distribution of anionic units also affect the final flocculation performance.18 If the anionic units orderly distributes in the polymer chain of APAM to form the anionic microblock structure, the negative charge of the anionic group becomes more centralized and will neutralize the positive charged particles completely, thus increasing the charge neutralization ability.19 Meanwhile, the strong repulsive force between anionic microblocks are advantageous for the stretch and extension of the polymer chain, and therefore the bridging ability of the polymer is improved.20 Now, the most critical issue is to search for a new approach to prepare the novel APAM with microblock structure, whereas it is incapable for traditional synthesis methods.
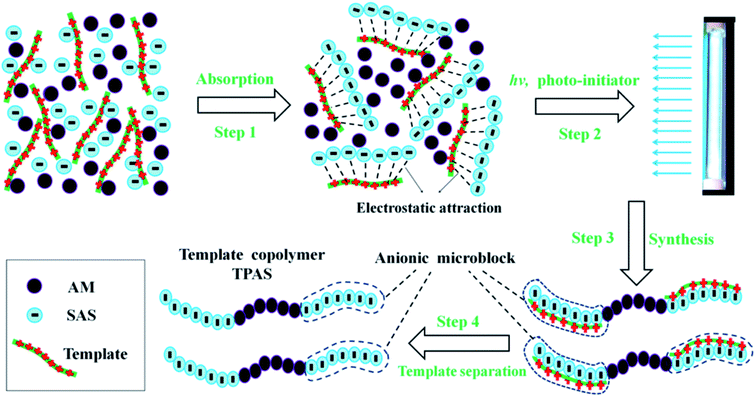
Fortunately, the appearance of template polymerization technology which has been used to synthesize nanowire and nanopore arrays, nanostructures, medical drugs and et al. will provide a new way in the study of synthesizing the anionic polymer.21–24 In order to acquire the novel microblock structures in the anionic polymer chain, the template with a controllable length will work as a matrix to arrange and assemble the anionic monomers. In this study, poly (allylammonium chloride) (PAAC) was chosen as template because PAAC with positive charge not only adsorbs and arranges the anionic monomers on its polymer chain to form pre-microblock structures under electrostatic attraction, but also has a property of easy separation from the copolymer system.25 Furthermore, ultraviolet (UV)-initiated polymerization can be employed to prepare the copolymer because of its relative advantages such as high efficiency, low cost and environment-friendly.26 Therefore, UV-initiated template polymerization (UTP) was used to synthesize the flocculant with a microblock structure in the polymer chain, and the possible route for prepare the template copolymer is shown in Fig. 1. Acrylamide (AM) and sodium allylsulfonate (SAS) were categorized as the safe and cheap monomers which have been widely used in the preparation of flocculants.27,28 Meanwhile, the previous researches have manifested that AM and SAS were harmless and eco-friendly, and therefore AM and SAS were selected to prepare template copolymer (TPAS) through UPT and it has prospective applications in water treatment in future.29,30 This new way for preparation of a new anionic copolymer with a microblock structure will be meaningful and significant in polymer synthesis and application.
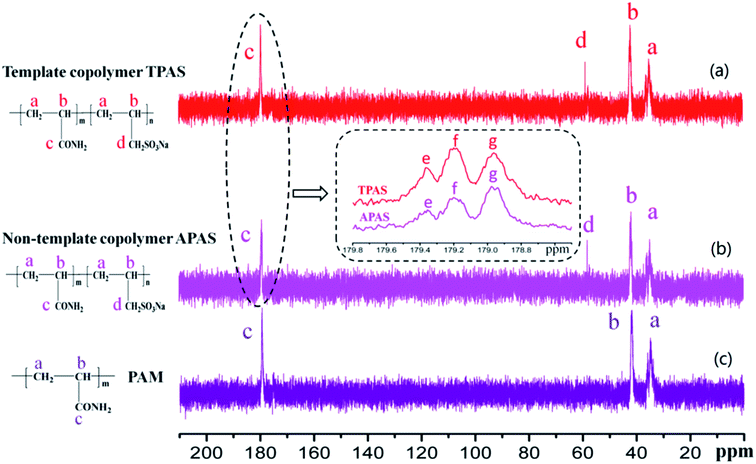
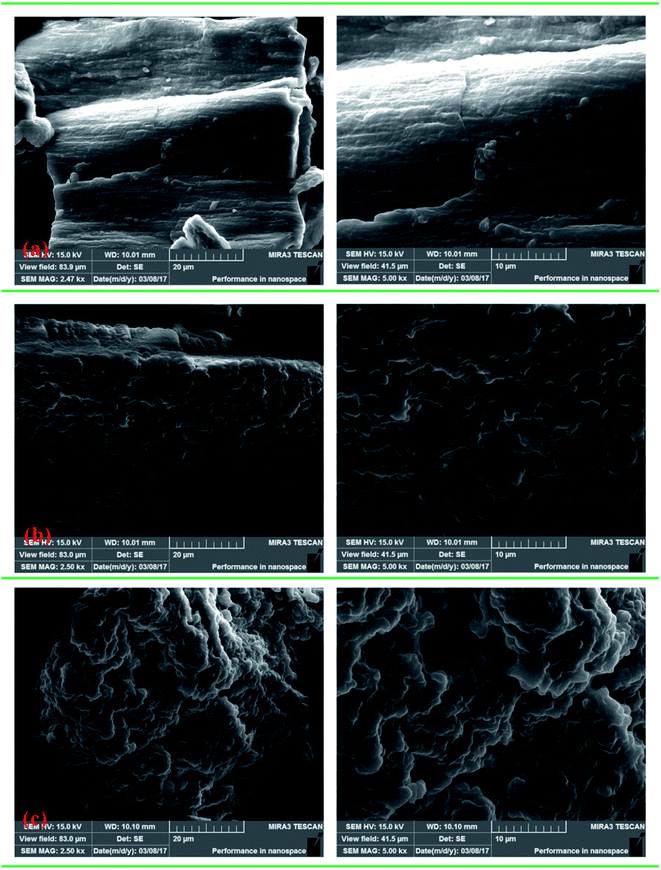
Considering all aforementioned factors, this study attempts to (1) synthesize the template copolymer (TPAS) with the anionic microblock structure through UTP using AM and SAS as monomers, and PAAC as template; (2) elaborate the template polymerization mechanism through the analysis of the association constant KM; (3) characterize the chemical structure of polymers using FT-IR, scanning electron microscope (SEM), 1H (13C) NMR and TGA; (4) investigate the flocculation kinetic of the flocculants and the influence of the pH and dosage on the flocculation performance; and (5) summarize the flocculation mechanism through the investigation of zeta potentials and the FTIR spectra of the formed flocs.
2. Materials and methods
2.1. Materials
The monomer AM and SAS were purchased from Chongqing Lanjie Tap Water Company (Chongqing, China). Urea [CO(NH2)2] and initiator 2,2′-azobis[2-(2-imidazolin-2-yl)propane]dihydrochloride (VA-044) were sourced from Apotheker Chemical Reagent Co., Ltd. (Chendou, China). Besides, template poly (allylammonium chloride) (PAAC) was obtained from Shandong Xintai Water Treatment (Zaozhuang, China), and its molecular weight (MW) was 4200. The above reagents were of analytical grade except for AM and SAS (technical grade). The hematite powder (Fe ≥ 91%, 100 mesh size) was purchased from Lingshou jiashuo building materials processing Co., Ltd. (Lingshou, China).Commercial flocculants APAM-1 [copolymerization of AM and sodium methylacrylsulfonate (SAMS)] and APAM-2 [copolymerization of AM and 2-acrylamide-2-methylpro panesulfonic acid (AMPS)] were used for comparison in flocculation test, and their intrinsic viscosities were all of 7.8 dL g−1.
2.2. Preparation of copolymers
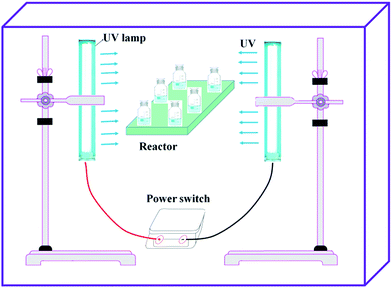
The experimental setup of UV-initiated template copolymerization was shown in Fig. 2, and the preparation procedures for template copolymer TPAS were as follows: 70 mmol of AM, 30 mmol of SAS, 0.241 mmol of urea, 30 mmol of PAAC (nPAAC![[thin space (1/6-em)]](https://www.rsc.org/images/entities/char_2009.gif) :
:![[thin space (1/6-em)]](https://www.rsc.org/images/entities/char_2009.gif) nAA = 1
nAA = 1![[thin space (1/6-em)]](https://www.rsc.org/images/entities/char_2009.gif) :
:![[thin space (1/6-em)]](https://www.rsc.org/images/entities/char_2009.gif) 1) and 0.774 mol of deionized water were dissolved in a 100 mL glass vessel with a seal cover, followed by the adjustment of pH to the set value by 0.5 mol L−1 HCl and NaOH., the solution was bubbled through nitrogen for 30 min to remove oxygen and sealed immediately after addition of initiator VA-044 (0.045 mmol). Subsequently, the mixture was exposed under the ultraviolet wave radiation generated by a UV lamp (wavelength: 365 nm; power: 80 W) for 70 min at room temperature to finish copolymerization. At last, the solid product was purified by acetone and dried in a vacuum oven at 95 °C for 24 h. Besides, the non-template copolymer APAS was prepared in the absence of template, and the remaining parameters and synthetic procedures were same as those of TPAS.
1) and 0.774 mol of deionized water were dissolved in a 100 mL glass vessel with a seal cover, followed by the adjustment of pH to the set value by 0.5 mol L−1 HCl and NaOH., the solution was bubbled through nitrogen for 30 min to remove oxygen and sealed immediately after addition of initiator VA-044 (0.045 mmol). Subsequently, the mixture was exposed under the ultraviolet wave radiation generated by a UV lamp (wavelength: 365 nm; power: 80 W) for 70 min at room temperature to finish copolymerization. At last, the solid product was purified by acetone and dried in a vacuum oven at 95 °C for 24 h. Besides, the non-template copolymer APAS was prepared in the absence of template, and the remaining parameters and synthetic procedures were same as those of TPAS.
2.3. Characteristics of copolymers
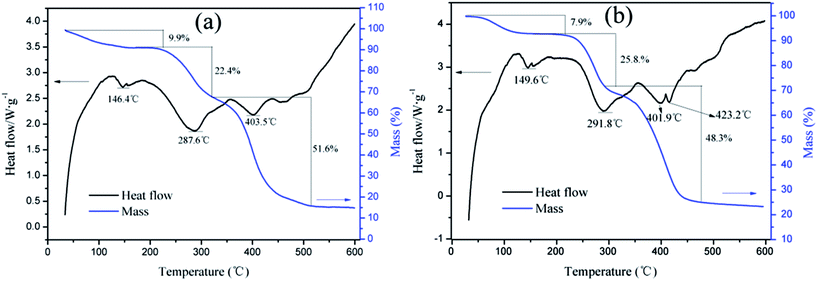
The intrinsic viscosities of polymers (η) used to assess the absorption and bridging ability was conducted on an Ubbelohde viscosity meter (Shanghai Shenyi Glass Instrumental Co. Ltd., China) in a 2 mol L−1 aqueous NaCl solution at 30 °C,13 and the molecular weight of the polymer was calculated by huggins equation displayed in ESI Text S1.† Moreover, the FT-IR was performed on a 550 Series II infrared spectrometer (Mettler Toledo Instruments Co., Ltd., Switzerland) to record the polymer function groups. 1H (13C) NMR of the products were recorded by an Avance 500 nuclear magnetic resonance spectrometer (Bruker Company, Ettlingen, Germany) in deuterium oxide (D2O). SEM analysis was performed on MIRA 3 LMU SEM system (TES-CAN Company, Czech Republic) to observe the morphologies of the copolymers. Besides, TGA and differential scanning calorimetry (DSC) of the polymers were conducted on a DTG-60H synchronal thermal analyzer (Shimadzu, Kyoto, Japan) at a heating rate of 10 °C min−1 under argon atmosphere from 20 to 600 °C.2.4. Determination of KM
The type and mechanism of the template polymerization could be determined and revealed through the investigation of the association constant (KM) between SAS and PAAC according to the previous researche.31 The KM was examined using bag filter method, and its core part was a dialysis bag (Intercepted, MWCO 10000, MD 25, USA).19 The operational approach of the bag filter method was described as follows. The dialysis bag with a given dose of template PAAC (MW, 10![[thin space (1/6-em)]](https://www.rsc.org/images/entities/char_2009.gif) 000) was soaked in deionized water for dialysis. After 24 h dialysis, the molecular weight of PAAC in the dialysis bag would become similar because the low molecular weight PAAC (<10
000) was soaked in deionized water for dialysis. After 24 h dialysis, the molecular weight of PAAC in the dialysis bag would become similar because the low molecular weight PAAC (<10![[thin space (1/6-em)]](https://www.rsc.org/images/entities/char_2009.gif) 000) would be removed during the process of dialysis. The precipitation of the intercepted PAAC occurred when a certain amount of acetone was added in the dialysis bag, and the precipitation was dried in a vacuum oven at 60 °C for 24 h. After that, a given dose of SAS and PAAC precipitation were added into a glass beaker with 100 mL deionized water (pH = 6). Subsequently, the glass beaker was sealed and kept for 24 h at room temperature to arrive a penetration balance. At last, the KM was obtained through the eqn (1):
000) would be removed during the process of dialysis. The precipitation of the intercepted PAAC occurred when a certain amount of acetone was added in the dialysis bag, and the precipitation was dried in a vacuum oven at 60 °C for 24 h. After that, a given dose of SAS and PAAC precipitation were added into a glass beaker with 100 mL deionized water (pH = 6). Subsequently, the glass beaker was sealed and kept for 24 h at room temperature to arrive a penetration balance. At last, the KM was obtained through the eqn (1):
 | (1) |
2.5. Flocculation test
In this part, the flocculation efficiency of the template copolymers TPAS and non template copolymer APAS were evaluated by the treatment of simulated industry high turbidity water. Meantime, commercial flocculants (APAM-1, APAM-2) were used to make a comparison with TPAS and APAS. The simulated industry high turbidity water was prepared as follows. 3 g hematite powders were added in 1000 mL glass beaker with 1000 mL deionized water, and then stirred at 300 rpm·per min for 20 min. Finally, the above liquid mixture was thoroughly dispersed under ultrasonic radiation for 10 min. In order to make the controlled trial become more credible and persuasive, the flocculants used in this flocculation test were all of same intrinsic viscosity and anionic monomer content, and the details of these flocculants were described in Table 1. The flocculation tests were performed on a program-controlled Jar-test apparatus (ZR4-6, Zhongrun Water Industry Technology Development Co. Ltd., China) at ambient temperature. The pH of these simulated high turbidity water (1000 mL) was adjusted to the given value by HCl (0.5 mol L−1) and NaOH (0.5 mol L−1) after adding them into a 1000 mL glass beaker. The flocculation tests contained three procedures, and they were a rapid stirring at 200 rpm for 1 min, a slow stirring at 40 rpm for 15 min and a setting period of 15 min without disturbance.32 After these procedures, the turbidity was examined by a 2100P turbidity meter (HACH, Loveland, CO) and the zeta potential of supernatant collect from 2 cm below the water surface was recorded on a Zetasizer Nano ZS90 (Malvern Instruments Ltd., Malvern, UK). Flocculation behaviors of the polymers were evaluated in terms of turbidity removal rate (TR), flocs size, zeta potential and flocculation kinetic. Flocs size was investigated by a laser diffraction instrument (Mastersizer 2000, Malvern, U.K.). Each results was an average of three repeated test and the standard interval was controlled less than 5%.| Flocculantsa | Anionic monomer molar content (%) | Intrinsic viscosity (dL g−1) | Conversion rate (%) | Synthetic method |
|---|---|---|---|---|
| a TPAS: copolymer of SAS and AM by UV-initiated template copolymerization (UTP); APAS: copolymer of SAS and AM by non UV-initiated template copolymerization (N-UTP); PAM: homopolymer of AM by N-UTP; APAM-1: commercial copolymer of SAMS and AM; APAM-2: commercial copolymer of AMPS and AM. | ||||
| TPAS | 30.0 | 7.89 | 99.6 | UTP |
| APAS | 30.0 | 7.83 | 99.4 | N-UTP |
| PAM | — | 7.85 | 99.8 | N-UTP |
| APAM-1 | 30.0 | 7.85 | — | — |
| APAM-2 | 30.0 | 7.85 | — | — |
3. Results and discussion
3.1 Characterization of flocculants
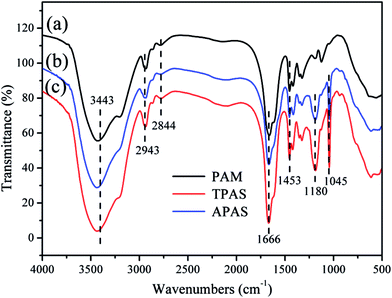
![[double bond, length as m-dash]](https://www.rsc.org/images/entities/char_e001.gif) O adsorption peaks were observed at 3443 cm−1 and 1666 cm−1, respectively.31 The asymmetric stretching vibration at 2943 cm−1 and 2844 cm−1 were caused by –CH3 and for –CH2 groups, respectively.19 The peak at 1453 cm−1 resulted from the deformation stretching vibration of methylene group. Compared with PAM, the characteristic absorption peaks of APAS and TPAS were shown at 1180 cm−1 and 1045 cm−1, which resulted from the sulfo group in the monomer SAS.33 Based the above analysis results, it revealed that the APAS and TPAS were successfully copolymerized by AM and SAS. Moreover, the FT-IR spectra of APAS and TPAS were very similar besides some slight shift in the peak area, which indicated that TPAS have the same functional group structures as APAS.
O adsorption peaks were observed at 3443 cm−1 and 1666 cm−1, respectively.31 The asymmetric stretching vibration at 2943 cm−1 and 2844 cm−1 were caused by –CH3 and for –CH2 groups, respectively.19 The peak at 1453 cm−1 resulted from the deformation stretching vibration of methylene group. Compared with PAM, the characteristic absorption peaks of APAS and TPAS were shown at 1180 cm−1 and 1045 cm−1, which resulted from the sulfo group in the monomer SAS.33 Based the above analysis results, it revealed that the APAS and TPAS were successfully copolymerized by AM and SAS. Moreover, the FT-IR spectra of APAS and TPAS were very similar besides some slight shift in the peak area, which indicated that TPAS have the same functional group structures as APAS.
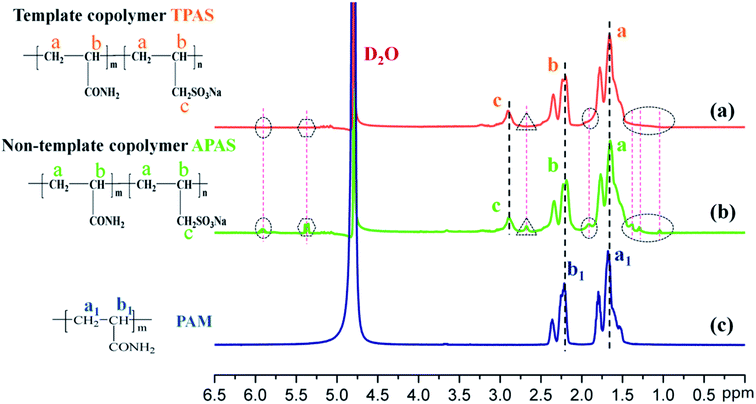
| Flocculantsb | F(AAA) (%) | F(AAS) (%) | F(SAS) (%) |
|---|---|---|---|
| a A, AM unit; S, SAS unit; e, SAS; f, AAS; and g, AAA.b TPAS: copolymer of SAS and AM by UV-initiated template technique; APAS: copolymer of SAS and AM by UV-initiated copolymerization; AAA to SAS: mole fraction of the F(AAA) triad sequence to F(SAS) triad sequence. | |||
| APAS | 37.3 | 58.3 | 4.4 |
| TPAS | 49.7 | 45.2 | 4.1 |
3.2 The association constant (KM) and template polymerization mechanism
In order to deeply and systematically understand ultraviolet-initiated template polymerization system, its mechanism was discussed and determined through the investigation of association constant (KM). In this study, a KM value of 12.01 was obtained at nSAS![[thin space (1/6-em)]](https://www.rsc.org/images/entities/char_2009.gif) :
:![[thin space (1/6-em)]](https://www.rsc.org/images/entities/char_2009.gif) nAM = 1, which indicated that approximately three quarters of the SAS was pre-absorbed and anchored on the polymer molecular chain of template PAAC to form precursor of microblock structure under the electrostatic force, and the precursor was homopolymerized by ultraviolet-initiated radiation to breed a microblock segment.31 Thus, the UV-initiated template polymerization mechanism belonged to ZIP (I) mechanism rather than Pick-up (II) mechanism.35 Meanwhile, the ZIP (I) template polymerization mechanism vividly exhibited in Fig. 8 provided another powerful support for the formation of the anion microblock structure in TPAS.
nAM = 1, which indicated that approximately three quarters of the SAS was pre-absorbed and anchored on the polymer molecular chain of template PAAC to form precursor of microblock structure under the electrostatic force, and the precursor was homopolymerized by ultraviolet-initiated radiation to breed a microblock segment.31 Thus, the UV-initiated template polymerization mechanism belonged to ZIP (I) mechanism rather than Pick-up (II) mechanism.35 Meanwhile, the ZIP (I) template polymerization mechanism vividly exhibited in Fig. 8 provided another powerful support for the formation of the anion microblock structure in TPAS.
4 Flocculation performance
4. 1. Effect of flocculant dosage
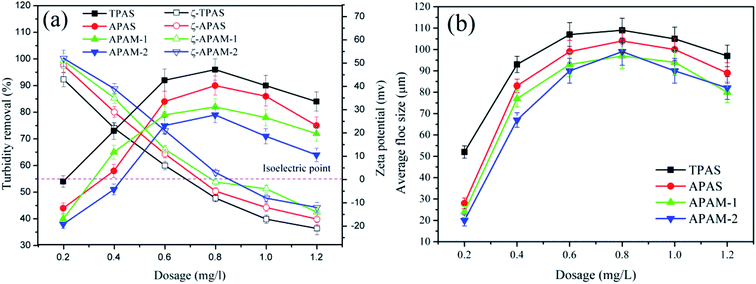
Due to the strong charge repulsion generated by innumerable positive charged hematite particles in the water solution, the high turbidity waste water system became more stable and resulted in troubles for solid–liquid separation. Therefore, adequate dose of flocculant with opposite charge was needed to break the stability of the hematite colloid particles. In Fig. 9, the impact of flocculant dosage on the turbidity removal rate (TR), zeta potential and floc size was investigated. Both TR and floc size first increased and then decreased, whereas zeta potential decreased in the full dosage range (0.2 to 1.2 mg L−1). At the relatively low dosage range (<0.8 mg L−1), the flocculant showed a increasing efficiency in neutralizing and capturing the positive charged hematite particles with the increasing dosage. By contrast, the excessive dosage leaded to a cake effect and electrostatic repulsion which prevented the floc growth and reducing the flocculation efficiency, and thus a deterioration of the flocculation performance was observed.39 Compared with APAS, APAM-1 and APAM-2, TPAS had the highest TR and the largest floc size but the lowest zeta potential in the full range of dosage. For example, the TPAS reached the desirable flocculation performance (TR: 96.1%; floc size: 109 μm; and zeta potential: −8.3 mv) at the optimal dosage of 0.8 mg L−1. The negative charge density in the anionic microblocks was extremely enhanced, hence the charge neutralization ability of TPAS was improved. Consequently, more and more positive charged hematite particles were neutralized and destabilized completely by the anionic microblocks, and then formed large flocs under the effect of bridging.26 Previous research had also found the similar phenomenon of enhancing charge neutralization ability when the flocculant was characterized by a novel microblock structure. Moreover, the optimal dosage for each flocculant was near at that of isoelectric point, which indicated that the bridging also played an important role in the flocculation process other than charge neutralization.364.2. Effect of pH
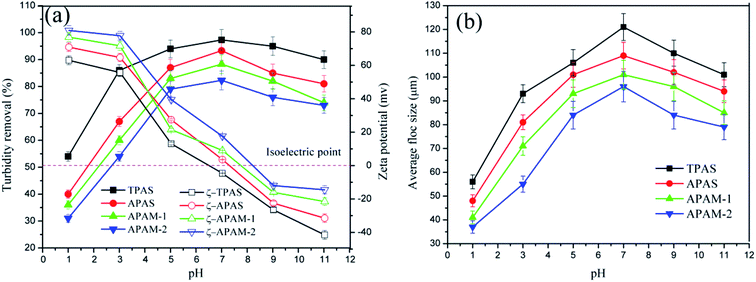
In addition to flocculant dosage, the effects of pH on turbidity removal, zeta potential, and floc size were investigated at the optimal dosage of 0.8 mg L−1, and the results were shown in Fig. 10. It was more clearly that the four flocculants displayed a similar flocculation variation tendency under various pH values (pH: 1.0–11.0). A sharp and rapid increase in turbidity removal and floc size was observed at the pH range of 1–3, which indicated that the flocculation performance was greatly affected by the strong acid condition. The strong acid led to a strong charge repulsion between the hematite particles and a protonation of amino group (–NH3+), hence a worse flocculation phenomenon occurred.40 The turbidity removal and floc size did not showed an exaggerated variation on alkali conditions (pH: 9.0–11.0), compared with those on acid conditions (pH: 1.0–3.0). When the pH condition was alkali, more and more negatively charged hydroxyl (OH−) would be attracted by the positively charged hematite particles. Theses adsorbed OH− ions tightly wrapped hematite particles to form a protective layer which decreased the combination chance between the flocculant and hematite particles, and therefore a deteriorative flocculation performance happened. Furthermore, TPAS displayed the highest turbidity removal and the largest floc size in the full range of pH, whereas the zeta potential was the minimum among the flocculants. Because of the anionic microblocks in the TPAS molecular chain, the strong repulsion between microblocks became especially strong and the polymer chain represented a more linear configuration, which was more capable for the reduction of molecular cross-linking occurrence and the enhancement of bridging.31 Therefore, the TPAS showed a prominent flocculation performance even under the strong acid and alkali conditions with high charge repulsion. Finally, the acceptable flocculation occurrence for TPAS was in a wider pH range (pH: 3–11) than those of the other three (pH: 5–9), which indicated that TPAS could be widely applied in the practical solid–liquid separation.4.3. Kinetic investigation
The flocculation kinetics of the four flocculants were investigated at the optimal conditions (dosage = 0.8 mg L−1, pH = 7) to further evaluate the effect of microblock structure on the flocculation performance. The turbidity for each flocculant was recorded after the termination of the slow string (slow stirring at 50 rpm for 15 min) in each flocculation test with the same interval (3 min), and the calculation of TR was shown in Fig. 11(a). Meanwhile, in order to obtain the flocculation kinetic value for each flocculant, eqn (2) was set according to the previous research, and it was shown as follows.41
 | (2) |
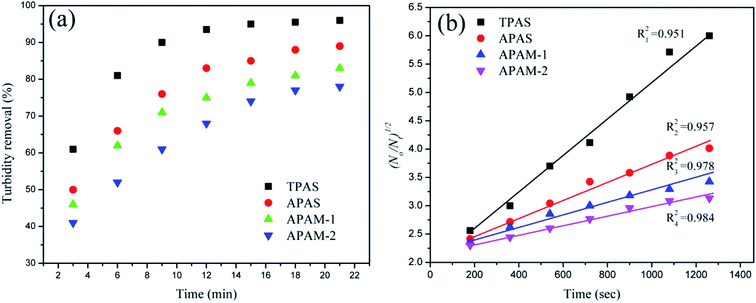 | ||
| Fig. 11 The variation of turbidity removal (a) and(b) (N0/Nt)1/2 as a function of setting time for different flocculants. | ||
| Flocculants | Flocculation kinetics kN0 (×10−4 s−1) | R2 |
|---|---|---|
| TPAS | 33.75 | 0.951 |
| APAS | 15.83 | 0.957 |
| APAM-1 | 11.12 | 0.978 |
| APAM-2 | 7.64 | 0.984 |
Based on the above results, it was found that the four flocculants displayed a similar TR trend of increasing gradually to a plateau shown in Fig. 11(a), whereas the TPAS increased rapidly during the first of 9 min. Moreover, in Fig. 11(b), the slope of the simulated curve for TPAS (kN0 = 33.75 × 10⁻⁴ s−1) was the largest among the flocculants, which manifested that the TPAS flocculated the positive charged hematite particles so efficiently and the RT was improved so significantly. The anionic microblocks attracted and neutralized the positive charged particles quickly through strong charge neutralization, and thus the hematite particles lost their stabilization. Subsequently, the inactive hematite particles were captured and anchored by the molecular chain of TPAS to form a large and compact floc structure shown in ESI Fig. S1.† Thus, these flocs had a fast sedimentation velocity and the turbidity declined sharply. On the contrary, the random distribution of anionic monomer in APAS, APAM-1 and APAM-2 extremely weakened the charged neutralization ability and a part of hematite particles could not be neutralized completely. As a result, the generated flocs shown in ESI Fig. S2† was small and loose, and thereby APAS, APAM-1 and APAM-2 displayed a higher turbidity and a lower kinetic constant, compared with those of TPAS. Moreover, the TPAS also displayed a desirable flocculation efficiency compared with the previous results of the published works.42,43
4.4. FTIR analysis of the flocs
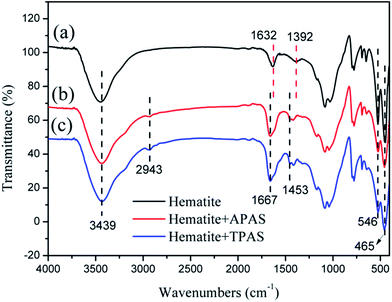
As reported previously, the FTIR spectra of the generated flocs were measured to investigated the interaction between the flocculant and hematite particles.44 In Fig. 12, before flocculation, the hematite particles showed the following adsorption peaks. The adsorption peaks at 3439 cm and 1632 cm were attributed to the water of hydration;45 The bending frequency of surface hydroxyl group was observed at 1392 cm;46 And the adsorption peaks at 546 cm and 465 cm were assigned to Fe–O vibrational mode.47 After flocculation, these peaks all observed in hematite + APAS and hematite + TPAS. Meanwhile, the characteristic peaks of both APAS and TPAS were observed at 2943 cm (–CH3), 1167 cm (C![[double bond, length as m-dash]](https://www.rsc.org/images/entities/char_e001.gif) O) and 1453 cm (–CH2–N+) in hematite + APAS and hematite + TPAS. Based on the above results. It indicated that hematite particles were flocculated by APAS and TPAS and separated from the liquid. Besides, in addition to the original chemical bonds of hematite, APAS and TPAS, new chemical bonds were not observed in the FTIR spectra of hematite + APAS and hematite + TPAS, thus indicating that the flocculation occurrence was caused by electrostatic interaction and bridging rather than chemical reaction between hematite and the flocculant.48
O) and 1453 cm (–CH2–N+) in hematite + APAS and hematite + TPAS. Based on the above results. It indicated that hematite particles were flocculated by APAS and TPAS and separated from the liquid. Besides, in addition to the original chemical bonds of hematite, APAS and TPAS, new chemical bonds were not observed in the FTIR spectra of hematite + APAS and hematite + TPAS, thus indicating that the flocculation occurrence was caused by electrostatic interaction and bridging rather than chemical reaction between hematite and the flocculant.48
4.5. Flocculation mechanism
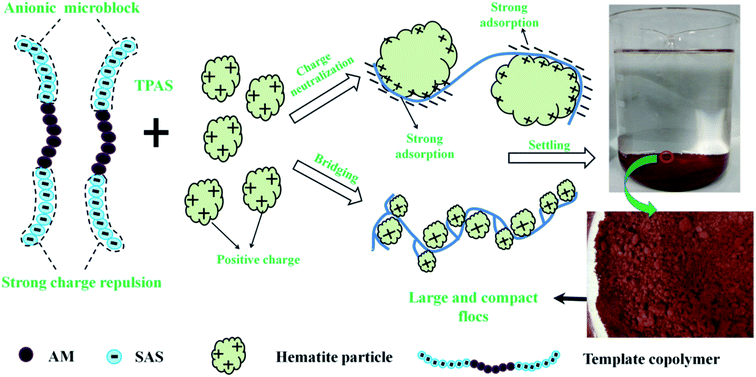
The mechanism involved in the flocculation process was discussed and summarized, and it was illustrated in Fig. 13. Two dominant flocculation mechanisms, namely, charge neutralization and bridging, contributed much to the prominent flocculation performance of TPAS such as high TR, large and compact floc size, and high kinetic constant. The charge density and intensity was extremely enhanced by the anionic microblocks of TPAS, and thus the charge neutralization ability was greatly improved. However, the situation for the other three flocculants was just opposite, and the disorder and random distribution of anionic monomers caused a discount for their charge neutralization ability. When the TPAS was added, the positive charge particles were absorbed on the surface of the polymer and tightly combined with the polymer chain of TPAS trough charge neutralization rather than chemical bond. Meanwhile, the anionic microblocks of TPAS was more favorable for the improvement of the bridging ability. The strong charge repulsion generated by the anionic microblocks contributed much to the stretch and extension of TPAS polymer chain, and therefore more active position would be exposed to capture the particles to aggregate and form large and compact flocs. At last, the flocs conditioned by TPAS sank fast to bottom, which was more facile for the solid–liquid separation.5. Conclusions
A new anionic flocculant TPAS with the microblock structure was successfully synthesized through UV-initiated polymerization. The structure properties of TPAS was characterized by the FT-IR, 1H (13C) NMR, SEM and TG/DSC, and the results indicated that the formation of the microblock structure. Meanwhile, the template polymerization mechanism was demonstrate to be I (ZIP) mechanism through a high KM value (KM: 12.01), and which also provided another proof for the generation of the microblock structure. The flocculation test for the removal of hematite particles indicated that TPAS with the microblock structure had an excellent flocculation performance through the enhancement of charge neutralization and bridging ability. A stable and powerful bond but not chemical bond was generated between the anionic microblock structure and hematite particles under the effect of charge neutralization and bridging. In this case, the flocs flocculated by TPAS were compact and large. Meanwhile, the reaction rate and turbidity remove rate was also the fast and highest, respectively, for TPAS among the flocculants.Acknowledgements
The authors are grateful for the financial support provided by the National Natural Science Foundation of China (Project No. 21677020 and 21477010).References
- C. J. Chen, B. Chen, Z. Li and Z. Q. Wang, Important role of magma mixing in generating the Mesozoic monzodioritic–granodioritic intrusions related to Cu mineralization, Tongling, East China: Evidence from petrological and in situ Sr-Hf isotopic data, Lithos, 2016, 248, 80–93 CrossRef.
- L. Chen, Z. D. Hao, T. Z. Yang, H. Xiao, W. F. Liu, D. C. Zhang, S. Bin and W. D. Bin, An Efficient Technology for Smelting Low Grade Bismuth-Lead Concentrate: Oxygen-Rich Side BlowProcess, JOM, 2015, 67, 1997–2004 CrossRef CAS.
- A. Tremel, T. Haselsteiner, C. Kunze and H. Spliethoff, Experimental investigation of high temperature and high pressure coal gasification, Appl. Energy, 2012, 92, 279–285 CrossRef CAS.
- R. D. Li, W. W. Zhao, Y. L. Li, W. Y. Wang and X. Zhu, Heavy metal removal and speciation transformation through the calcination treatment of phosphorus-enriched sewage sludge ash, J. Hazard. Mater., 2015, 28, 423–431 CrossRef PubMed.
- Y. X. Yu, G. Cheng, L. Q. Ma, G. Huang, L. Wu and H. X. Xu, Effect of agitation on the interaction of coal and kaolinite in flotation, Powder Technol., 2017, 313, 122–128 CrossRef CAS.
- T. Nasim and A. Bandyopadhyay, Introducing different poly(vinyl alcohol)s as new flocculant for kaolinated waste water, Sep. Purif. Technol., 2012, 88, 87–94 CrossRef CAS.
- M. S. Silverstein, Emulsion-templated porous polymers: A retrospective perspective, Polymer, 2014, 55, 304–320 CrossRef CAS.
- C. Y. Hua, S. L. Lo, C. L. Chang, F. L. Chen, Y. D. Wu and J. L. Mad, Treatment of highly turbid water using chitosan and aluminum salts, Sep. Purif. Technol., 2013, 104, 322–326 CrossRef.
- M. S. Nasser, Characterization of floc size and effective floc density of industrial papermaking suspensions, Sep. Purif. Technol., 2014, 122, 495–505 CrossRef CAS.
- L. Pérez, J. L. Salgueiro, R. Maceiras, Á. Cancela and Á. Sánchez, Study of influence of pH and salinity on combined flocculation of Chaetoceros gracilis microalgae, Chem. Eng. J., 2016, 286, 106–113 CrossRef.
- T. J. Lee, S. J. Hong, J. Y. Park and H. J. Kim, Effects of Anionic Polyacrylamide on Carbonation for the Crystallization of Precipitated Calcium Carbonate, Cryst. Growth Des., 2015, 15, 1652–1657 CAS.
- K. R. Desaia and Z. V. P. Murthya, Removal of silver from aqueous solutions by complexation – ultrafiltration using anionic polyacrylamide, Chem. Eng. J., 2012, 185, 187–192 CrossRef.
- H. L. Zheng, J. Y. Ma, C. J. Zhu, Z. Zhang, L. W. Liu, Y. J. Sun and X. Tang, Synthesis of anion polyacrylamide under UV initiation and its application in removing dioctyl phthalate from water through flocculation process, Sep. Purif. Technol., 2014, 123, 35–44 CrossRef CAS.
- B. Boltoa and J. Gregory, Organic polyelectrolytes in water treatment, Water Res., 2007, 41, 2301–2324 CrossRef PubMed.
- M. Hjorth and B. U. Jørgensen, Polymer flocculation mechanism in animal slurry established by charge neutralization, Water Res., 2012, 46, 1045–1051 CrossRef CAS PubMed.
- X. S. Yi, W. X. Shi, S. L. Yu, X. H. Li, N. Sun and C. He, Factorial design applied to flux decline of anionic polyacrylamide removal from water by modified polyvinylidene fluoride ultrafiltration membranes, Desalination, 2011, 274, 7–12 CrossRef CAS.
- J. L. Kerr, J. S. Lumsden, S. K. Russell, E. J. Jasinska and G. G. Goss, Effects of anionic polyacrylamide products on gill histopathology in juvenile rainbow trout (Oncorhynchus mykiss), Environ. Toxicol. Chem., 2014, 33, 1552–1562 CrossRef CAS PubMed.
- C. L. Zhao, H. L. Zheng, L. Feng, Y. L. Wang, Y. Z. Liu, B. Z. Liu and B. Z. Djibrine, Improvement of Sludge Dewaterability by Ultrasound-Initiated Cationic Polyacrylamide with Microblock Structure: The Role of Surface-Active Monomers, Materials, 2017, 10, 282 CrossRef.
- L. Feng, H. L. Zheng, Y. L. Wang, S. X. Zhang and B. C. Xu, Ultrasonic-template technology inducing and regulating cationic microblocks in CPAM: characterization, mechanism and sludge flocculation performance, RSC Adv., 2017, 7, 23444–23456 RSC.
- W. C. Chai, Y. W. Zhang and Y. F. Hou, Well-defined cationic polyacrylamides with dot-charges: synthesis via an aqueous living RAFT polymerization, characterization, and intrinsic viscosity, Polym. Chem., 2013, 4, 1006–1013 RSC.
- T. T. Albrecht, J. Schotter, G. A. Kästle, N. Emley, T. Shibauchi, L. Krusin-Elbaum, K. Guarini, C. T. Black, M. T. Tuominen and T. P. Russell, Ultrahigh-Density Nanowire Arrays Grown in Self- Assembled Diblock Copolymer Templates, Science, 2000, 290, 2126–2129 CrossRef.
- M. Q. Li and C. K. Ober, Block copolymer patterns and templates, Mater Today, 2006, 9, 30–39 CrossRef CAS.
- Q. L. Zhang, T. Xu, D. Butterfield, M. J. Misner, D. Y. Ryu, T. Emrick and T. P. Russell, Controlled Placement of CdSe Nanoparticles in Diblock Copolymer Templates by Electrophoretic Deposition, Nano Lett., 2005, 5, 2 Search PubMed.
- D. Sprouse, Y. M. Jiang, J. E. Laaser, T. P. Lodge and T. M. Reineke, Tuning Cationic Block Copolymer Micelle Size by pH and Ionic Strength, Biomacromolecules, 2016, 17, 2849–2859 CrossRef CAS PubMed.
- Y. X. Zhang, F. P. Wu, M. Z. Li and E. J. Wang, Novel Approach to Synthesizing Hydrophobically Associating Copolymer Using Template Copolymerization: The Synthesis and Behaviors of Acrylamide and 4-(ö-Propenoyloxyethoxy) Benzoic Acid Copolymer, J. Phys. Chem. B, 2005, 109, 22250–22255 CrossRef CAS PubMed.
- H. L. Zheng, Y. J. Sun, C. J. Zhu, J. S. Guo, C. Zhao, Y. Liao and Q. Q. Guan, UV-initiated polymerization of hydrophobically associating cationic flocculants: Synthesis, characterization, and dewatering properties, Chem. Eng. J., 2013, 234, 318–326 CrossRef CAS.
- T. Lou, X. J. Wang, G. J. Song and G. P. Cui, Synthesis and flocculation performance of a chitosan-acrylamide-fulvic acid ternary copolymer, Carbohydr. Polym., 2017, 170, 182–189 CrossRef CAS PubMed.
- X. Li, H. L. Zheng, Y. L. Wang, Y. J. Sun, B. C. Xu and C. L. Zhao, Fabricating an enhanced sterilization chitosan-based flocculants: Synthesis, characterization, evaluation of sterilization and flocculation, Chem. Eng. J., 2017, 319, 119–130 CrossRef CAS.
- Z. Yang, H. Yang, Z. W. Jiang, T. Cai, H. J. Li, H. B. Li, A. Li and R. S. Cheng, Flocculation of both anionic and cationic dyes in aqueous solutions by the amphoteric grafting flocculant carboxymethyl chitosan-graft-polyacrylamide, J. Hazard. Mater., 2013, 254, 36–45 CrossRef PubMed.
- S. H. Lv, Q. F. Zhou, Y. Y. Cui, W. Q. Yang and Y. Li, Synthesis of graphene oxide-methacrylicacid-sodium allyl sulfonate copolymer and its tanning properties, Arabian J. Chem., 2015, 6, 1–10 Search PubMed.
- X. Li, H. L. Zheng, B. Y. Gao, Y. J. Sun, B. Z. Liu and C. L. Zhao, UV-initiated template copolymerization of AM and MAPTAC: Microblock structure, copolymerization mechanism, and flocculation performance, Chemosphere, 2017, 167, 71–81 CrossRef CAS PubMed.
- Y. X. Zhao, B. Y. Gao, H. Y. Rong, H. K. Shon, J. H. Kim, Q. Y. Yue and Y. Wang, The impacts of coagulant aid-polydimethyldiallylammonium chloride on coagulation performances and floc characteristics in humic acid-kaolin synthetic water treatment with titanium tetrachloride, Chem. Eng. J., 2011, 173, 376–384 CrossRef CAS.
- K. J. Yao and G. W. Zhuo, Synthesis and Rheological Properties in Aqueous Solution of Poly(Acrylamide-co-Sodium Allylsulfonate), J. Appl. Polym. Sci., 1992, 44, 1–7 CrossRef CAS.
- Y. Liao, H. L. Zheng, L. Qian, Y. j. Sun, L. Dai and W. W. Xue, UV-Initiated Polymerization of Hydrophobically Associating Cationic Polyacrylamide Modified by a Surface-Active Monomer: A Comparative Study of Synthesis, Characterization, and Sludge Dewatering Performance, Ind. Eng. Chem. Res., 2014, 53, 11193–11203 CrossRef CAS.
- L. Feng, H. L. Zheng, B. Y. Gao, C. L. Zhao, S. X. Zhang and N. Chen, Enhancement of textile-dyeing sludge dewaterability using a novel cationic polyacrylamide: role of cationic block structures, RSC Adv., 2017, 7, 11626–11635 RSC.
- W. Chen, H. L. Zheng, Q. Q. Guan, H. K. Teng, C. L. Zhao and C. Zhao, Fabricating a Flocculant with Controllable Cationic Microblock Structure: Characterization and Sludge Conditioning Behavior Evaluation, Ind. Eng. Chem. Res., 2016, 55, 2802–2902 Search PubMed.
- H. L. Zheng, L. Feng, B. Y. Gao, Y. H. Zhou, S. X. Zhan and B. C. Xu, Effect of the Cationic Block Structure on the Characteristics of Sludge Flocs Formed by Charge Neutralization and Patching, Materials, 2017, 10, 478 CrossRef.
- Q. Q. Guan, H. L. Zheng, J. Zhai, C. Zhao, X. K. Zheng, X. M. Tang, W. Chen and Y. J. Sun, Effect of Template on Structure and Properties of Cationic Polyacrylamide: Characterization and Mechanism, Ind. Eng. Chem. Res., 2014, 53, 5624–5635 CrossRef CAS.
- J. Y. Ma, K. Fu, L. Y. Jiang, L. Ding, Q. Q. Guan, S. H. Zhang, H. W. Zhang, J. Shi and X. Fu, Flocculation performance of cationic polyacrylamide with high cationic degree in humic acid synthetic water treatment and effect of kaolin particles, Sep. Purif. Technol., 2017, 181, 201–212 CrossRef CAS.
- H. L. Zheng, Y. J. Sun, J. S. Guo, F. T. Li, W. Fan, Y. Liao and Q. Q. Guan, Characterization and Evaluation of Dewatering Properties of PADB, a Highly Efficient Cationic Flocculant, Ind. Eng. Chem. Res., 2014, 53, 2572–2582 CrossRef CAS.
- B. S. Kaith, R. Jindall and R. Sharma, Study of ionic charge dependent salt resistant swelling behavior and removal of colloidal particles using reduced gum rosin-poly(acrylamide)-based green flocculant, Iran. Polym. J., 2016, 25, 349–362 CrossRef CAS.
- J. Y. Ma, J. Shi, H. C. Ding, G. C. Zhu, K. Fu and X. Fu, Synthesis of cationic polyacrylamide by low-pressure UV initiation for turbidity water flocculation, Chem. Eng. J., 2017, 312, 20–29 CrossRef CAS.
- R. Suresh, R. Prabu, A. Vijayaraj, K. Giribabu, A. Stephen and V. Narayanan, Facile synthesis of cobalt doped hematite nanospheres: Magnetic and their electrochemical sensing properties, Mater. Chem. Phys., 2012, 134, 590–596 CrossRef CAS.
- R. H. Li, H. B. Zhang, X. Q. Hu, W. W. Gan and Q. P. Li, An efficiently sustainable dextran-based flocculant: Synthesis, characterization and flocculation, Chemosphere, 2016, 159, 342–350 CrossRef CAS PubMed.
- G. Muthuraman and S. Sasikala, Removal of turbidity from drinking water using natural coagulants, J. Ind. Eng. Chem., 2014, 20, 1727–1731 CrossRef CAS.
- G. K. Pradhan and K. M. Parida, Fabrication, Growth Mechanism, and Characterization of α-Fe2O3 Nanorods, ACS Appl. Mater. Interfaces, 2011, 3, 317–323 CAS.
- A. Rufus, N. Sreeju and D. Philip, Synthesis of biogenic hematite (a-Fe2O3) nanoparticles for antibacterial and nanofluid applications, RSC Adv., 2016, 6, 94206–94217 RSC.
- J. Y. Ma, K. Fu, X. Fu, Q. Q. Guan, L. Ding, J. Shi, G. C. Zhu, X. X. Zhang, S. H. Zhang and L. Y. Jiang, Flocculation properties and kinetic investigation of polyacrylamide with different cationic monomer content for high turbid water purification, Sep. Purif. Technol., 2017, 182, 134–143 CrossRef CAS.
Footnote |
| † Electronic supplementary information (ESI) available. See DOI: 10.1039/c7ra05151d |
| This journal is © The Royal Society of Chemistry 2017 |


