 Open Access Article
Creative Commons Attribution 3.0 Unported Licence
Influence of Mn dopants on the electrical properties of Pb(In0.5Nb0.5)O3–PbTiO3 ferroelectric single crystals
Huimin Qiaoab,
Chao He*a,
Zujian Wanga,
Dongfang Pang a,
Xiuzhi Lia,
Ying Liua and
Xifa Long
 *a
*a
aKey Laboratory of Optoelectronic Materials Chemistry and Physics, Fujian Institute of Research on the Structure of Matter, Chinese Academy of Sciences, Fujian, Fuzhou 350002, China. E-mail: hechao@fjirsm.ac.cn; lxf@fjirsm.ac.cn
bUniversity of Chinese Academy of Sciences, Beijing, China
First published on 27th June 2017
Abstract
In order to study the influence of Mn doping on the electrical properties of PIN–PT single crystals and develop the materials for high power applications, relaxor-based 0.68Pb(In0.5Nb0.5)O3–0.32Pb(Ti0.92Mn0.08)O3 (Mn-PIN–PT) ferroelectric single crystals with pseudo-cubic symmetry were grown via the conventional flux method. The Mn-PIN–PT crystals have a Curie temperature (TC) of 231 °C and ferroelectric phase transition (TMPB) of 175 °C. Relaxor behavior is identified by the frequency dispersion in dielectric spectra. The piezoelectric coefficient and longitudinal electromechanical coupling factor (k33) are 730 pC N−1 and 80% at room temperature, respectively. The temperature coefficient of k33 is 1.6%, showing good stability up to 180 °C. The ferroelectric properties were measured at different electric fields, showing well-shaped hysteresis loops above 20 kV cm−1. The variation of remnant polarization (Pr), coercive field (EC) and internal bias field (Ei) as a function of temperature was investigated. The Curie temperature and ferroelectric phase transition temperature were decreased and increased, respectively, due to Mn doping, and a typical hard doping effect was confirmed via ferroelectric, dielectric and piezoelectric characterization.
1. Introduction
The binary relaxor-based ferroelectric solid solutions with a formula of (1 − x)Pb(B1,B2)O3–PbTiO3 (B1 = Mg2+, Yb3+, Zn2+, In3+, Sc3+…, B2 = Nb5+, Ta5+…) have drawn much attention in recent years for their outstanding electrical, electromechanical and pyroelectric properties, making them promising candidates for non-destructive testing, wireless communication and medical ultrasonic imaging.1,2 However, the features of low coercive field, low mechanical quality factor (Qm < 100) and inferior thermal stability have restricted their applications in various fields.3,4 In recent years, much attention has been drawn to the modification of relaxor-PT solid solutions by chemical additions, particularly by Fe and Mn substitutions.5,6 As is known to us, the Mn ions often act as acceptor dopants in ferroelectric materials with a perovskite structure, for the variation in valencies from +4 to +2 and +3 at high temperatures.7,8 In this process, oxygen vacancies appear as a result of charge compensation, and then the electrical properties of the crystal are affected. The oxygen vacancies pin the domain walls, and the defect dipoles, i.e. , align with spontaneous polarization in a domain, leading to a hardening effect. Hard ferroelectrics are characterized by low permittivity, low losses, low piezoelectric coefficient and high coercive field.9 There are numerous studies that report the Mn doping effect on relaxor ferroelectrics, such as Mn-doped PMN-PT, PIN–PMN–PT ceramics and single crystals.10–13 It has been reported that doping Mn in relaxor-PT ferroelectrics could improve their electromechanical quality factor, thermal stability and pyroelectricity.5,6,14 For example, the mechanical quality factor of PIN–PMN–PT (∼100) can be improved through modification by Mn-doping to above 1000, which is comparable to that of hard PZT8 ceramics.15
As a member of relaxor ferroelectrics, (1 − x)Pb(In0.5Nb0.5)O3–xPbTiO3 (PIN–PT), with a composition near the morphotropic phase boundary (MPB), shows excellent properties such as high piezoelectric coefficient (d33 > 350 pC N−1 for ceramics, d33 > 1500 pC N−1 for single crystals), high Curie temperature (TC ≥ 250 °C) and large electromechanical coupling properties (kp ≥ 0.7).3,16,17 Compared with bulk ceramics and films, single crystals exhibit a much better piezoelectric coefficient, ferroelectricity and electromechanical properties due to their homogeneity of composition and structure; in other words, crystals reflect the intrinsic state of materials to some extent. For these reasons, the Mn-doped PIN–PT solid solutions in the form of single crystals are supposed to possess excellent electrical properties for high temperature and high power applications. In order to study the effect of Mn dopants on the structure and electrical properties of PIN–PT crystals, single crystals with a composition of 0.61Pb(In0.5Nb0.5)O3–0.39Pb(Ti0.9Mn0.1)O3 were grown and investigated.
2. Experimental
The Mn-doped PIN–PT single crystals were grown by the conventional flux method. The starting chemicals, PbO (99.9%), In2O3 (99.9%), Nb2O5 (99.9%), TiO2 (99.9%), MnO2 (99.9%), were weighed according to the nominal stoichiometric composition of 0.61Pb(In0.5Nb0.5)O3–0.39Pb(Ti0.9Mn0.1)O3. The mixture of PbO and B2O3 (99.9%) was used as flux. The mixture of weighed chemicals was loaded in a platinum crucible and then placed in a vertical tubular furnace. The growing process was similar to the ones described by He et al.18 with the main difference being that the temperature range between crystallizing and growing was from 1000 °C to 925 °C in this study. Finally, the Mn doped PIN–PT crystals were obtained.The actual composition of the grown Mn-doped PIN–PT crystals was examined by inductively coupled plasma atomic emission spectroscopy (ICP-AES, JY Ultima-2, France). The structural analysis and sample orientation were examined by an X-ray diffractometer (Rigaku, Miniflex 600, Japan) at room temperature. Rietveld analyses were performed on the XRD pattern that was collected over the 2θ range 5°–85° with a step of 0.01° and counting time of 2 s per step, using fullprof software. A plate shaped crystal was cut perpendicularly to the [001] direction and finely polished to obtain optical quality with a thickness of about 60 μm, and the sample was annealed at 500 °C to remove the surface stress. The symmetry of the as-grown crystal was determined by a polarized light microscope (PLM, LV100POL, Nikon, Japan) connected to a computer. The [001]-oriented samples were prepared, polished and coated with silver paste, as electrodes for electric measurements. The ferroelectric hysteresis loops were displayed by an aix-ACCTIF2000 analyzer combined with a high-voltage supply amplifier/controller (Trek, model 610E). The piezoelectric coefficient was measured using a quasi-static d33 meter (Institute of Acoustics, Chinese Academy of Sciences, model ZJ-4AN). The dielectric constant (ε′) and loss tangent (tan![[thin space (1/6-em)]](https://www.rsc.org/images/entities/char_2009.gif) δ) were determined by a computer-controlled Alpha-A broad band dielectric/impedance spectrometer (Novocontrol GmbH, Germany). The same setup was employed to measure the resonance frequency (fr) and anti-resonance frequency (fa) as a function of temperature of a bar sample. The longitudinal electromechanical coupling factors (k33) were calculated based on the resonance and anti-resonance frequencies using the following formula:
δ) were determined by a computer-controlled Alpha-A broad band dielectric/impedance spectrometer (Novocontrol GmbH, Germany). The same setup was employed to measure the resonance frequency (fr) and anti-resonance frequency (fa) as a function of temperature of a bar sample. The longitudinal electromechanical coupling factors (k33) were calculated based on the resonance and anti-resonance frequencies using the following formula:
 | (1) |
3. Results and discussion
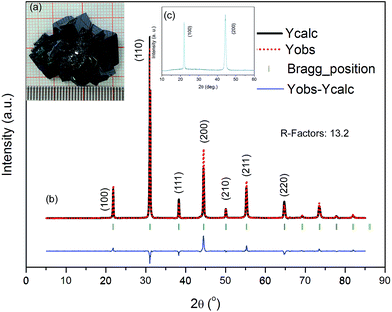
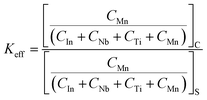
Fig. 1a inset shows the photograph of the Mn-doped PIN–PT crystals with dark color composed of several quadrate crystals, with the dimension of the largest crystal being about 10 mm × 5 mm × 5 mm. The actual chemical composition of the crystal was determined to be 0.68Pb(In0.5Nb0.5)O3–0.32Pb(Ti0.92Mn0.08)O3 (abbreviated as Mn-PIN–PT hereafter) according to the data from ICP measurements. The effective segregation Keff of Mn ions can be determined using the following formula:
 | (2) |
![[3 with combining macron]](https://www.rsc.org/images/entities/char_0033_0304.gif) m space group with a = 4.0713 Å, exhibiting a pseudo-cubic symmetry. The lattice parameters are larger than a = 4.0634 Å of 0.66PIN–0.34PT single crystals in ref. 3 and a = 4.064 of 0.72PIN–0.28PT in ref. 19. The expansion of lattice parameters may be caused by the variation of ionic radii. According to the spectrochemical series, the Mn2+/Mn3+ would adopt a high spin state for the weak crystal field of O2− ligands,20,21 and the ionic radii have been listed in Table 2. Given that the ionic radius of Mn2+ is much larger than that of Ti4+, the substitution of Mn for Ti in the lattice would inevitably lead to the increase of lattice parameters. The theoretical density of as-grown single crystals is 8.383 g cm−3 based on the lattice parameter. The XRD pattern for the facet of a tablet sample, which was cut from the as-grown crystals for electrical measurements, is shown in the Fig. 1c inset. The [001] oriented facet can be confirmed because only (001) and (002) reflection peaks appeared.
m space group with a = 4.0713 Å, exhibiting a pseudo-cubic symmetry. The lattice parameters are larger than a = 4.0634 Å of 0.66PIN–0.34PT single crystals in ref. 3 and a = 4.064 of 0.72PIN–0.28PT in ref. 19. The expansion of lattice parameters may be caused by the variation of ionic radii. According to the spectrochemical series, the Mn2+/Mn3+ would adopt a high spin state for the weak crystal field of O2− ligands,20,21 and the ionic radii have been listed in Table 2. Given that the ionic radius of Mn2+ is much larger than that of Ti4+, the substitution of Mn for Ti in the lattice would inevitably lead to the increase of lattice parameters. The theoretical density of as-grown single crystals is 8.383 g cm−3 based on the lattice parameter. The XRD pattern for the facet of a tablet sample, which was cut from the as-grown crystals for electrical measurements, is shown in the Fig. 1c inset. The [001] oriented facet can be confirmed because only (001) and (002) reflection peaks appeared.
| Ion | Pb | In | Nb | Ti | Mn | ||
|---|---|---|---|---|---|---|---|
| Valence | +2 | +3 | +5 | +4 | +2 | +3 | +4 |
| Coordination | XII | VI | VI | VI | VI | VI | VI |
| Ionic radius (Å) | 1.49 | 0.8 | 0.64 | 0.67 | 0.83 (hs) | 0.645 (hs) | 0.53 |
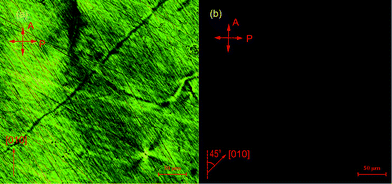
Fig. 2 shows the micrographs of the [001]-oriented crystal under a crossed polarizer at room temperature. The direction of spontaneous polarization, which is the vibration direction of the domain, is along the [111] directions in a rhombohedral/pseudo-cubic perovskite. Viewed under crossed polarizers, the domains appear to be in extinction when their slow and fast vibration directions are along the vibration directions of polarizer (P) and analyzer (A), and the extinction angle θ is defined as the smaller angle between the [100] or [010] crystallographic axis and the polarizer (P) or analyzer (A). In the case of [001]-oriented samples with pseudo-cubic symmetry, the extinction angle is practically 45° without exception, as shown in Fig. 2b. Rotating the sample, the vision would turn bright and reach full brightness at θ = 0°, just as shown in Fig. 2a. Moreover, the field of view is dark at any angle for a cubic structure, thus confirming a pseudo-cubic symmetry.
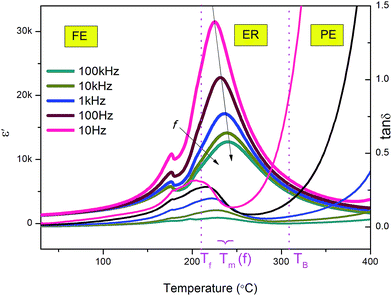
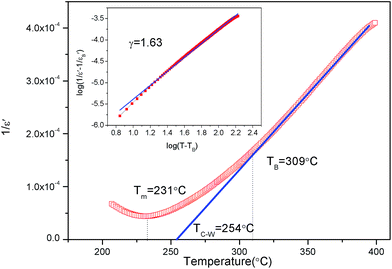
The dielectric constant (ε′) and loss tangent (tan![[thin space (1/6-em)]](https://www.rsc.org/images/entities/char_2009.gif) δ) as a function of temperature at various frequencies for the poled [001]-oriented Mn-PIN–PT single crystal are shown in Fig. 3. The curve of dielectric constant vs. temperature shows a sharp peak at 231 °C (1 kHz), corresponding to the Curie temperature (TC). Moreover, the minor peak at 175 °C corresponds to the temperature of phase transition from pseudo-cubic to tetragonal, represented as TMPB. The dielectric constant and loss tangent at 1 kHz for the sample are 1284 and 0.01 at room temperature, respectively. In addition, it can be seen that Tm (the temperature where ε′ shows a maximum) shifts slightly to a higher temperature as frequency increases, showing frequency dispersion, which is a feature of relaxor behavior. For normal ferroelectrics, the dielectric constant can be fitted by the Curie–Weiss law at a temperature higher than the Curie temperature:
δ) as a function of temperature at various frequencies for the poled [001]-oriented Mn-PIN–PT single crystal are shown in Fig. 3. The curve of dielectric constant vs. temperature shows a sharp peak at 231 °C (1 kHz), corresponding to the Curie temperature (TC). Moreover, the minor peak at 175 °C corresponds to the temperature of phase transition from pseudo-cubic to tetragonal, represented as TMPB. The dielectric constant and loss tangent at 1 kHz for the sample are 1284 and 0.01 at room temperature, respectively. In addition, it can be seen that Tm (the temperature where ε′ shows a maximum) shifts slightly to a higher temperature as frequency increases, showing frequency dispersion, which is a feature of relaxor behavior. For normal ferroelectrics, the dielectric constant can be fitted by the Curie–Weiss law at a temperature higher than the Curie temperature:
 | (3) |
The ferroelectric hysteresis loops of the [001]-oriented Mn-PIN–PT single crystals were measured at various electric fields (f = 10 Hz) at room temperature, and the result is shown in Fig. 5. It is clear that the polarization is saturated above an electric field of 30 kV cm−1, and the remnant polarization Pr and coercive field EC (at the electric field of 30 kV cm−1), at room temperature, are 25 μC cm−2 and 9.7 kV cm−1, respectively. As a result of internal bias field Ei, the hysteresis loops exhibit evident asymmetric features.
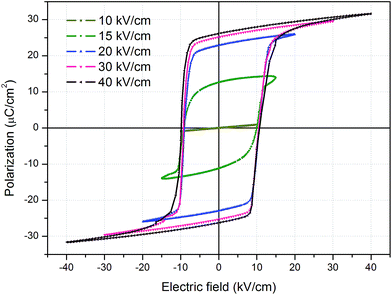 | ||
| Fig. 5 Ferroelectric hysteresis loops for the [001]-oriented Mn-PIN–PT single crystal measured at different electric fields at room temperature (at 10 Hz). | ||
Fig. 6a shows that the ferroelectric hysteresis loops were measured at temperatures varying from room temperature to 285 °C, to investigate the temperature stability of the PIN–PT crystals with Mn doping. The temperature dependence of remnant polarization Pr, coercive field EC and internal bias field Ei were plotted for better analysis, as shown in Fig. 6b. The values of EC and Ei were determined, respectively, using the following formula:
 | (4) |
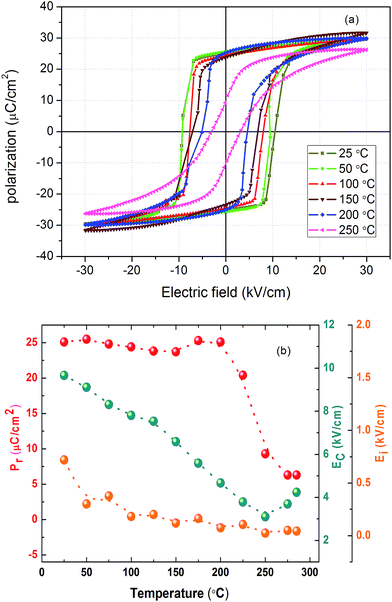 | ||
| Fig. 6 Temperature dependence of (a) ferroelectric hysteresis loops, (b) remnant polarization (Pr), coercive field (EC) and internal bias field (Ei) for the Mn-PIN–PT single crystal (10 Hz). | ||
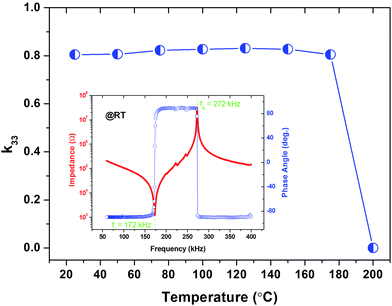
As a result of the hardening effect, the value of the piezoelectric coefficient at room temperature was measured to be 730 pC N−1, which is inferior compared with that of pure PIN–PT single crystals, i.e., the d33 of PIN–PT (65.5/34.5) single crystals grown via the TSSG method is 1600 pC N−1.16 To study the electromechanical coupling properties of the crystal, the resonance (fr) and anti-resonance frequencies (fa) of a bar sample with a size of 2.36 × 3.12 × 6.22 mm3 were measured at room temperature. The frequency dependence of impedance and phase angle are shown in the inset of Fig. 7. Two peaks at 172![[thin space (1/6-em)]](https://www.rsc.org/images/entities/char_2009.gif) 000 and 272
000 and 272![[thin space (1/6-em)]](https://www.rsc.org/images/entities/char_2009.gif) 000 Hz correspond to the resonance frequency (fr) and anti-resonance frequency (fa), respectively, and the electromechanical coupling factor (k33) is calculated to be 80% according to formula (1). The electromechanical coupling factor (k33) of the [001]-oriented Mn-PIN–PT crystal as a function of temperature was investigated and is shown in Fig. 7. It can be seen that the temperature coefficient of k33 is calculated to be 1.6% with a temperature increase to 180 °C, indicating good temperature stability, which is beneficial for application in this temperature range.
000 Hz correspond to the resonance frequency (fr) and anti-resonance frequency (fa), respectively, and the electromechanical coupling factor (k33) is calculated to be 80% according to formula (1). The electromechanical coupling factor (k33) of the [001]-oriented Mn-PIN–PT crystal as a function of temperature was investigated and is shown in Fig. 7. It can be seen that the temperature coefficient of k33 is calculated to be 1.6% with a temperature increase to 180 °C, indicating good temperature stability, which is beneficial for application in this temperature range.
To study the influence of Mn doping on the properties of the PIN–PT single crystals, the parameters of ferroelectric, piezoelectric and dielectric properties for pure and Mn-doped PIN–PT single crystals with similar content of PT are listed in Table 2. For most relaxor-PT solid solutions with compositions located on the same side of the MPB region, the properties vary continuously with the increase in PT content, with certain rules.27,28 Thus, the properties of 0.68PIN–0.32PT single crystals can be estimated through the parameters of samples with similar compositions. It can be seen that when Mn was doped, the Curie temperature of PIN–PT single crystals decreased by about 30 °C; however, the TMPB increased by approximately 50 °C. In order to explain the decrease of TC, the oxygen vacancies should be taken into consideration. It is well known that the substitution of an ion with a lower valence state (Mn2+/Mn3+ for Ti4+ in this case) in the lattice would lead to the appearance of oxygen vacancies for charge compensation. Moreover, the oxygen vacancies introduced by acceptor dopants are intrinsic defects, which cannot be eliminated by annealing.8 Thus, the Curie temperature would decrease because of the stabilization of the cubic phase, which is a consequence of both the presence of oxygen vacancies and the acceptor dopants (Mn2+ and Mn3+), in which the type of electronic ground state is the main factor that essentially matters.8,29 However, it should be noted that in ref. 10, the TMPB of the samples decreases as Mn is doped in, which is in contradiction with the results of this study. The substitution of Mn2+/Mn3+ for Ti4+ in the B site of the perovskite and the presence of oxygen vacancies could reduce the c/a ratio and decrease the tetragonality of the crystals,20,30 thus possibly stabilizing the pseudo-cubic structure and leading to an increment in the temperature of phase transition from pseudo-cubic to tetragonal. The dielectric response and dielectric loss are both suppressed by the defect dipoles through pinning the domain walls, leading to the decrease of dielectric constant and dielectric loss.6,31
The effect of Mn doping on the ferroelectric property is exhibited numerically by the changes of remnant polarization, coercive field and internal bias field. A slight decrease of Pr and increase of EC can be observed in Table 2. This variation is a typical feature of the hardening effect, which is caused by acceptor doping.5 According to the principle of symmetry-conforming short-range order (SC-SRO), the defect dipoles formed between Mn2+/Mn3+ ions and oxygen vacancies produce a defect polarization PD that is in the same direction with spontaneous polarization PS within each domain, leading to an internal bias field that provides a driving force for domain stability and hinders domain wall mobility.32,33 As a result, the stability of the ferroelectric domains is enhanced by the internal bias field, the remnant polarization decreases and the coercive field increases for the Mn-doped PIN–PT single crystals. At the same time, the piezoelectric coefficient decreases at the expense of the increment of the coercive field. At elevated temperatures, the symmetry configuration of defect dipoles will be changed by the migration of oxygen vacancies. When temperature increases, the induced higher thermal fluctuation decreases the activation energy for diffusion of oxygen vacancies and relieves the resistance for domain switching.34,35 As a consequence, the internal bias field Ei decreases significantly with increasing temperature, as shown in Fig. 6.
4. Conclusion
In summary, the binary Mn-PIN–PT ferroelectric single crystals with perovskite structure, exhibiting [001]-oriented natural facets, were grown successfully via the flux method. The characteristics of the structure, dielectric and ferroelectric properties for the [001]-oriented single crystals have been investigated. The Curie temperature and ferroelectric phase transition temperature were detected to be 231 °C and 175 °C, respectively. The dielectric constant and loss tangent at room temperature (1 kHz) are 1284 and 0.01 for a poled [001]-oriented single crystal. At an electric field of 30 kV cm−1, the remnant polarization and coercive field at room temperature are 25 μC cm−2 and 9.7 kV cm−1, respectively. Compared with pure PIN–PT single crystals, the Mn-doped samples possess a higher Curie temperature and lower TMPB as a consequence of internal bias field and reduction of tetragonality. The piezoelectric coefficient (d33) and longitudinal electromechanical coupling factor (k33) are 730 pC N−1 and 80% at room temperature, respectively. Particularly, the temperature dependence of k33 exhibits good stability with the temperature coefficient of 1.6% below 180 °C. The defect polarization PD was formed between Mn and oxygen vacancies, exhibiting an internal bias field. Then, the hardening effect is formed because of the internal bias field, which can pin the domain walls and provide a driving force for domain stability. Therefore, the coercive field increases, and the remnant polarization, piezoelectric coefficient, dielectric constant and dielectric loss decrease for the hardening effect of the acceptor dopants.Acknowledgements
This study was supported by the National Natural Science Foundation of China (Grant No. 11404331, 91422303, 11504373, 51602308), the Strategic Priority Research Program of the Chinese Academy of Sciences (Grant No. XDB20000000) and “Chunmiao” Talents Program for Young Scientists of Haixi Institute of the Chinese Academy of Sciences (CMZX-2016-006).References
- M. Kobayashi, C. K. Jen, J. F. Bussiere and K. T. Wu, NDT&E Int., 2009, 42, 157–161 CrossRef CAS
.
- I. El-Kady, R. H. Olsson and J. G. Fleming, Appl. Phys. Lett., 2008, 92, 3 CrossRef
.
- Z. Q. Duan, G. S. Xu, X. F. Wang, D. F. Yang, X. M. Pan and P. C. Wang, Solid State Commun., 2005, 134, 559–563 CrossRef CAS
.
- Y. P. Guo, H. S. Luo, T. H. He, X. M. Pan and Z. W. Yin, Mater. Res. Bull., 2003, 38, 857–864 CrossRef CAS
.
- E. W. Sun and W. W. Cao, Prog. Mater. Sci., 2014, 65, 124–210 CrossRef CAS PubMed
.
- Y. Tang, L. Luo, Y. Jia, H. Luo, X. Zhao, H. Xu, D. Lin, J. Sun, X. Meng and J. Zhu, Appl. Phys. Lett., 2006, 89, 162906 CrossRef
.
- L. X. He and C. E. Li, J. Mater. Sci., 2000, 35, 2477–2480 CrossRef CAS
.
- P. Hansen, D. Hennings and H. Schreinemacher, J. Electroceram., 1998, 2, 85–94 CrossRef CAS
.
- J. F. Tressler, S. Alkoy and R. E. Newnham, J. Electroceram., 1998, 2, 257–272 CrossRef CAS
.
- Z. Ren and Z. G. Ye, Ferroelectrics, 2014, 464, 130–135 CrossRef CAS
.
- L. H. Luo, D. Zhou, Y. X. Tang, Y. M. Jia, H. Q. Xu and H. S. Luo, Appl. Phys. Lett., 2007, 90, 3 Search PubMed
.
- J. H. Park, J. Park, J. G. Park, B. K. Kim and Y. Kim, J. Eur. Ceram. Soc., 2001, 21, 1383–1386 CrossRef CAS
.
- X. Q. Huo, S. J. Zhang, G. Liu, R. Zhang, J. Luo, R. Sahul, W. W. Cao and T. R. Shrout, J. Appl. Phys., 2012, 112, 5 CrossRef
.
- Y. Wang, E. Sun, W. Song, W. Li, R. Zhang and W. Cao, J. Alloys Compd., 2014, 601, 154–157 CrossRef CAS
.
- L. M. Zheng, R. Sahul, S. J. Zhang, W. H. Jiang, S. Y. Li and W. W. Cao, J. Appl. Phys., 2013, 114, 6 Search PubMed
.
- C. He, X. Z. Li, Z. J. Wang, Y. Liu, D. Q. Shen, T. Li and X. F. Long, J. Alloys Compd., 2012, 539, 17–20 CrossRef CAS
.
- A. Kirianov, N. Ozaki, H. Ohsato, N. Kohzu and H. Kishi, Jpn. J. Appl. Phys., Part 1, 2001, 40, 5619–5623 CrossRef CAS
.
- C. He, X. Z. Li, Z. J. Wang, Y. Liu, D. Q. Shen, T. Li, X. F. Long and Z. G. Ye, CrystEngComm, 2012, 14, 4407–4413 RSC
.
- N. Yasuda, H. Ohwa, M. Kume, K. Hayashi, Y. Hosono and Y. Yamashita, J. Cryst. Growth, 2001, 229, 299–304 CrossRef CAS
.
- Y. D. Hou, M. K. Zhu, F. Gao, H. Wang, B. Wang, H. Yan and C. S. Tian, J. Am. Ceram. Soc., 2004, 87, 847–850 CrossRef CAS
.
- S. T. K. Toshio, T. Takaaki and D. Masaki, Jpn. J. Appl. Phys., 1992, 31, 3 CrossRef
.
- D. Viehland, S. J. Jang, L. E. Cross and M. Wuttig, Phys. Rev. B: Condens. Matter Mater. Phys., 1992, 46, 8003–8006 CrossRef
.
- T. Li and X. F. Long, Mater. Res. Bull., 2014, 51, 251–257 CrossRef CAS
.
- R. A. Cowley, S. N. Gvasaliya, S. G. Lushnikov, B. Roessli and G. M. Rotaru, Adv. Phys., 2011, 60, 229–327 CrossRef CAS
.
- Z. Li, Z. Xi, Z. Xu and X. Yao, J. Mater. Sci. Lett., 2002, 21, 1325–1327 CrossRef CAS
.
- L. E. Cross, Ferroelectrics, 1987, 76, 241–267 CrossRef CAS
.
- X. F. Long and Z. G. Ye, Chem. Mater., 2007, 19, 1285–1289 CrossRef CAS
.
- S. Wongsaenmai, X. L. Tan, S. Ananta and R. Yimnirun, J. Alloys Compd., 2008, 454, 331–339 CrossRef CAS
.
- H. J. Hagemann and H. Ihrig, Phys. Rev. B: Condens. Matter Mater. Phys., 1979, 20, 3871–3878 CrossRef CAS
.
- H. Qiao, C. He, Z. Wang, X. Li, Y. Liu, X. Yang, H. Tailor and X. Long, Mater. Des., 2017, 117, 232–238 CrossRef CAS
.
- E. W. Sun, R. Zhang, F. M. Wu, B. Yang and W. W. Cao, J. Appl. Phys., 2013, 113, 4 Search PubMed
.
- X. B. Ren, Nat. Mater., 2004, 3, 91–94 CrossRef CAS PubMed
.
- L. X. Zhang and X. B. Ren, Phys. Rev. B: Condens. Matter Mater. Phys., 2006, 73, 6 Search PubMed
.
- G. S. Xu, H. S. Luo, H. Q. Xu, Z. Y. Qi, P. C. Wang, W. H. Zhong and Z. W. Yin, J. Cryst. Growth, 2001, 222, 202–208 CrossRef CAS
.
- G. Du, R. H. Liang, L. Wang, K. Li, W. B. Zhang, G. S. Wang and X. L. Dong, Appl. Phys. Lett., 2013, 102, 4 Search PubMed
.
- Database of Ionic Radii, http://abulafia.mt.ic.ac.uk/shannon/ptable.php.
| This journal is © The Royal Society of Chemistry 2017 |

