 Open Access Article
Magnetic properties of composites based on the intercalation of ZnII and CuII bimetallic macrocyclic complexes in the MnPS3 phase†
P. Fuentealbaab,
V. Paredes-Garciabc,
D. Venegas-Yazigi bd,
I. D. A. Silvae,
C. J. Magon*e,
R. Costa de Santanaf,
N. Audebrand
 g,
J. Manzurh and
E. Spodine
 *ab
*ab
aFacultad de Ciencias Químicas y Farmacéuticas, Universidad de Chile, Santiago, Chile. E-mail: espodine@uchile.cl
bCEDENNA, Santiago, Chile
cDepartamento de Ciencias Químicas, Universidad Andrés Bello, Santiago, Chile
dFacultad de Química y Biología, Universidad de Santiago de Chile, Santiago, Chile
eInstituto de Física de São Carlos, Universidade de São Paulo, 13560-970 São Carlos, SP CP 369, Brazil. E-mail: magon@ifsc.usp.br
fInstituto de Física, Universidade Federal de Goiás, Av. Esperança, Campus Samambaia, Goiânia, GO 74690-900, Brazil
gUniversité de Rennes 1, Institut des Sciences Chimiques de Rennes-UMR 6226, Rennes, France
hFacultad de Ciencias Físicas y Matemáticas, Universidad de Chile, Santiago, Chile
First published on 30th June 2017
Abstract
Asymmetric macrocyclic complexes of the type [M2LCl2]·xH2O have been obtained and intercalated using the potassium precursor phase K0.4Mn0.8PS3·H2O (M: ZnII or CuII; LH2: macrocyclic ligand derived from 2-hydroxy-5-methyl-1,3-benzenedicarbaldehyde and two different amines, namely, ethylenediamine and o-phenylenediamine). The intercalation of the layered phase K0.4Mn0.8PS3·H2O by the macrocyclic species was carried out by a microwave-assisted reaction and enabled the partial exchange of the hydrated potassium ions located in the interlayer space to obtain the composites K0.32[Zn2L]0.04Mn0.8PS3 (1) and K0.24[Cu2L]0.08Mn0.8PS3 (2). These magnetic materials were studied by DC and AC magnetization measurements and electron paramagnetic resonance (EPR) spectroscopy. In comparison with the potassium precursor, both composites gave rise to broader and less intense spontaneous magnetization curves at low temperatures. The composite K0.32[Zn2L]0.04Mn0.8PS3 (1) exhibited spontaneous magnetization in the form of one broad asymmetric maximum at 27 K. However, K0.24[Cu2L]0.08Mn0.8PS3 (2) had two defined maxima at 24 and 12 K. The observation of a maximum in the imaginary part of the AC susceptibility data implies the existence of a spin canting phenomenon that would be responsible for the spontaneous magnetization. The EPR results are qualitatively consistent with the magnetization data and reveal that exchange narrowing effects were responsible for the narrowing and broadening of the line shapes.
1. Introduction
The synthesis and applications of layered compounds are the aims of many research groups involved in inorganic chemistry, materials science, and coordination chemistry. This is due to their many interesting properties, which can be modified by intercalation reactions. Thus, the magnetic properties of intercalated layered compounds have received the attention of researchers for a long time.1–6 Many layered compounds can be intercalated,2,7–9 but among these one of the most interesting phases for studying magnetic properties is the antiferromagnetic MnPS3 phase, owing to the unusual magnetic behaviour observed after intercalation.3,10 In 1980 Clement et al. reported a dramatic modification of the magnetic behaviour of an intercalated thiophosphate phase, which exhibited weak ferromagnetism at lower temperatures in the final composites.10 This fact motivated many researchers to start working in this field and to intercalate different organic and inorganic compounds with the aim of studying the magnetic and other physical properties of the final composites.3,11–15 Many synthetic pathways have been developed for intercalating different species.1,7,16–20 One of the most widely used is ionic exchange, in which the guest is a cation such as potassium, lithium, tetramethylammonium, or the 4-[2-(4-dimethylaminophenyl)ethenyl]-1-methylpyridinium cation (DAMS+), among others. In this process, the charge of the guest is balanced by the partial removal of manganese(II) ions from the lamellar host,19 which gives rise to different composites of the formula MI2xMn(1−x)PS3. This procedure enables the preparation of useful precursors such as K0.4Mn0.8PS3·H2O, which is a well-known phase used for further intercalation reactions of bulky guests such as macrocyclic complexes.3,7,9,15,21 In addition, the K0.4Mn0.8PS3·H2O phase exhibits spontaneous magnetization, which has been explained by ordered vacancies present along the lamellae.22,23 It is due to this interesting magnetic phenomenon and the lability of the interlamellar potassium ions that the K0.4Mn0.8PS3·H2O phase has been widely studied and is still being utilized to obtain new composites.In this paper, the magnetic properties of composites obtained by the intercalation of a ZnII or CuII macrocyclic complex using the potassium precursor will be discussed. The partial exchange of the interlamellar hydrated potassium ions present in K0.4Mn0.8PS3·H2O for the cationic ZnII and CuII macrocyclic complexes was achieved by a microwave-assisted reaction.
2. Experimental
Characterization
Analyses of copper and zinc in the macrocyclic complexes were carried out with a PerkinElmer AAnalyst 700 spectrometer using an acetylene/air flame. Analyses of C, N, and H were performed using a Thermo Fisher Flash 2000 elemental analyzer. FT-IR spectra were recorded using KBr pellets with a Bruker Vector 22 spectrometer. Magnetic properties were studied by DC and AC measurements obtained with a Quantum Design SQUID magnetometer with a SQUID detector (MPMS XL7). AC measurements were carried out at frequencies of 10 Hz and 1000 Hz. CW-EPR experiments were carried out with a Bruker Elexsys E-580 spectrometer operating in the X-band at around 9.5 GHz. The temperature was controlled by an ESR-900 continuous-flow liquid helium cryostat and an Oxford Instruments ITC 503 PID controller.Powder X-ray diffraction was performed at room temperature using a Bruker D8 Advance diffractometer with Cu Kα1 radiation in the range of 5° < 2θ < 60°. Extraction of the peak positions was carried out with WinPLOTR24 software in the FullProf suite package. Pattern indexing and refinement of the unit cell parameters were performed with the DICVOL06 program.25 Integrated intensities were extracted with the Le Bail iterative pattern decomposition algorithm available in FullProf; two lines of very low intensity (at 2θ = ca. 28.7° and 30.1°) were not indexed. The origin of these lines is not evident, as they were observed even for the pristine phase.
Scanning electron microscopy (SEM) was performed using a Jeol scanning microscope (JSM-5410) with an Oxford Link Isis energy-dispersive X-ray detector (EDXS). This technique did not show any chloride ions in the intercalated samples (the data that were obtained are shown in Table S1, Fig. S1 and S2†).
Syntheses
All the solvents were distilled before use; amines and inorganic salts were used as received from Sigma-Aldrich. Pure elements were used to synthesize the host MnPS3 phase using the ceramic method reported in the literature.26 The potassium precursor was synthesized as reported by Clement et al.19 The macrocyclic complexes were intercalated by a microwave-assisted reaction (12 min, 800 W), as described by Spodine et al.3 Milestone microwave synthesis equipment (LAVIS 1000 Multi-Quant) with a frequency of 2.459 GHz was used for the exchange reactions.2-Hydroxy-5-methyl-1,3-benzenedicarbaldehyde
The dicarbaldehyde, which was used to prepare all the macrocyclic complexes, was synthesized by the oxidation of 2,6-bis(hydroxymethyl)-p-cresol using the procedure described by Papadopoulos et al.27 The product was characterized by FTIR spectroscopy and on comparison with the commercial product displayed the same pattern (KBr pellets): 3028–2924 cm−1 (νC–H, aromatic ring), 2872 cm−1 (νC–H, aldehyde), 1681, 1666 cm−1 (νC![[double bond, length as m-dash]](https://www.rsc.org/images/entities/char_e001.gif) O, aldehyde). Anal. calc.% (C9H8O3): C, 65.85; H, 4.91. Found: C, 64.5; H, 5.1.
O, aldehyde). Anal. calc.% (C9H8O3): C, 65.85; H, 4.91. Found: C, 64.5; H, 5.1.
Homodinuclear asymmetric complexes
![[double bond, length as m-dash]](https://www.rsc.org/images/entities/char_e001.gif) O, aldehyde), 1640 cm−1 (νC
O, aldehyde), 1640 cm−1 (νC![[double bond, length as m-dash]](https://www.rsc.org/images/entities/char_e001.gif) N, Schiff base), and 1565 cm−1 (νC
N, Schiff base), and 1565 cm−1 (νC![[double bond, length as m-dash]](https://www.rsc.org/images/entities/char_e001.gif) C, aromatic ring). Anal. calc.% (C20H20N2O4): C, 68.17; H, 5.72; N, 7.95. Found for (I): C, 67.8; H, 6.2; N, 7.9.
C, aromatic ring). Anal. calc.% (C20H20N2O4): C, 68.17; H, 5.72; N, 7.95. Found for (I): C, 67.8; H, 6.2; N, 7.9.Syntheses of [2 + 1 + 1] macrocyclic complexes
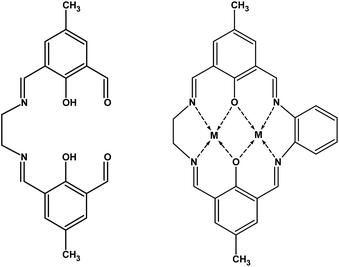
Two homometallic asymmetric macrocyclic species containing ZnII and CuII were obtained via a stepwise reaction by a procedure similar to that reported by Sreedaran et al.28,29 The synthesis procedure can be summarized as follows: in order to deprotonate the ligand, triethylamine (80 μL) was added to 0.273 mmol I (96 mg) suspended in 2-propanol. A solution of a metallic salt (0.545 mmol, i.e., 75 mg ZnCl2 or 93 mg CuCl2·2H2O) in 10 mL 2-propanol was added dropwise, and the mixture was reacted for one hour. Finally, o-phenylenediamine (0.273 mmol, 30 mg) was added, and the reaction mixture was stirred at room temperature for 24 hours. The solid was filtered off, washed with 2-propanol and methanol, and dried under vacuum (Scheme 1).The FTIR spectra (KBr pellets) of the ZnII and CuII macrocyclic complexes that were obtained display three main vibration bands: at 3030–2850 cm−1 (νC–H, aromatic ring and aliphatic chain from the amine), 1640 cm−1 (νC![[double bond, length as m-dash]](https://www.rsc.org/images/entities/char_e001.gif) N, Schiff base), and 1565 cm−1 (νC
N, Schiff base), and 1565 cm−1 (νC![[double bond, length as m-dash]](https://www.rsc.org/images/entities/char_e001.gif) C, aromatic ring). A band typical of ortho substitution of the aromatic ring is also observed at 760 cm−1.
C, aromatic ring). A band typical of ortho substitution of the aromatic ring is also observed at 760 cm−1.
Synthesis of the pristine MnPS3 phase and the potassium precursor K0.4Mn0.8PS3·H2O
The pure MnPS3 phase was synthesized using the ceramic method, as described in the literature.26 High-purity elements (Mn, P, and S) were mixed in a molar ratio of 1![[thin space (1/6-em)]](https://www.rsc.org/images/entities/char_2009.gif) :
:![[thin space (1/6-em)]](https://www.rsc.org/images/entities/char_2009.gif) 1
1![[thin space (1/6-em)]](https://www.rsc.org/images/entities/char_2009.gif) :
:![[thin space (1/6-em)]](https://www.rsc.org/images/entities/char_2009.gif) 3 and reacted in a quartz tube in an argon atmosphere at 750 °C for seven days. Then, the reactor was slowly cooled down, and a green polycrystalline phase of MnII was obtained. The purity of the phase that was obtained was confirmed by SEM-EDX and powder X-ray diffraction.
3 and reacted in a quartz tube in an argon atmosphere at 750 °C for seven days. Then, the reactor was slowly cooled down, and a green polycrystalline phase of MnII was obtained. The purity of the phase that was obtained was confirmed by SEM-EDX and powder X-ray diffraction.
The potassium precursor was synthesized by stirring a suspension of the solid MnPS3 phase with a 2 M aqueous solution of KCl for 24 h at room temperature.19 The light green potassium precursor that was obtained was characterized by SEM-EDX, which confirmed a stoichiometry of K0.4Mn0.8PS3·H2O.
Microwave-assisted exchange reaction of the interlamellar potassium ions with the macrocyclic complexes
The potassium precursor K0.4Mn0.8PS3·H2O (150 mg) was suspended in 15 mL methanol, which contained 0.16 mmol of the corresponding macrocyclic complex, and irradiated with microwave radiation (800 W) for 12 minutes. The solid was filtered and washed with ethanol followed by DMF until the solvent appeared colorless.The exchange reaction was partial and enabled the preparation of the following composites: K0.32[Zn2L]0.04Mn0.8PS3 (1) and K0.24[Cu2L]0.08Mn0.8PS3 (2), of which the stoichiometry was determined by SEM-EDX analyses and atomic absorption.
3. Results and discussion
Synthesis and structure
To calculate the stoichiometry of the complexes, the first coordination sphere of the copper(II) and zinc(II) centers was assumed to be pentacoordinate, as reported in the literature for similar complexes, of which the geometry was determined by single-crystal X-ray diffraction.30–36 The known structures show that the chloride ions occupy axial positions with each one bound to one metal center in a trans conformation. In addition, the copper(II) complex was shown by TGA to be a dihydrate, whereas the zinc(II) complex is anhydrous. Hence, both metal centers have a similar first coordination sphere, which is formed by a square base defined by the N2O2 donor atoms of the ligand, and the axial positions are occupied by the chloride anions.In this work, intercalation was carried out by a microwave-assisted reaction in order to reduce the reaction time to a few minutes, as previously described.3 Thus, the macrocyclic complexes were intercalated in the form of cationic species, and the axial positions of the metal centers became free and available for possible interactions with protruding sulfur atoms in the layers of the host. The intercalation of these complex species in the interlamellar space produces composites with different properties in comparison with those of the precursor K0.4Mn0.8PS3·H2O.3,7,15
The precursors and composites were characterized by FTIR spectroscopy. The pristine MnPS3 phase displays only one vibration band at 570 cm−1, which is attributed to PS3 groups, and a weak band at 450 cm−1 due to P–P bonds.16 In the spectrum of the K0.4Mn0.8PS3·H2O phase the vibration due to PS3 groups is split into two bands at 580 and 560 cm−1 owing to vacancies that were created, which modified the environment of some of the PS3 groups. A band at 450 cm−1 is present in all the recorded spectra, which provides evidence of P–P bonds and therefore the existence of the lamellar structure. In the spectra of the final composites (1) and (2) a common pattern is observed: bands from 1800 to 1000 cm−1 due to the guest and bands from 600 to 400 cm−1 due to the host (Fig. S3†). The continued splitting of the vibration corresponding to the PS3 groups implies the existence of vacancies in the layers, which were generated when the potassium precursor was prepared.
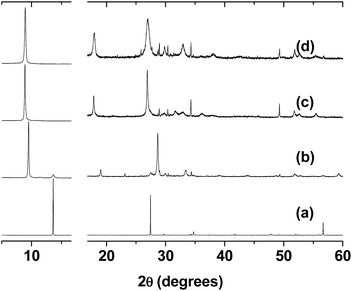
The powder diffractograms of the phases that were studied are shown in Fig. 1, and the unit cell parameters used to index them are listed in Table 1. As reported in the literature, the pristine phase has a monoclinic C2/m unit cell,37 in which the value of the β angle of 107° is far from the expected value of 90°. This deviation can be assumed to be due to the repulsion of the protruding sulphur atoms in adjacent layers. After the intercalation of the potassium ions, an increase was observed in the c parameter.38 The c-axis is related to the stacking of the layers, and this increase has been explained by the presence of hydrated potassium ions in the interlamellar space.23 To index the patterns of K0.32[Zn2L]0.04Mn0.8PS3 (1) and K0.24[Cu2L]0.08Mn0.8PS3 (2) (Fig. S4 and S5†), a monoclinic unit cell with the same symmetry as that of the pristine phase (C2/m) was used.
A new increase in the c parameter from 9.64 to ca. 10.44 and 10.45 Å for (1) and (2), respectively, was observed in the final composites, which was now due to the insertion of the guest molecules.
The interlamellar spacing in the composites was determined to be ca. 10 Å. Because the macrocyclic species have a length of ca. 14 Å and a width of 10–13 Å, depending on the lateral amines, it is possible to assume that the macrocyclic species in the final composites are parallel to the layers.7 In conclusion, there will be an interaction between the free axial positions of the metal centers in the complex and the protruding sulphur atoms in the layers, as shown in Scheme 2. Because the distance between the metal centers in the macrocyclic complexes is ca. 3 Å and the distance between the sulfur atoms in the host is 3.4–3.5 Å, it is possible to assume that one metal center should interact with a sulphur atom in one lamella and the second center with a sulphur atom in an adjacent lamella to recover their initial pentacoordination.
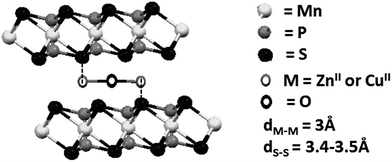 | ||
| Scheme 2 Proposed interaction between the metal centers of the macrocyclic guest and the sulfur atoms of the lamellar host. | ||
Magnetic properties of the lamellar phases
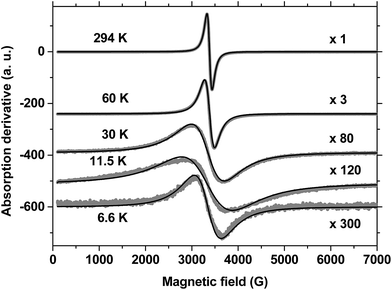
The EPR spectra of MnPS3 were recorded in the range of 4–300 K, and some selected spectra are shown in Fig. 2. From these data, two prominent features can be observed. Firstly, at all temperatures the EPR spectra can be well fitted to a single Lorentzian line with an isotropic g-factor, as shown in Fig. 2. Secondly, as the temperature decreases the spectrum of the pristine phase decreases in intensity, accompanied by increased broadening. At all temperatures a single line is observed, in accordance with the fact that in the case of the pristine MnPS3 phase all MnII ions are structurally and magnetically equivalent.
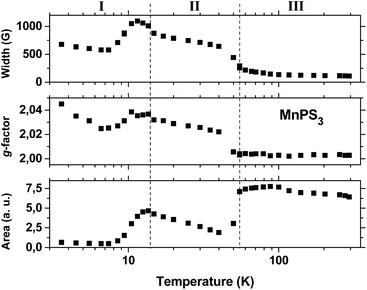
Fig. 3 shows plots of the line shape parameters as a function of temperature. The parameters (line width, g-factor and area) were determined directly from the Lorentzian fit of the experimental spectra. This implies that the paramagnetic center can be described as having a spin of S = 1/2 with an isotropic Zeeman interaction. By analyzing the behaviour of the data, the entire temperature range can be divided into three regions. Below 15 K (region I) complex behaviour is observed, which is characterized by the largest line widths and g-factors and the lowest line intensities. All three parameters reach a maximum around 12 K in the same region where a transition was observed in the susceptibility data (Fig. S6†). At temperatures below this level, the line width remains roughly constant but the line intensity decreases to values close to zero, whereas the g-factor exhibits a slight increase. We regard this behaviour to be a consequence of the increase in magnetic order accompanied by the slowing down of spin fluctuations that takes place at low temperatures below 12 K. However, owing to the complexity of the behaviour that was observed, we have not reached a better understanding of this matter.
Above 15 K (in region II) all three parameters remain almost insensitive to temperature until a second, broad transition, which is centered at 78 K, is approached. The line width data (top plot in Fig. 3) display the typical behaviour that is expected for an exchange narrowing process. As the temperature increases in region II, the line width stays almost constant until an increase in spin fluctuations causes an abrupt narrowing of the spectra at around 55 K. Then, upon an increase in temperature in region III, the line width gradually approaches its smallest observed value of 110 G at 300 K.
However, the apparent small decrease in line intensity with an increase in temperature in region III does not exhibit Curie–Weiss behaviour, as is observed for the static susceptibility data in Fig. S6.† The intensity of the EPR signal should depend strongly on the temperature because of the Boltzmann population of spin states; the higher is the temperature, the lower is the intensity for a normal doublet state of a paramagnetic center. We believe that the dynamic behaviour of the spin, which is not detected by static measurements, may cause such an anomalous dependence of the line intensity on the temperature in the paramagnetic region. Because the spins are exchange-coupled, different spin manifolds in the fine structure may display different temperature dependences. Owing to the narrowing process, it is most probable that the Lorentzian signal that was observed arises predominantly from components with values of Ms = ±1/2, which give rise to a partial contribution that does not reflect the entire spin population.
The transition from region II to region III has a strong effect on the value of the g-factor. The gyromagnetic factor undergoes an abrupt decrease from 2.022 at 40 K to 2.0056 at 50 K and then decreases gradually to 2.0028 at 300 K, which is close to the value for a free electron. Furthermore, another puzzling effect is related to the line intensity. The line intensity does not remain constant at the transition from region II to region III; instead, the line intensity exhibits an abrupt and significant increase at 55 K with the increase in temperature. The simplest explanation of this fact is based on the motional narrowing process. At temperatures below 55 K a significant portion of the resonance band may be too broad to be observed, as it is probably hidden by the spectrum baseline. With an increase in temperature, broadening interactions may be partially averaged by spin fluctuation processes and narrowing becomes more effective, which brings part of those hidden features toward the center of the spectrum and leads to a consequent increase in line intensity.
On the basis of this scenario, it is possible to infer that the single isotropic line observed in the EPR spectra of pristine MnPS3 is due to MnII ions coupled by exchange interactions in the exchange narrowing regime. In this case, exchange interactions are responsible for the absence of fine structure and hyperfine splitting in the recorded spectra at all temperatures.
Two models have been proposed to explain this magnetic behaviour at low temperatures. The first is based on uncompensated antiferromagnetism due to the presence of the created vacancies, whereby near one vacancy three MnII ions have the same orientation, and the second assumes spin canting due to Dzyaloshinsky–Moriya interactions.22,44
Fig. S9† shows the AC susceptibility results for the K0.4Mn0.8PS3·H2O phase. These data should be compared with those obtained for the pristine phase (Fig. S7†). Whereas no peaks were observed for MnPS3, in contrast the AC data for the potassium precursor indicate the onset of a magnetic phase transition at low temperatures, because a peak at ca. 16 K is observed for both the in-phase and out-of-phase components of the susceptibility. The fact that the in-phase and out-of-phase susceptibility data exhibit maxima at similar temperatures is evidence of spin canting effects.
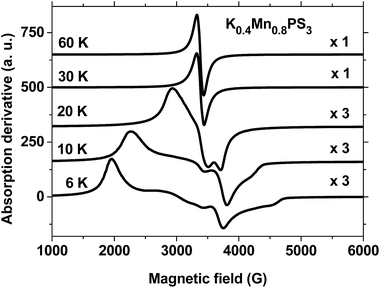
Fig. 4 shows the EPR spectra of the K0.4Mn0.8PS3·H2O phase recorded at temperatures of 6 K, 10 K, 20 K, 30 K and 60 K in the range of 1 kG to 6 kG. The data display completely different behaviour at low and high temperatures, as can be observed in the plots. The temperature spectra above 20 K are characterized by sharp Lorentzian lines with a value of g ≈ 2, in a similar way to those observed for the pristine phase (Fig. 2). Below 30 K the spectra acquire a broad and structured shape and exhibit intensities at completely different effective values of g. Besides, an increase in temperature leads to a gradual and monotonic narrowing of the spectral features towards the high-temperature Lorentzian shape limit. It is also important to note that there is no evidence of nuclear hyperfine splitting of manganese in the spectra shown in Fig. 4. The observed narrowing of the spectra indicates that exchange effects are active over the entire temperature range and are able to collapse the spectra into a single line above 20 K. Therefore, the overall behaviour of the EPR spectra of K0.4Mn0.8PS3·H2O is consistent with its magnetization data (Fig. S8†), because the narrowing of the spectra coincides with the observed transition temperatures of 16 K and 50 K. When thermal energy overcomes the ferromagnetic interactions that produce the transition at 16 K, the spins can fluctuate more easily, which causes the narrowing of the spectra. Besides, the proximity of the second phase transition observed in the range of 50–60 K can also contribute to the promotion of the narrowing process. The fact that such structured spectra were not observed for the pristine phase (Fig. 2) can be ascribed to the above mentioned formation of vacancies in the structure of K0.4Mn0.8PS3·H2O. The average number of magnetic nearest neighbors of some MnII ions decreases as vacancies are created, which favors the formation of MnII sites with differences in magnetic coordination and environment. Moreover, magnetically isolated MnII sites and small MnII clusters are not expected to exist in this composite.45
Owing to the presence of structurally organized vacancies, each manganese ion in K0.4Mn0.8PS3·H2O must be coordinated to two or three nearest-neighbor manganese ions. Therefore, it is expected that all spins can be strongly coupled by dipolar and exchange interactions to form an extended two-dimensional lattice. Under such conditions, a quantitative estimation of resonances is difficult to accomplish, in particular when exchange narrowing processes are considered. It is important to remark that, as far as we know, there is no available software or practical mathematical tool capable of computing EPR spectra in the exchange narrowing (or slow-motion) regime in a case when S > 1/2. Looking toward future work, we are deeply involved in the development of new software tools to improve our knowledge of the present EPR problem.
Composites based on the macrocyclic complexes
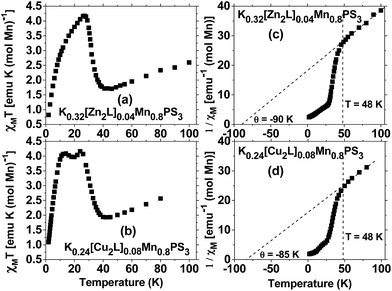
In relation to the magnetic properties of composites based on the intercalation of the MnPS3 phase with different molecules, in the literature are reported composites with organic guests46,47 and mononuclear MII (NiII)48 or MIII (MnIII, FeIII, CoIII) complexes.15,49 In 2011, the magnetic properties of composites with an intercalated dinuclear symmetric macrocyclic ZnII species were reported.3 In some of the reported composites, spontaneous magnetization was observed below 40 K. However, owing to the different preparation methods, the final composites had different MnII concentrations, which corresponded to the lamellar host. This determined that the composites displayed different magnetic behaviour and even exhibited paramagnetism in the case of [Co(salen)]0.07Mn0.65PS3·H2O owing to the substantial dilution of the MnII ions present in the layers.49Fig. 5 shows the DC susceptibility data for the composites based on the macrocyclic ZnII and CuII complexes. Above 48 K the susceptibility curve displays Curie–Weiss behaviour in both cases (plots (c) and (d)). The Curie constant C can be derived from a high-temperature plot of 1/χM vs. T, which results in values of C = 4.93 and 5.31 emu K mol−1, which give effective magnetic moments of 6.30 μB and 6.52 μB, respectively. The pristine MnPS3 phase exhibits bulk antiferromagnetic behaviour, which is evidenced by a Θ value of −250 K, whereas the potassium precursor K0.4Mn0.8PS3·H2O exhibits weakened bulk antiferromagnetism, with a Θ value of −100 K. The composites K0.32[Zn2L]0.04Mn0.8PS3 (1) and K0.24[Cu2L]0.08Mn0.8PS3 (2) retain the weakened bulk antiferromagnetism, with Θ values of −90 and −85 K, respectively (Fig. 5). The last two values are within the range of that of the potassium precursor. Moreover, these reduced values, together with that of the potassium precursor, are indicative of the existence of vacancies in the layers of the composites, which weaken the antiferromagnetism observed in the pristine phase.
The spontaneous magnetization observed in the ZnII and CuII composites exhibits different behaviour depending on the nature of the metal centers in the intercalated macrocyclic complexes (Fig. 5). For K0.32[Zn2L]0.04Mn0.8PS3 the spontaneous magnetization is less intense in comparison with that of the potassium precursor, and the maximum χMT value is shifted from 16 K to a higher temperature of 27 K; besides, the observed peak has an asymmetric form. On the other hand, the χMT curve for K0.24[Cu2L]0.08Mn0.8PS3 displays two well-defined peaks at 24 and 12 K.
The fact that the ZnII composite exhibits one asymmetric maximum in the χMT plot, whereas the CuII composite displays two well-defined maxima, implies that there are two ordering temperatures in the composites. These observed phenomena may be related to the presence of two diamagnetic species in the ZnII composite, namely, potassium ions and the macrocyclic ZnII complex, whereas both diamagnetic potassium ions and ions of the antiferromagnetically coupled macrocyclic CuII complex coexist in the CuII composite. Thus, the CuII ions can be considered to be paramagnetic species that interact via the axial positions with the protruding sulphur atoms in the layers, which shifts the second maximum to slightly lower temperatures in comparison with the asymmetric maximum for the ZnII composite and thus generates two ordering phenomena at 12 and 24 K.
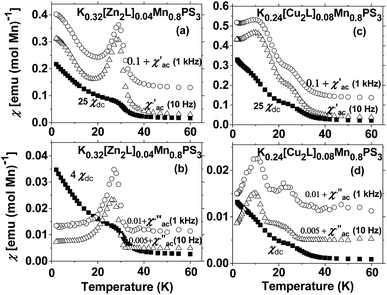
For the diamagnetic ZnII-based composite, the real part of the AC susceptibility χ′M displays a maximum at 28 K (Fig. 6(a)). This phenomenon can also be observed for the DC susceptibility data, as shown in Fig. 5. The existence of the peak in the in-phase component of the AC susceptibility can be considered to represent a magnetic phase transition to an ordered state. Because no frequency dependence is observed in the AC data, the occurrence of spin glass behaviour can be excluded.50,51
The observation of a maximum at 28 K in the imaginary part of the AC susceptibility (Fig. 6(b)) is important, because it implies the existence of a partially canted antiferromagnetic structure that generates a weak ferromagnetic response in the solid.51
The temperature dependence of the real part of the AC data for K0.24[Cu2L]0.08Mn0.8PS3 (2) exhibits no dependence on the frequency, as was the case for the previously studied ZnII composite. The maxima present in the χ′(T) plot are also observed in the χ′′(T) plot at similar temperatures (Fig. 6(c) and (d), respectively). For the CuII composite, the maximum at 12 K is more intense than that observed at 24 K. Thus, the existence of two magnetic lattices with different ordering temperatures can be inferred.
As the AC magnetic behaviour of the two composites is also dependent on the guest, these phenomena can be associated with the influence of the interlayer interactions between the metal ions present in the macrocyclic complexes and the protruding sulphur atoms in two adjacent layers on the magnetic properties of the MnII ions.
Fig. 7 summarizes the EPR spectra recorded for these composites at selected temperatures. As can be observed, the spectra are similar for both composites, and their overall behaviour as a function of temperature resembles that of the potassium precursor. Therefore, most of the above discussion can also be reproduced here. However, an interesting feature of the ZnII and CuII composites that was not observed in the spectrum of the precursor phase is the apparent expansion of the spectra over a wider range of field strengths as the temperature increases from 6 K to 20 K. The strong peak observed below 2500 G shifts significantly towards lower field strengths as the temperature increases to 30 K, whereas the peak above 3500 G shifts to higher field strengths. The collapse of the spectra into a single line is only observed above 30 K. The fact that the observation of a single line in the spectra of the composites occurs at a higher temperature than for the precursor phase can be related to the broader spontaneous magnetization curve of the composites.
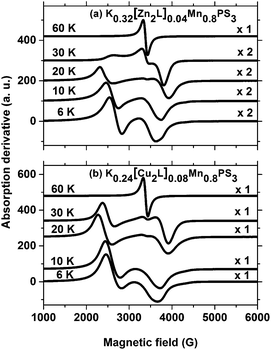 | ||
| Fig. 7 EPR spectra of the composites at selected temperatures. Microwave frequencies: (a) 9.489 GHz, (b) 9.488 GHz. | ||
4. Conclusions
The composites K0.32[Zn2L]0.04Mn0.8PS3 (1) and K0.24[Cu2L]0.08Mn0.8PS3 (2) contain two kinds of guest in the interlayer space of the host MnPS3, as evidenced by their SEM-EDX data. As inferred from the FTIR spectra, the vacancies created in the MnPS3 layers are not strongly modified by the partial intercalation of the complex species in the interlamellar space of K0.4Mn0.8PS3·H2O. Whereas for K0.32[Zn2L]0.04Mn0.8PS3 (1) the existence of two magnetic lattices with similar ordering temperatures can be inferred, the existence of two magnetic lattices with different ordering temperatures was detected for K0.24[Cu2L]0.08Mn0.8PS3 (2). Finally, as the magnetic phenomena of the two composites are dependent on the guest, these observations can be associated with the interlayer interactions of the metal centers of the guest macrocyclic complexes and the potassium ions with the protruding sulphur atoms in the layers, which affect the magnetic properties of the MnII ions. The EPR spectra of pristine MnPS3 in the temperature range of 4–300 K can be described by a single Lorentzian line, which is characteristic of an exchange narrowing process. The temperature dependences of the line shape parameters are in qualitative agreement with the magnetization data. The EPR spectra of the K0.4Mn0.8PS3·H2O phase and the ZnII and CuII composites are similar but differ from that of the pristine phase below 30 K by exhibiting a structure composed of broad lines at different g-values. In no case was a hyperfine structure observed. The structured spectra can be qualitatively described in terms of the S = 5/2 manifold of MnII spins subjected to dynamic processes governed by electron–electron interactions controlled by the temperature, which is the fundamental factor that dictates the narrowing (and broadening) of the spectra with an increase in temperature.Acknowledgements
The authors want to thank Proyectos FONDECYT 1120001 and 1160106 and Centers of Excellence with Basal/CONICYT Financing, FB0807, (CEDENNA) for financial support. This work was done under the International Collaborative Program LIA-MIF 836 (CNRS/CONICYT). We also thank Prof. Albert Escuer (Universitat de Barcelona, Spain) for providing the magnetic measurements. P. F. C. acknowledges the doctoral grant 21110612 from CONICYT. Brazilian EPR facilities are supported by grants from CeRTEV, Center for Research, Technology and Education in Vitreous Materials, Fapesp 2013/07793-6.References
- R. Brec, D. M. Schleich, G. Ouvrard, A. Louisy and J. Rouxel, Inorg. Chem., 1979, 18(7), 1814–1818 CrossRef CAS.
- G. Abellán, J. a. Carrasco, E. Coronado, J. Romero and M. Varela, J. Mater. Chem. C, 2014, 2(19), 3723 RSC.
- E. Spodine, P. Valencia-Gálvez, P. Fuentealba, J. Manzur, D. Ruiz, D. Venegas-Yazigi, V. Paredes-García, R. Cardoso-Gil, W. Schnelle and R. Kniep, J. Solid State Chem., 2011, 184(5), 1129–1134 CrossRef CAS.
- M. Bernasconi, G. L. Marra, G. Benedek, L. Miglio, M. Jouanne, C. Julien, M. Scagliotti and M. Balkanski, Phys. Rev. B: Condens. Matter Mater. Phys., 1988, 38(17), 89–99 Search PubMed.
- E. Ressouche, M. Loire, V. Simonet, R. Ballou, A. Stunault and A. Wildes, Phys. Rev. B: Condens. Matter Mater. Phys., 2010, 82(10), 100408 CrossRef.
- S. Torre and J. Ziolo, Phys. Rev. B: Condens. Matter Mater. Phys., 1989, 39(13), 8915–8923 CrossRef CAS.
- P. Fuentealba, L. Serón, C. Sánchez, J. Manzur, V. Paredes-Garcia, N. Pizarro, M. Cepeda, D. Venegas-Yazigi and E. Spodine, J. Coord. Chem., 2014, 67(23–24), 3894–3908 CrossRef CAS.
- J. Guo, X. Chen, S. Jin, M. Zhang and C. Liang, Catal. Today, 2015, 246, 165–171 CrossRef CAS.
- E. Spodine, P. Valencia-Gálvez, J. Manzur, V. Paredes-García, N. Pizarro, K. Bernot and D. Venegas-Yazigi, Polyhedron, 2012, 44(1), 187–193 CrossRef CAS.
- R. Clement, J. J. Girerd and I. Morgenstern-Badarau, Inorg. Chem., 1980, 19(9), 2852–2854 CrossRef CAS.
- K. Okuda, K. Kurosawa, S. Saito, M. Honda, Z. Yu and M. Date, J. Phys. Soc. Jpn., 1986, 55(12), 4456–4463 CrossRef CAS.
- P. a. Joy and S. Vasudevan, Phys. Rev. B: Condens. Matter Mater. Phys., 1992, 46(9), 5425–5433 CrossRef CAS.
- P. Jeevanandam and S. Vasudevan, J. Phys.: Condens. Matter, 1999, 11(17), 3563–3570 CrossRef CAS.
- C. Yang, X. Chen, J. Qin, K. Yakushi, Y. Nakazawa and K. Ichimura, J. Solid State Chem., 2000, 150(2), 281–285 CrossRef CAS.
- P. Valencia, J. Manzur, a. M. Garcia, V. Paredes-Garcia, R. Cardoso-Gil, W. Schnelle, R. Kniep, P. Fuentealba, D. Venegas-Yazigi and E. Spodine, J. Chil. Chem. Soc., 2013, 58(4), 1952–1956 CrossRef CAS.
- Y. Mathey, R. Clement, C. Sourisseau and G. Lucazeau, Inorg. Chem., 1980, 19(9), 2773–2779 CrossRef CAS.
- R. Clement, J. Am. Chem. Soc., 1981, 103(23), 6998–7000 CrossRef CAS.
- O. Poizat and C. Sourisseau, J. Phys. Chem., 1984, 88(14), 3007–3014 CrossRef CAS.
- R. Clement, J. Chem. Soc., Chem. Commun., 1980, 14, 647 RSC.
- D. Yang, P. Westreich and R. F. Frindt, J. Solid State Chem., 2002, 166(2), 421–425 CrossRef CAS.
- L. Silipigni, G. Di Marco, G. Salvato and V. Grasso, Appl. Surf. Sci., 2005, 252(5), 1998–2005 CrossRef CAS.
- J. S. O. Evans, D. O'Hare, R. Clement, A. Leaustic and P. Thuéry, Adv. Mater., 1995, 7(8), 735–739 CrossRef CAS.
- J. S. O. Evans, D. O'Hare and R. Clement, J. Am. Chem. Soc., 1995, 117(16), 4595–4606 CrossRef CAS.
- T. Roisnel and J. Rodríquez-Carvajal, Mater. Sci. Forum, 2001, 378–381, 118–123 CrossRef CAS.
- D. Louër and A. Boultif, Z. Kristallogr., 2007, 26, 191–196 CrossRef.
- V. W. Klingen, R. Ott and H. Hahn, Z. Anorg. Allg. Chem., 1973, 278, 271–278 CrossRef.
- E. P. Papadopoulos, a. Jarrar and C. H. Issidorides, J. Org. Chem., 1966, 31(2), 615–616 CrossRef CAS.
- S. Sreedaran, K. S. Bharathi, a. K. Rahiman, K. Rajesh, G. Nirmala, L. Jagadish, V. Kaviyarasan and V. Narayanan, Polyhedron, 2008, 27(7), 1867–1874 CrossRef CAS.
- S. Sreedaran, K. Shanmuga Bharathi, A. Kalilur Rahiman, L. Jagadish, V. Kaviyarasan and V. Narayanan, Polyhedron, 2008, 27(13), 2931–2938 CrossRef CAS.
- S. K. Dutta, U. Flörke, S. Mohanta and K. Nag, Inorg. Chem., 1998, 37(19), 5029–5032 CrossRef CAS PubMed.
- L. K. Thompson, S. K. Mandal, S. S. Tandon, J. N. Bridson and M. K. Park, Inorg. Chem., 1996, 35(11), 3117–3125 CrossRef CAS PubMed.
- S. S. Tandon, L. K. Thompson, J. N. Bridson, V. McKee and A. J. Downard, Inorg. Chem., 1992, 31(1), 4635–4642 CrossRef CAS.
- K. Brychcy, K. Dräger and K. Jens, Chem. Ber., 1994, 127, 1817–1826 CrossRef CAS.
- S. R. Korupoju, N. Mangayarkarasi, S. Ameerunisha, E. J. Valente and P. S. Zacharias, J. Chem. Soc., Dalton Trans., 2000, 16, 2845–2852 RSC.
- D. Venegas-Yazigi, S. Cortés, V. Paredes-García, O. Peña, A. Ibañez, R. Baggio and E. Spodine, Polyhedron, 2006, 25(10), 2072–2082 CrossRef CAS.
- E. Spodine, Y. Moreno, M. T. Garland, O. Pena and R. Baggio, Inorg. Chim. Acta, 2000, 309(1–2), 57–64 CrossRef CAS.
- G. Ouvrard, R. Brec and J. Rouxel, Mater. Res. Bull., 1985, 20(10), 1181–1189 CrossRef CAS.
- D. Yang and R. F. Frindt, J. Mater. Res., 2000, 15(11), 2408–2413 CrossRef CAS.
- G. Le Flem, R. Brec, G. Ouvard, A. Louisy and P. Segransan, J. Phys. Chem. Solids, 1982, 43(5), 455–461 CrossRef CAS.
- G. Ouvrard, R. Brec and J. Rouxel, C. R. Acad. Sci., 1982, 294(II), 971–976 CAS.
- K. Kurosawa, S. Saito and Y. Yamaguchi, J. Phys. Soc. Jpn., 1983, 52(11), 3919–3926 CrossRef CAS.
- R. Brec, Solid State Ionics, 1986, 22(1), 3–30 CrossRef CAS.
- W. Toyoshima, T. Masubuchi, T. Watanabe, K. Takase, K. Matsubayashi, Y. Uwatoko and Y. Takano, 25th Int. Conf. Low Temp. Phys. (Lt25), Part 4, 2009, vol. 150 Search PubMed.
- P. A. Joy and S. Vasudevan, J. Chem. Phys., 1993, 99(6), 4411–4422 CrossRef CAS.
- X. Zhang, X. Su, X. Chen, J. Qin and M. Inokuchi, Microporous Mesoporous Mater., 2008, 108(1–3), 95–102 CrossRef CAS.
- X. Zhang, X. Su, H. Zhou, Y. Fu, X. Chen, C. Yang, J. Qin, M. Inokuchi and M. Kinoshita, Synth. Met., 2005, 152(1–3), 485–488 CrossRef CAS.
- A. Léaustic, E. Rivière and R. Clément, Chem. Mater., 2003, 15(25), 4784–4789 CrossRef.
- K. Yang, X. Su, X. Zhang, X. Chen, E. Fu, J. Qin, M. Inokuchi and M. Kinoshita, J. Solid State Chem., 2004, 177(11), 4300–4304 CrossRef CAS.
- X. Zhang, H. Zhou, X. Su, X. Chen, C. Yang, J. Qin and M. Inokuchi, J. Alloys Compd., 2007, 432(1–2), 247–252 CrossRef CAS.
- R. D. Sommer, B. J. Korte, S. P. Sellers and G. T. Yee, Mater. Res. Soc. Symp. Proc., 1997, 488, 471 CrossRef.
- Y. G. Huang, D. Q. Yuan, L. Pan, F. L. Jiang, M. Y. Wu, X. D. Zhang, W. Wei, Q. Gao, Y. L. Jeong, J. Li and M. C. Hong, Inorg. Chem., 2007, 46(23), 9609–9615 CrossRef CAS PubMed.
Footnote |
| † Electronic supplementary information (ESI) available. See DOI: 10.1039/c7ra05089e |
| This journal is © The Royal Society of Chemistry 2017 |

