 Open Access Article
Assembly line synthesis of isoprene from formaldehyde and isobutene over SiO2-supported MoP catalysts with active deposited carbon†
Yanlong Qi ab,
Long Cui
 a,
Quanquan Dai
 a,
Yunqi Lia and
Chenxi Bai
 *a
*a
aKey Laboratory of Synthetic Rubber, Changchun Institute of Applied Chemistry, Chinese Academy of Sciences, # 5625, Renmin Road, Changchun, 130022, P. R. China. E-mail: baicx@ciac.ac.cn
bUniversity of the Chinese Academy of Sciences, # 19, Yuquan Road, Beijing 100049, P. R. China
First published on 28th July 2017
Abstract
Isoprene is a very important monomer for synthetic rubber. Its synthesis in the presence of MoP catalysts via the vapour phase reaction of isobutene with formaldehyde has been studied. The catalysis by various catalysts was characterized by TG analysis, the low-temperature adsorption of nitrogen, XRD, element analysis, TPD, the FT-IR of adsorbed pyridine, XPS and MAS NMR. A chemical process was proposed and confirmed. Isoprene was synthesized in an “assembly line” process through different active sites at the surface of the MoP catalysts, where the active sites were derived from P and Mo species and deposited carbonaceous species. In the induction period, carbon species are preferentially deposited on P species, leading to a decrease in the active Mo and P species (active sites 1), accompanied with a burst in active carbonaceous species (active sites 2). This soundly describes the burst in catalyst capacity in the induction period, which then decreases over time on stream at the expense of the active carbonaceous species. Accordingly, through the prior formulation of sites 1 with sites 2 in a catalyst, the time-consuming induction period can be nearly eliminated. We also observed that a good ratio of these two active sites can efficiently retard the catalyst deactivation. This study clarifies the roles of acid sites and active species in MoP catalysts in the synthesis of isoprene and shows that their optimal ratio can help reduce the length of the induction period and extend the lifetime of the catalysts.
1 Introduction
The decline in catalytic capacity is a problem of great concern for various reactions over heterogeneous catalysts and is mainly due to carbon deposition.1–7 Since the concept of catalysis by carbonaceous deposits was first proposed,8 the deleterious deposited carbon was found to act as efficient active sites in various reactions.9–15 These processes significantly involve an induction period forming new active species. Therefore, those features require a greater understanding of the chemical processes involving coke deposition, where understanding the process in and after the induction period is particularly crucial for revealing the catalyst behaviour.Herein, this study focuses on the condensation of isobutene (IB) with formaldehyde leading to isoprene (IP), which is a strategically important monomer for fabricating synthetic rubber, elastomers and resins.16 The earlier route for IP synthesis was based on a two-step reaction:17 (1) the condensation of IB and formaldehyde to produce 4,4-dimethyldioxane-1,3 (DMD) in the liquid phase, and (2) the cracking of DMD into IP over solid catalysts (Scheme 1a).18 The two-step process has various drawbacks,19–21 and consequently a new promising route is urgently needed. Developing a one-step selective process is a very attractive pathway in this regard on account of its simplified procedures, and due to the possibility of easily manufacturing high purity isoprene (Scheme 1a). This process is based on heterogeneous catalysts, include zeolites,22,23 phosphates,20,24 sulfates,25 oxide catalysts,26 heteropolyacids,19,21,27 and silver catalysts.28 These reactions are associated with high initial yields of isoprene (60–70%), but also involve a rather low selectivity and a short catalyst life time due to its rapid deactivation. Therefore, it is of great significance to gain an in-depth insight into the variation of catalysts (especial for active sites) with carbon deposition. Furthermore, the catalytic capacity declines not only because of the variation of catalysts or active sites, but also due to the variation in chemical process bridging the catalyst deactivation and the active sites (catalysts) variation.
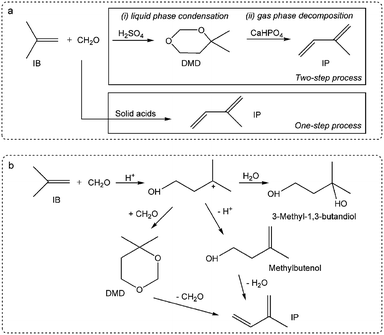 | ||
| Scheme 1 Synthesis of isoprene from IB and formaldehyde: (a) one-step and two-step processes, (b) reaction pathways of the one-step process. | ||
Krzywicki et al.24 reported using different concentrations of H3PO4 on Al2O3 to prepare catalysts with various acidic strength sites. The study suggested that the formation of IP was observed on strong acidic sites over catalysts with H0 ≤ −12.7, but the catalysts with exclusively strong acidic sites were less active than those having acid sites of various strengths. This inferred that the reaction pathway involved different active sites on the catalysts surface. The reaction pathways over 12- and 10-ring zeolites has been suggested, as seen in Scheme 1b.29 Dumitriu et al.22,23 pointed out the crucial role of the acid sites on the zeolites strength in the selective synthesis of IP and reported that moderate Brönsted acid sites resulted in high efficiency and excellent selectivity. He suggested that DMD might be an intermediate during Prins condensation, where it is formed and easily cracked over catalysts with strong and medium acid sites at high temperature. Dang et al.25 suggested that IP production was not only related to the acid sites but also to the base sites. In addition, it was reported that strong acid sites led to side reactions and carbon deposition, with the latter resulting in catalyst deactivation.
Much research has concluded that strong acid sites lead to side reactions, while moderate sites are in favour of IP synthesis; moreover, they attributed catalytic capacity declining to carbon deposition or the loss of active sites.30 Unfortunately, it was concluded that the declining activity can be attributed to the catalyst variation, but these conclusions were made without any consideration of the chemical processes, and the effect of deposited carbon, which has been confirmed at “work sites”, has been neglected.
Ivanova et al.9 reported that the yield of IP increased rapidly with carbon deposition in the induction period and suggested that carbon played a key role in the selective synthesis of IP. By gas chromatography-mass spectrometry (GC-MS) analysis, it was demonstrated that deposited carbon with unsaturated branched surface species could alone catalyse IB and formaldehyde into IP and promote selectivity. Moreover, the main by-products were investigated, it was found that carbon monoxide formation proceeded via formaldehyde decomposition over Lewis acid sites, DMD was observed during the steady-state period, and the main reaction network involving methylbutenols was also proposed.21 However, this network was proposed without consideration of the influence of the catalysts, and indeed, how the original sites and forming sites (carbon) work is still unknown, in which also the influence of catalysts variation on the active sites and the chemical route is still unresolved.
To gain deeper insight into the synthesis of IP, its non-ignorable influence on the catalysts (especially the active sites) variation on the chemical reaction pathway, which essentially leads to activity decline, was investigated. In this study, MoP catalysts were applied for the synthesis of IP. Their catalytic capacity was found to reach a steady state and then decline in a short time, which was helpful to focus the study on the catalysts (active sites) variation with time on stream (TOS). It was first reported that the one-step synthesis of IP from IB and formaldehyde over MoP catalysts involves almost simultaneous processes (namely DMD forming and DMD cracking) in the primary route, where these two processes are catalysed by the cooperation between different sites (marked as forming sites and cracking sites), almost like in an “assembly line” type process. The need to increase the cracking sites at the beginning accounts for the need for an induction period, which could almost be eliminated by introducing cracking sites into fresh catalysts. The nature of the sites has been studied. In addition, the imbalance between the forming and cracking sites is the key reason for the catalyst activity declining.
2 Experimental
2.1 Materials and method
The catalysts were prepared by initial wetness impregnation. The supporting spherical SiO2 (60–100 meshes, Sinopharm Chemical Reagent Co., Ltd, China) was first calcined at 450 °C for 5 h and then dried at 110 °C in an oven before use. In a typical procedure 0.01 mol of ammonium molybdate tetrahydrate ((NH4)6Mo7O24·4H2O, Tianjin chemical Reagent Corp., China) was added into a flask with deionized water at 55 °C, kept stirring until the formation of homogeneous phase, and then 0.15 mol of phosphoric acid (H3PO4, Beijing Chemical Corp., China) was added and stirred for 30 min to obtain the precursor solution. This was followed by the addition of 20 g of supporting SiO2, with the solutions then aged overnight at ambient temperature. The samples were dried at 110 °C for 3 h, calcined in a flow of dry air to 450 °C with a temperature ramp of 4.5 °C min−1 and then kept at this temperature for 5 h. The mole ratio of H3PO4/(NH4)6Mo7O24·4H2O was 5, 10, 15, and 25, with fixing the MoO3 load at 20 wt% in theory. The prepared catalysts were denoted as MoP X (A, B, C, D), in which X corresponded to the mole ratio of H3PO4 and (NH4)6Mo7O24·4H2O (5, 10, 15, 25, respectively).2.2 Characterization
TG experiments were performed on a TA SDT Q 600 instrument. Temperature-programmed oxidation was carried out in a flow of air in the temperature range of 25–800 °C with a heating rate of 10 °C min−1. The BET surface area, pore volume, and pore sizes were measured on a Quantachrome Autosorb-iQ at liquid nitrogen temperature. Inductively coupled plasma (ICP) was conducted to determine the chemical composition of the samples.X-ray powder diffraction (XRD) patterns were obtained on a Bruker D8 Advance diffractometer using Ni-filtered CuKα radiation at 40 kV and 20 mA (λ = 0.154 nm). X-ray photoelectron spectroscopy (XPS, ESCALAB 250, Thermo) was used to examine the fresh catalysts and coke catalysts.31 P and13 C MAS NMR spectra (Bruker Avance-400 spectrometer) were employed to characterize the fresh catalysts and the coke-deposited catalysts.
Temperature-programmed desorption of ammonia (NH3-TPD) experiments were performed on a TP-5080 (Tianjin Xianquan) with a TCD detector in the temperature range of 25–700 °C in a flow of dry He (30 ml min−1). In a typical experiment, the samples were heated to 400 °C at a rate of 12 °C min−1 and held there for 30 min in a flow of He, then cooled to room temperature and saturated with NH3 for 30 min. Subsequently, the samples were heated to 100 °C with a rate of 10 °C min−1 and kept there for 30 min to physically remove the adsorbed NH3, while NH3-TPD was carried out from 100 °C to 700 °C at a rate of 10 °C min−1.
Qualitative and quantitative analyses were conducted with GC-MS (Agilent 5975 MSD with Agilent SE-54) and GC (ThermoFisher Trace 1300 with Agilent VF-5 ms) equipped with a FID, respectively. Mainly liquid products were determined by1 H NMR and13 C NMR (AV-400 M).
2.3 Catalyst evaluation
3 Results and discussion
3.1 Synthesis of IP over MoP catalysts
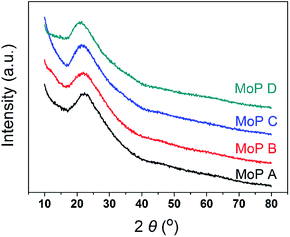
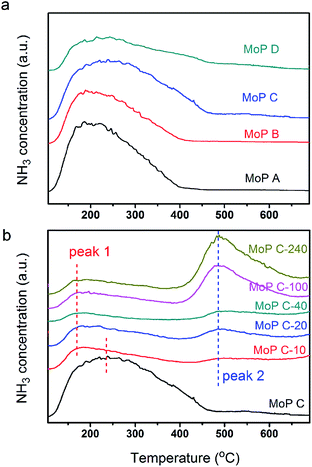
The main characteristics of the MoP X (A, B, C, D) catalysts are listed in Table 1. The XRD pattern (Fig. 1) indicated that all the catalysts showed up as typical amorphous materials, which may be due to the good dispersion of Mo and P individual oxides (MoOx and POy). In addition, NH3-TPD was conducted to determine the acidity of the MoP catalysts, with the results presented in Fig. 3a, showing just one peak, which was slightly wider and shifted to high temperature with an increasing P content. This implied that the MoP catalysts presented a similar distribution of acidity, but the acidic strength was stronger with increasing the P content. On the other hand, those peaks, assigned to the amount of acid sites, showed the order MoP C > MoP B > MoP A > MoP D (see the details listed in Table 1). The P species can provide Brönsted sites with the terminal P–OH group, and hence the increasing acid sites can be attributed to Brönsted sites. The surface area and chemical composition were also determined. These same fresh MoP catalysts were employed for IP synthesis from IB and formaldehyde (Table 2). MoP C gave rise to the best yield of IP. With the P content changing, it showed the order MoP D < MoP A < MoP B < MoP C, which was in line with the amount of acid sites. Therefore, the amount of acid sites had a significant influence on the reaction. Moreover, the Brönsted sites also played a key role in this reaction, which was in accordance with most reports for Prins reactions.| Catalysts | Surface area | TG | Elemental analysis | Acidity (TPD NH3) | Acidity (FTIR Py) | |||
|---|---|---|---|---|---|---|---|---|
| m2 g−1 | % | Mo/P | Moa wt% | Pb wt% | μmol g−1 | Bc μmol g−1 | Ld μmol g−1 | |
| a Calculated as MoO3.b Calculated as PO4.c B: Brönsted acid sites.d L: Lewis acid sites. | ||||||||
| SiO2 | 243.23 | — | — | — | — | — | — | |
| MoP A | 151.00 | — | 1.32 | 19.03 | 9.54 | 1111.08 | — | — |
| MoP B | 132.78 | — | 0.70 | 18.90 | 17.71 | 1138.19 | — | — |
| MoP D | 29.35 | — | 0.28 | 21.05 | 46.61 | 630.65 | — | — |
| MoP C | 84.94 | 2.92 | 0.49 | 21.58 | 28.98 | 1228.72 | 51.19 | 12.00 |
| MoP C-10 | 75.97 | 22.06 | 0.55 | 21.83 | 26.35 | 302.48 | 16.25 | 19.77 |
| MoP C-20 | 70.50 | 7.74 | — | — | — | 261.90 | — | — |
| MoP C-40 | 75.80 | 11.60 | 0.53 | 22.65 | 28.32 | 222.89 | 1.83 | 6.21 |
| MoP C-100 | 87.67 | 7.82 | — | — | — | 198.43 | — | — |
| MoP C-240 | 58.37 | 23.53 | 0.54 | 19.48 | 23.64 | 164.36 | 0.85 | 6.38 |
| Catalystsb | Formaldehyde (%) | Isobutene (%) | Yieldc | ||
|---|---|---|---|---|---|
| Conversion | Selectivity | Conversion | Selectivity | ||
| a The reaction was carried at 300 °C, catalyst mass was 1.5 g, iC4H8/CH2O = 7, WHSV = 10 g (g h)−1.b All the catalysts were supported on SiO2.c Yield to isoprene from formaldehyde. | |||||
| MoP A | 85.36 | 28.13 | 8.63 | 50.87 | 24.01 |
| MoP B | 96.33 | 27.04 | 9.34 | 58.36 | 26.05 |
| MoP C | 92.68 | 48.30 | 9.55 | 96.13 | 44.76 |
| MoP D | 41.42 | 49.97 | 8.55 | 50.70 | 20.70 |
| MoO3 | 93.44 | 30.02 | 9.03 | 65.00 | 28.05 |
| H3PO4 | 94.68 | 37.82 | 8.90 | 84.22 | 35.81 |
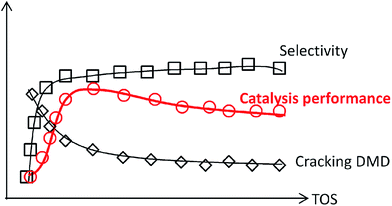
MoP C catalyst was taken to study the catalysts behaviour with TOS. The catalytic capacity over the MoP C-y, where y is the different time on stream, catalysts is presented in Fig. 2 (after the induction period) and Fig. 8 (during the induction period: 5, 10, 20 min on stream). These present the feature of a volcano curve for the catalytic capacity, which improves in the induction period and then gradually declines with TOS, which is similar behaviour to other heterogeneous catalysts. To elucidate this, the MoP C-y catalysts were analysed by TG, ICP, BET, XRD, XPS, TPD, FT-IR of adsorbed pyridine and 13C MAS NMR.
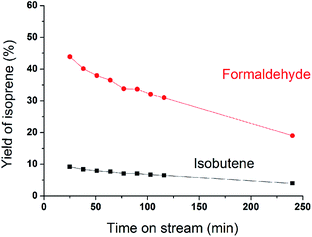 | ||
| Fig. 2 Yields of isoprene from formaldehyde and isobutene versus time on stream after induction period (300 °C, 1.5 g of catalyst, iC4H8/CH2O = 7, WHSV = 10 g (g h)−1). | ||
3.2 Study of the catalyst variation with TOS
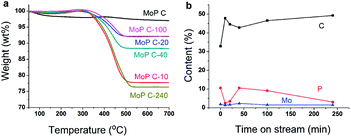
The variation of MoP C with TOS was first investigated by TG (Fig. 3a), as summarized in Table 1. The loss weight due to coke presented in the order MoP C-240 > MoP C-10 > MoP C-40 > MoP C-100 > MoP C-20 > MoP C. The content of carbon deposits increased and reached to the first peak over MoP C-10, then increased with TOS. This was similar with the surface C in XPS, where: MoP C-240 > MoP C-10 > MoP C-100 > MoP C-20 > MoP C-40 > MoP C. This was attributed to the carbon deposition consisting of alkoxides and ethers in the early stage (10 min on stream), which were then changed into olefin alkenes.9XPS was conducted to study the changing of the elements on the catalyst surface (Fig. 3b). Compared with Mo, P changed noticeably with C in a reverse tend, which indicated P played a key role for the growth of the coke. This will be discussed in the following part. The catalyst surface was determined by BET, and the Mo/P species confirmed by ICP, which was found to have changed slightly during the reaction time within 240 min (Table 1). The XRD patterns indicated the MoP catalysts were amorphous materials and were well dispersed on the SiO2 support (Fig. S1†).
To further identify the change in the catalysts with TOS, NH3-TPD was employed to determine the amount and strength of the acid sites of the MoP C catalysts. The profiles in Fig. 4 show one peak in the temperature range of 100–700 °C for the fresh MoP (MoP A, MoP B, MoP C and MoP D), and two peaks for those with coke deposition (labelled as peak 1 and peak 2). It was evident that the peak in the temperature range 100–400 °C (peak 1) decreased with TOS as following: MoP C > MoP C-10 > MoP C-20 > MoP C-40 > MoP C-100 > MoP C-240, while the peak in the temperature range 400–700 °C (peak 2) increased in the order MoP C < MoP C-10 < MoP C-20 < MoP C-40 < MoP C-100 < MoP C-240. Peak 1, corresponding to NH3 adsorbed on the acid sites, could be assigned to the mainly medium strength acid sites and slightly stronger acid sites (>400 °C). Therefore, from the beginning of the reaction, the shift to a lower temperature indicated that the strength of the acid sites changed to weaker ones. The amount of acid sites determined by NH3-TPD correlated with the mass of the catalysts listed in Table 1. Peak 2 was attributed to gasification of the coke deposition, it was also confirmed by treating the catalyst under 530 °C for 30 min prior to the adsorption of NH3 (Fig. S2†).
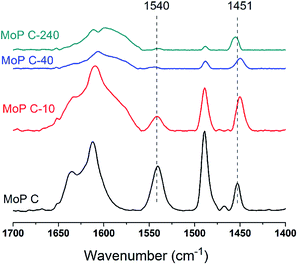
The nature of the acid sites was studied via FT-IR spectroscopy of the adsorbed pyridine, as shown in Fig. 5. The main bands observed over all the samples were assigned as follows:
- 1490 cm−1 was assigned to the H-bonded pyridine;
- 1540 cm−1 was assigned to pyridine protonated on Brönsted sites;
- 1451 cm−1 was assigned to pyridine adsorbed on Lewis acid sites.
The amount of Brönsted sites decreased in the order MoP C > MoP C-10 > MoP C-40 > MoP C-240 as the Lewis acid sites decreased slightly, with those acid sites attributed to P–OH and Mon+. This trend was in line with content of P and Mo on the catalyst surface (Fig. 3b). Certainly, it can infer that the total amount of acid sites (mainly Brönsted sites) will decrease with TOS. Compared with MoP C, the Brönsted sites of MoP C-240 remarkably dropped down low, but the yield of IP just decreased by nearly half, which implied that the active sites for the condensation of IB with formaldehyde were Brönsted sites as well as Lewis sites.
3.3 Study on a chemical pathway of catalysts with TOS
To gain insights into the influence of the variation of the catalysts on the chemical process, it was first hypothesized that 4,4-dimethyldioxane-1,3 (DMD) was the primary intermediate for the one-step synthesis of IP in this study. DMD was confirmed,9 but cracked easily over 275 °C.23 Therefore, the reaction route was taken as a two-step process involving first DMD forming from aldehyde and alkene, then cracking to produce IP fast. Here, α-methylstyrene and formaldehyde were used as probe molecules to clarify the response of DMD forming and cracking to the variation of the catalysts with TOS, which led to the activity dropping. First, the MoP C-y catalysts were applied for the condensation of α-methylstyrene and formaldehyde to synthesize 4-methyl, 4-phenyl-dioxane-1,3 (MPD), as shown in Table 3. The MPD yield reached 95.56% over MoP C and decreased in the order MoP C > MoP C-10 > MoP C-20 > MoP C-40 > MoP C-100 > MoP C-240, based on the variation of peak 1 in NH3-TPD (Fig. 4b). The significant decline in yield suggested the ability of the catalysts to form MPD decreased with TOS. On the other hand, those catalysts were also employed for MPD cracking, which involved C–O bond cleavage and C–C bond cleavage to give 2-phenyl-butadiene-1,3 and α-methylstyrene, respectively. MoP C-240 showed excellent selectivity for C–O bond cleavage to produce the desired product 2-phenyl-butadiene-1,3 (Fig. 6). Also, the selectivity for C–O bond cleavage showed the order MoP C-240 > MoP C-100 > MoP C-40 > MoP C-20 > MoP C-10 > MoP C. Moreover, there were many significant by-products for MoP C, and they decreased in the order MoP C > MoP C-10 > MoP C-20 > MoP C-40 > MoP C-100 > MoP C-240. This suggested that the catalyst selectivity increased with TOS, corresponding with the trend of peak 2 in NH3-TPD (Fig. 4b). The peak at 12.7 min was attributed to MPD, which increased in the order MoP C < MoP C-10 < MoP C-20 < MoP C-40 < MoP C-100 < MoP C-240, this meant that the catalyst ability to crack MPD decreased with TOS (Fig. 6). Therefore, it can be concluded that MPD was formed and cracked at different active sites over the MoP catalysts, which were denoted as the forming sites (sites 1) and cracking sites (sites 2). Considering Fig. 4b and 5, it can be deduced that sites 1 were due to acid sites, while sites 2 were due to active carbon deposits, respectively.| Catalysts | Conversionb (%) | Selectivityc (%) | Yieldb (%) |
|---|---|---|---|
| a The reaction was carried at 95 °C for 3 h, formaldehyde/α-methylstyrene = 4.5, 1.0 g of catalyst.b Conversion or selectivity from α-methylstyrene.c Yield of MPD. | |||
| MoP C | 97.93 | 97.58 | 95.56 |
| MoP C-10 | 90.09 | 90.31 | 81.36 |
| MoP C-20 | 92.65 | 60.87 | 56.40 |
| MoP C-40 | 74.54 | 58.38 | 43.52 |
| MoP C-100 | 62.05 | 62.14 | 38.56 |
| MoP C-240 | 45.00 | 71.56 | 32.20 |
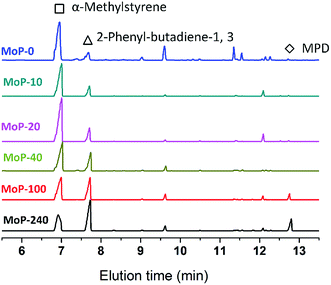 | ||
| Fig. 6 GC chromatograms of MPD cracking over MoP C-y catalysts at 300 °C for 30 min, 1.0 g of catalyst, 18 mg min−1 of MPD with 90 ml min−1 of N2. | ||
Many studies have suggested that carbon was deposited and covered in the stronger acid sites, which thus exposed the medium and weak acid sites, which corresponded to the selective activity of IP synthesis.26,31 This process leads to the appearance of an induction period and a decrease in the number of acid sites, and can even result in deactivation of the catalysts. In this case, the narrower distribution of medium acid sites will lead to a higher selectivity. In this work, MoO3/SiO2 had a narrower distribution of acid sites than the MoP C-y catalysts, thus it will give the best selectivity for MPD cracking. Nevertheless, it seemed not the case as presented in Fig. 7. Therefore, the acidity of sites is primary, but its nature is also of paramount importance. This also further verified that the deposited carbon is not useless.
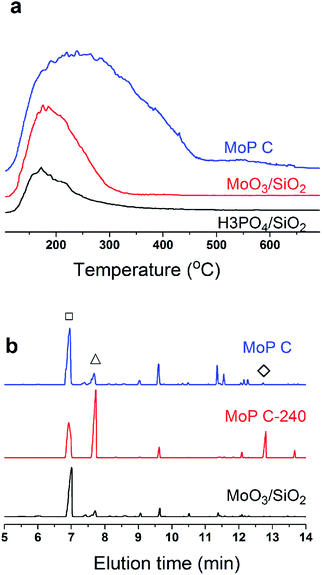 | ||
| Fig. 7 (a) NH3-TPD curves, and (b) GC chromatograms of MPD cracking at 300 °C for 30 min, 1.0 g of catalyst, 18 mg min−1 of MPD with 90 ml min−1 of N2. | ||
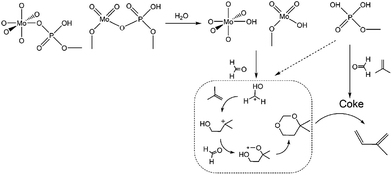
Based on all the above discussion, it can be deduced that sites 1 on the catalysts favour the condensation of aldehyde and alkene and are responsible for forming DMD, while sites 2 favour C–O bond cleavage for diene-1,3. Thus, IP was “assembly line” synthesized on sites 1 in cooperation with sites 2 over catalysts. At the start of the reaction, sites 1 presented an outstanding ability to form DMD, but sites 2 had not been formed or were in trace amount only, so the amount of IP was low. When there was sufficient sites 2, DMD was chiefly synthesized and efficiently cracked into IP, as presented in Scheme 2. Then with increasing TOS, the decline of IP can be attributed to the decrease in sites 1, which led to DMD cutting down.
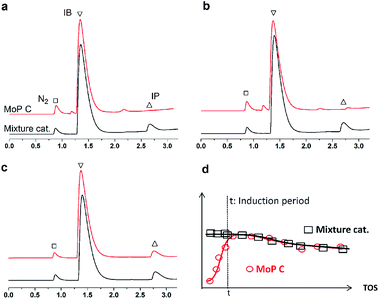
If this deduction were right, it would suggest that: (1) a catalyst possessing sites 1 and sites 2 can simultaneously give good performance at the beginning of the reaction, and (2) a large amount of DMD will appear at the beginning of the reaction because of the excellent capacity to form DMD but the poor ability to crack it. To further confirm (1), a mixture of MoP C and MoP C-240 (1![[thin space (1/6-em)]](https://www.rsc.org/images/entities/char_2009.gif) :
:![[thin space (1/6-em)]](https://www.rsc.org/images/entities/char_2009.gif) 1) were employed for the synthesis of IP, as shown in Fig. 8. The mixture catalyst showed catalytic behaviour, as desired at the beginning of reaction, and the induction period was nearly eliminated. As for (2), the products from the synthesis of IP over fresh MoP C at the beginning of 4–9 min were collected using a cold trap with liquid nitrogen and determined by GC and GC-MS, as shown in Fig. 9. It was also confirmed that forming DMD was the primary route for the synthesis of IP in a one-step process over the MoP catalysts. It must be pointed out that DMD can be formed and cracked at both sites 1 and sites 2, which were thus competitive sites for those two processes. Based on the experimental data, sites 1 were more abundant prior to DMD forming, while sites 2 were more abundant prior to this for the selectivity of DMD cracking, thus it is easy to conclude that keeping the balance of sites 1 with sites 2 is key to averting the deactivation of the catalysts.
1) were employed for the synthesis of IP, as shown in Fig. 8. The mixture catalyst showed catalytic behaviour, as desired at the beginning of reaction, and the induction period was nearly eliminated. As for (2), the products from the synthesis of IP over fresh MoP C at the beginning of 4–9 min were collected using a cold trap with liquid nitrogen and determined by GC and GC-MS, as shown in Fig. 9. It was also confirmed that forming DMD was the primary route for the synthesis of IP in a one-step process over the MoP catalysts. It must be pointed out that DMD can be formed and cracked at both sites 1 and sites 2, which were thus competitive sites for those two processes. Based on the experimental data, sites 1 were more abundant prior to DMD forming, while sites 2 were more abundant prior to this for the selectivity of DMD cracking, thus it is easy to conclude that keeping the balance of sites 1 with sites 2 is key to averting the deactivation of the catalysts.
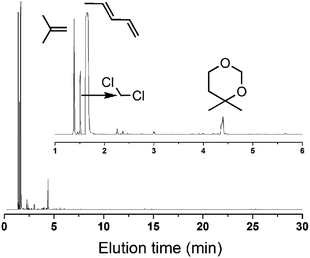 | ||
| Fig. 9 GC-MS of the products at the beginning 4–9 min (300 °C, catalyst mass is 1.5 g, iC4H8/CH2O = 7, WHSV = 10 g (g h)−1). | ||
3.4 Study of the nature of the active sites
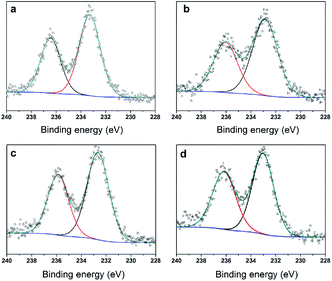
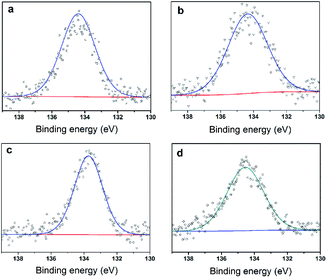
To further clarify the nature of the active sites, XPS and MAS NMR studies were conducted. Fig. 10 shows the XPS profiles of Mo 3d, while Fig. 11 shows P 2p of MoP C-y catalysts. Deconvolution of the spectra indicated two doublets at 235.28/232.08 eV (Mo6+ 3d3/2/3d5/2), which can be assigned to the high oxidation state of Mo.32–34 The profile of P 2p exhibited a peak with high binding energy (134.3 eV), which could be attributed to PO43+.35 This indicated that Mo and P on the catalyst surface were both stable and existed in the form of Mo6+ and PO43+ with TOS. With regard to the species of Mo6+, it mainly existed as a tetrahedrally coordinated [MoO4] and/or octahedrally coordinated [MoO6].36,37 This suggested that Mo–O single bonds exhibited more ionic character but C![[double bond, length as m-dash]](https://www.rsc.org/images/entities/char_e001.gif) O showed more covalent, which demonstrated that Mo–O single bonds can easily be broken.38 Moreover, the electronic density of the tetrahedrally coordinated Mo6+ species was localized on the moieties of its Mo6+ = O2− (Mo5+–O−) double bonds, which inferred that Mo
O showed more covalent, which demonstrated that Mo–O single bonds can easily be broken.38 Moreover, the electronic density of the tetrahedrally coordinated Mo6+ species was localized on the moieties of its Mo6+ = O2− (Mo5+–O−) double bonds, which inferred that Mo![[double bond, length as m-dash]](https://www.rsc.org/images/entities/char_e001.gif) O double bonds could act as the adsorption centre for nucleophilic groups or reagents, such as Oδ−
O double bonds could act as the adsorption centre for nucleophilic groups or reagents, such as Oδ−![[double bond, length as m-dash]](https://www.rsc.org/images/entities/char_e001.gif) Cδ+ of formaldehyde molecules. Furthermore, the Lewis acidity of coordinative unsaturated Mn+ sites could convert into Brönsted acidity sites for phosphate catalysts under a process involving water (Scheme 3),39,40 which was responsible for generating terminal O–H groups through water dissociation. Those unsaturated Mn+ sites can also act as the adsorption species for reagents and anchoring centres for the aldehyde molecule.41 The C 1s spectrum of the coke was also decomposed (Fig. 12), as seen through curve fitting using the binding energies of certain functional groups, C–C, C–H, C–O and C
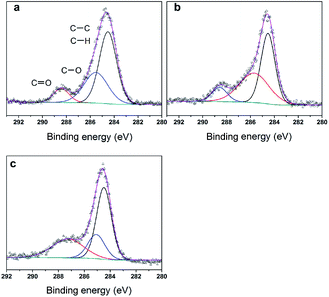
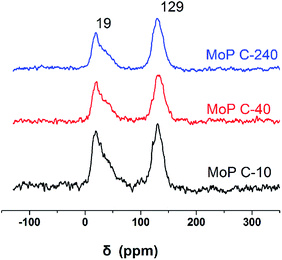
Cδ+ of formaldehyde molecules. Furthermore, the Lewis acidity of coordinative unsaturated Mn+ sites could convert into Brönsted acidity sites for phosphate catalysts under a process involving water (Scheme 3),39,40 which was responsible for generating terminal O–H groups through water dissociation. Those unsaturated Mn+ sites can also act as the adsorption species for reagents and anchoring centres for the aldehyde molecule.41 The C 1s spectrum of the coke was also decomposed (Fig. 12), as seen through curve fitting using the binding energies of certain functional groups, C–C, C–H, C–O and C![[double bond, length as m-dash]](https://www.rsc.org/images/entities/char_e001.gif) O.42,43 Those groups containing oxygen may originate from alkoxides, ethers, esters or acetals, as verified by the 13C MAS NMR peak at 129 ppm. The 13C MAS NMR display the presence of two broad features in the ranges of 12–50 ppm and 115–150 ppm, as presented in Fig. 13. The peak at 19 ppm can be attributed to olefinic carbon atoms. The olefinic carbons are most probably protonated at the acidic sites under high temperature to give working sites as C+.9,21 Furthermore, the ratio of the two peaks changed slightly with TOS, which meant the coke components changed little, which was much different from this reaction over NbP catalysts. In the induction period, there was lower selectivity due to the insufficient number of working sites of C+ because of the low carbon deposition.
O.42,43 Those groups containing oxygen may originate from alkoxides, ethers, esters or acetals, as verified by the 13C MAS NMR peak at 129 ppm. The 13C MAS NMR display the presence of two broad features in the ranges of 12–50 ppm and 115–150 ppm, as presented in Fig. 13. The peak at 19 ppm can be attributed to olefinic carbon atoms. The olefinic carbons are most probably protonated at the acidic sites under high temperature to give working sites as C+.9,21 Furthermore, the ratio of the two peaks changed slightly with TOS, which meant the coke components changed little, which was much different from this reaction over NbP catalysts. In the induction period, there was lower selectivity due to the insufficient number of working sites of C+ because of the low carbon deposition.
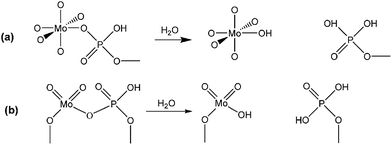 | ||
| Scheme 3 Lewis acidity of Mn+ converted into Brönsted acidity sites: (a) octahedrally coordinated Mo6+ as [MoO6], (b) tetrahedrally coordinated Mo6+ as [MoO4]. | ||
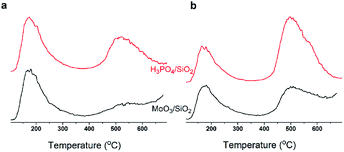
In summary, with TOS, the improving selectivity for MPD cracking (Fig. 6) with increasing carbon deposition (Fig. 4b), the decreasing P species and the little change in the Mo species on the catalysts surface (Fig. 3b) suggested that active carbonaceous species resulted in the good selectivity for MPD cracking. Considering the decreasing MPD forming, and in particular the excellent MPD yield over fresh MoP C, this implied that the Mo and P species account for the MPD forming. Therefore, Mo6+ and PO43+ gave sites 1, while active carbonaceous species gave sites 2. The increase in sites 2 accounted for the improving selectivity of C–O bond cleavage. In addition, to confirm the key role of P species for carbon deposition, the synthesis of IP from the reaction of formaldehyde with IB was conducted over H3PO4 supported on SiO2 and over MoO3 supported on SiO2. TPD curves of those two catalysts at 10 min (within the induction period) on stream and at 40 min (after the induction period) on stream are shown in Fig. 14. It can be observed that H3PO4 supported on SiO2 was more advantageous prior to carbon deposition. Moreover, the content of carbon deposition with the MoP X catalysts at 10 min on stream also confirmed this result (Fig. S4†). Consequently, carbon deposition led to the total amount of Mo6+ and PO43+ sites decreasing, which resulted in a decline in the number of sites 1.
3.5 Proposed assembly line process for the synthesis of IP
Based on all the above conclusions, a possible “assembly line” process for IP synthesis was proposed, as shown in Scheme 4. According to this process, the higher yield of SiO2 on supported H3PO4 catalysts than that on MoO3 (Table 2) can be explained by the process that carbon is deposited on P species quickly and then acts as active sites to crack DMD, which is formed on P species without carbon covering, thus the “assembly line” for IP synthesis can be more easily built on the H3PO4 catalyst. Therefore, having a desired P content on the catalysts was in favour of improving the IP yield and can shorten the induction period. This phenomenon is more evident during the induction period (Fig. 15).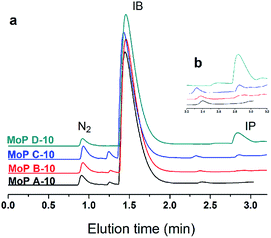 | ||
| Fig. 15 GC chromatograms at 10 min on stream (300 °C, 1.5 g of catalyst, iC4H8/CH2O = 7, WHSV = 10 g (g h)−1). | ||
4 Conclusions
In summary, MoP catalysts were synthesized for the condensation of formaldehyde with IB. It was suggested that IP was “assembly line” synthesized over MoP catalysts with the in situ growth of active carbonaceous species. The Mo and P species (acid sites) were more abundant prior to DMD forming, while carbonaceous species were more abundant prior to this for the selectivity of DMD cracking. Those carbonaceous species working as catalytic sites were primarily formed on P species in the induction period and then grew in number, which decreased the total amount of forming sites (sites 1) and increased the cracking sites (sites 2). This also led to an improvement in the catalytic capacity in the induction period, but a decline in capacity with TOS. This shows we can nearly eliminate the induction period by introducing cracking sites into fresh catalysts. It also inferred that the imbalance between the forming and cracking sites was a key reason for the catalysts activity to decline. In this work, acid sites, active species and the work of those sites were studied, and the relationship among them was established. This information will provide key insights for the design of an efficient solid catalyst for the synthesis of IP. More detailed investigations of the mechanism are under way.Conflict of interest
There are no conflicts of interest to declare.Acknowledgements
This study was supported by the National Natural Science Foundation of China [No. 51473156]; Synthetic Natural Rubber & Its Monomer Integrated Industrialization Technology-Monomer Synthesis Technology [KFZD-SW-401].Notes and references
- P. Andy, N. S. Gnep, M. Guisnet, E. Benazzi and C. Travers, J. Catal., 1998, 173, 322–332 CrossRef CAS.
- D. Chen, H. P. Rebo, K. Moljord and A. Holmen, Ind. Eng. Chem. Res., 1997, 36, 3473–3479 CrossRef CAS.
- P. L. Benito, A. G. Gayubo, A. T. Aguayo, M. Olazar and J. Bilbao, Ind. Eng. Chem. Res., 1996, 35, 3991–3998 CrossRef CAS.
- X. Zhang, Y. Wang and F. Xin, Appl. Catal., A, 2006, 307, 222–230 CrossRef CAS.
- J. Guo, H. Lou and X. Zheng, Carbon, 2007, 45, 1314–1321 CrossRef CAS.
- Q. Ming, T. Healey, L. Allen and P. Irving, Catal. Today, 2002, 77, 51–64 CrossRef CAS.
- M. Guisnet and P. Magnoux, Appl. Catal., A, 2001, 212, 83–96 CrossRef CAS.
- A. P. Rudenko, On the Role of Coke Deposits in Organic Catalysis, Actual Problems of Physical Chemistry, Moscow, 1968 Search PubMed.
- I. Ivanova, V. L. Sushkevich, Y. G. Kolyagin and V. V. Ordomsky, Angew. Chem., 2013, 125, 13199–13202 CrossRef.
- I. M. Dahl and S. Kolboe, Catal. Lett., 1993, 20, 329–336 CrossRef CAS.
- W. Song, J. F. Haw, J. B. Nicholas and C. S. Heneghan, J. Am. Chem. Soc., 2000, 122, 10726–10727 CrossRef CAS.
- U. Olsbye, S. Svelle, M. Bjørgen, P. Beato, T. V. W. Janssens, F. Joensen, S. Bordiga and K. P. Lillerud, Angew. Chem., 2012, 124, 5910–5933 CrossRef.
- U. Olsbye, S. Svelle, M. Bjørgen, P. Beato, T. V. W. Janssens, F. Joensen, S. Bordiga and K. P. Lillerud, Angew. Chem., Int. Ed., 2012, 51, 5810–5831 CrossRef CAS PubMed.
- J. A. Martens, W. Souverijns, W. Verrelst, R. Parton, G. F. Froment and P. A. Jacobs, Angew. Chem., 1995, 107, 2726–2728 CrossRef.
- Z. Da, P. Magnoux and M. Guisnet, Appl. Catal., A, 1999, 182, 407–411 CrossRef CAS.
- A. R. C. Morais, S. Dworakowska, A. Reis, L. Gouveia, C. T. Matos, D. Bogdał and R. Bogel-Łukasik, Catal. Today, 2015, 239, 38–43 CrossRef CAS.
- E. Erandeil and L. A. Mikeshka, Usp. Khim., 1954, 23, 223–230 Search PubMed.
- N. Faisca and C. C. W. Ping, Isoprene/Bioisoprene Process evaluation research planning report, 2013 Search PubMed.
- X. Yu, W. Zhu, S. Zhai, Q. Bao, D. Cheng, Y. Xia, Z. Wang and W. Zhang, React. Kinet., Mech. Catal., 2016, 117, 761–771 CrossRef CAS.
- V. L. Sushkevich, V. V. Ordomsky and I. I. Ivanova, Appl. Catal., A, 2012, 441–442, 21–29 CrossRef CAS.
- V. L. Sushkevich, V. V. Ordomsky and I. I. Ivanova, Catal. Sci. Technol., 2016, 6, 6354–6364 CAS.
- E. Dumitriu, D. Trong On and S. Kaliaguine, J. Catal., 1997, 170, 150–160 CrossRef CAS.
- E. Dumitriu, V. Hulea, I. Fechete, C. Catrinescu, A. Auroux, J.-F. Lacaze and C. Guimon, Appl. Catal., A, 1999, 181, 15–28 CrossRef CAS.
- A. Krzywicki, T. Wilanowicz and S. Malinowski, React. Kinet. Catal. Lett., 1979, 11, 399–403 CrossRef CAS.
- Z. Dang, J. Gu, L. Yu and C. Zhang, React. Kinet. Catal. Lett., 1991, 43, 495–500 CrossRef CAS.
- M. Ai, J. Catal., 1987, 106, 280–286 CrossRef CAS.
- G. Li, Y. Gu, Y. Ding, H. Zhang, J. Wang, Q. Gao, L. Yan and J. Suo, J. Mol. Catal. A: Chem., 2004, 218, 147–152 CrossRef CAS.
- A. Li-Dun, J. Zhi-Cheng and Y. Yuan-Gen, Stud. Surf. Sci. Catal., 1987, 34, 159–171 CrossRef.
- P. B. Venuto, Microporous Mater., 1994, 2, 297–411 CrossRef CAS.
- G. J. Hutchings, I. D. Hudson, D. Bethell and D. G. Timms, J. Catal., 1999, 188, 291–299 CrossRef CAS.
- E. Dumitriu, V. Hulea, T. Hulea, C. Chelaru and S. Kaliaguine, Stud. Surf. Sci. Catal., 1994, 84, 1997–2004 CrossRef CAS.
- P. Xiao, M. A. Sk, L. Thia, X. Ge, R. J. Lim, J.-Y. Wang, K. H. Lim and X. Wang, Energy Environ. Sci., 2014, 7, 2624–2629 CAS.
- X. Zhao, M. Cao, B. Liu, Y. Tian and C. Hu, J. Mater. Chem., 2012, 22, 13334–13340 RSC.
- O. G. Marin Flores and S. Ha, Appl. Catal., A, 2009, 352, 124–132 CrossRef CAS.
- J. Bai, X. Li, A. Wang, R. Prins and Y. Wang, J. Catal., 2012, 287, 161–169 CrossRef CAS.
- N. Giordano, J. C. J. Bart, A. Vaghi, A. Castellan and G. Martinotti, J. Catal., 1975, 36, 81–92 CrossRef CAS.
- G. Busca, J. Raman Spectrosc., 2002, 33, 348–358 CrossRef CAS.
- M. Matsuoka, T. Kamegawa, R. Takeuchi and M. Anpo, Catal. Today, 2007, 122, 39–45 CrossRef CAS.
- M. H. C. de la Cruz, M. A. Abdel-Rehim, A. S. Rocha, J. F. C. da Silva, A. da Costa Faro Jr and E. R. Lachter, Catal. Commun., 2007, 8, 1650–1654 CrossRef CAS.
- T. Armaroli, G. Busca, C. Carlini, M. Giuttari, A. M. Raspolli Galletti and G. Sbrana, J. Mol. Catal. A: Chem., 2000, 151, 233–243 CrossRef CAS.
- E. M. Albuquerque, L. E. P. Borges, M. A. Fraga and C. Sievers, ChemCatChem, 2017, 9, 2675–2683 CrossRef CAS.
- S. W. Park and D. G. Lee, Composites, Part A, 2010, 41, 1597–1604 CrossRef.
- X. Wen, J. Gong, H. Yu, Z. Liu, D. Wan, J. Liu, Z. Jiang and T. Tang, J. Mater. Chem., 2012, 22, 19974–19980 RSC.
Footnote |
| † Electronic supplementary information (ESI) available. See DOI: 10.1039/c7ra05078j |
| This journal is © The Royal Society of Chemistry 2017 |

