 Open Access Article
Creative Commons Attribution 3.0 Unported Licence
Microbially induced calcium carbonate precipitation driven by ureolysis to enhance oil recovery†
Jun Wu ,
Xian-Bin Wang,
Hou-Feng Wang
 and
Raymond J. Zeng*
CAS Key Laboratory for Urban Pollutant Conversion, Department of Chemistry, University of Science and Technology of China, Hefei 230026, PR China. E-mail: rzeng@ustc.edu.cn; Fax: +86 551 63600203; Tel: +86 551 63600203
First published on 28th July 2017
Abstract
The poor volumetric sweep efficiency of water and invalid cycles caused by rock layer heterogeneity are major problems in crude oil production. In this study, four pairs of columns under different conditions containing different particle sizes of sand were tested to simulate heterogeneous rock layers. The results indicated that microbially induced calcium carbonate precipitation (MICP) was more durable than bioclogging (e.g., Sporosarcina pasteurii and extracellular polymeric substances (EPS)) even in the absence of a nutrient supply. The permeability reduction due to the MICP brought oil recovery improvement from about 44% to 83% in laboratory displacement experiments. Both pH and ammonium concentration slightly increased, reaching values of approximately 9.0 and 8.5 g L−1, respectively. Permeability, an effective hydraulic indicator of pore volume, decreased from 16.0 D to 0.6 D due to plugging. The nuclear magnetic resonance (NMR) transverse relaxation time (T2) curve decreased due to the filling of voids by calcium carbonate precipitation after treatment. Moreover, the ureolysis reaction was still possible at high salinity and elevated temperature (<50 °C) despite the prolonged flow diversion period. This work further emphasizes the potential application of MICP to enhanced oil recovery (EOR).
Introduction
Renewable energy sources will comprise less than 10% of the world's requirements through 2030 despite advancements in wind, solar, water, and nuclear energy technologies.1 In short, oil will likely continue to serve as the dominant source of the world's energy throughout the near future. In oil exploitation, secondary recovery utilizes flushing by water to enhance oil recovery, but long-term water flooding generally causes poor sweep efficiency as a result of preferential flow paths. This means that while most of the water passes through regions of high permeability, carrying oil with it, the oil in low-permeability zones cannot be recovered. These factors necessitate tertiary or enhanced oil recovery (EOR), including chemically and microbially assisted methods.Microbial calcium carbonate precipitation is a common biomineralization process.2 Microbially induced calcium carbonate precipitation (MICP) generally refers to a process in which the urease secreted by microbes hydrolyzes urea to ammonium and carbon dioxide, thus causing an increase in the surrounding pH which promotes CaCO3 precipitation in calcium-rich environments.3 The reaction steps are as follows:
| CO(NH2)2 + H2O → 2NH3 + CO2 | (1) |
| NH3 + H2O → NH4+ + OH− | (2) |
| CO2 + OH− → HCO3− | (3) |
| HCO3− + Ca2+ + OH− → CaCO3 + H2O | (4) |
Overall reaction:
| CO(NH2)2 + 2H2O + Ca2+ → CaCO3 + H2O + 2NH4+ | (5) |
MICP has been successfully utilized to reduce permeability, such as in CO2 leakage reduction4,5 and sealing subsurface fractures.6,7 Harkes et al. developed a multi-step injection technique in which a bacterial suspension was introduced firstly, potentially followed by a fixation fluid before the cementation fluid was introduced, thereby enhancing fixation and distribution of bacterial cells and their enzyme activity in sand. This technique could improve the potential of MICP as ground reinforcement technique in fine-grained sand.8 In MICP, most calcium carbonate precipitates close to the inlet area that resulted in a heterogeneous calcium carbonate distribution along the column. Therefore, a homogeneous distribution of calcium carbonate was achieved by using a new injection strategy that S. pasteurii was injected first, followed by the cementation fluid (staged injection).9 In addition to laboratory scale research, field experiments applying MICP to reduce fractured rock permeability in the subsurface were performed.7 This filed study combined with a novel numerical model represents a promising application of MICP as an engineering solution to subsurface fracture sealing as well as EOR in the real world. The operational conditions, such as concentrations of bacteria solution, nutrition solution time interval of injection, effective injection rate and injection methods all affect MICP.10,11 Furthermore, other factors (e.g., medium concentration, substrate concentration, inoculum size, temperature, pH, precipitation time, and nucleating agent) also exert significant influence on the strength of MICP.12
Bioclogging usually is introduced to oil industry to enhance oil recovery based on the reduction of permeability due to microbial activity or products. Researchers have found that microorganisms and extracellular polymeric substances (EPS) can reduce permeability.13–16 Armstrong et al. used Shewanella oneidensis (MR-1) and Bacillus mojavensis (JF-2) to cause bioclogging in water-wet micromodels that showed a potential application for EOR.17 Sun et al. constructed an engineered strain based on the thermophilic Geobacillus for water-insoluble exopolysaccharide production at high temperatures, which resulted in an oil recovery of 70.4% and a water cut of 97.5% due to the bioclogging.18 A multicomponent reactive transport model was developed for the in situ biostimulation of L. mesenteroides at the reservoir scale for the production of a biopolymer dextran to allow the selective bioclogging of highly permeable zones in a realistic reservoir domain.13 Anaerobic nitrate-dependent Fe(II) oxidation can be used to form ferric hydroxide in order to plug large flow channels and thus, to enhance oil recovery.19 In our previous research, microbial self-healing gels that principally rely on the synergistic effect of calcium carbonates biomineral and EPS were designed. The strength analysis revealed the excellent performance of self-healing gel and sand-packed columns experiment showed an improvement of oil recovery from 45.37% to 88.32%.20 Even though the various researches based on MICP and bioclogging for EOR have been extensively reported, the durability of MICP compared to bioclogging (e.g., Sporosarcina pasteurii and EPS) and oil recovery under different salinity and temperature conditions remains unknown.
The goal of this study was to investigate the durability of MICP and bioclogging (e.g., Sporosarcina pasteurii and EPS) for plugging large channels and reducing permeability, thus causing the water flow through the micro-channels to increase. To this end, four pairs of columns characterized by different particle sizes of sand were designed to simulate heterogeneous rock layers. An oil-saturated recovery experiment was run on this setup to validate the effectiveness of MICP for EOR. The reduction in permeability was investigated quantitatively via nuclear magnetic resonance (NMR) measurement. Salinity and temperature in the reservoir were investigated to determine the effects of the ureolysis reaction.
Experimental
Microorganisms and cultivation
Sporosarcina pasteurii (ATCC 11859), a bacterium that secretes urease, was purchased from DSMZ (Germany). It was first grown for 12 h to the stationary phase at 30 °C with DSMZ medium 220, which consists of 15.0 g L−1 peptone from casein, 5.0 g L−1 peptone from soymeal, 5.0 g L−1 NaCl, and 20.0 g L−1 urea (Sinopharm Chemical Reagent, China). The cells were harvested by centrifugation (6000 × g, 15 min) and re-suspended in a fresh, sterile medium to an OD600 of 0.5 prior to the column experiment.Column set assembly and experimental conditions
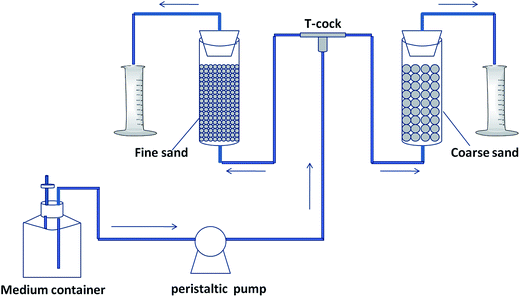
In order to demonstrate the effect of MICP on flow direction (forward or reverse) through the system, four pairs of columns (referred to from here on as “sets”) were established with the conditions described in Table 1. Each column set contained a fine sand column and a coarse sand column within a 50 mL glass column (2.84 cm in internal diameter and 8.00 cm in long) with a rubber plug (Fig. 1). The sands (Hefei Cheng Ming Environmental Protection Technology co., Ltd., China) were immersed in 3 M HCl for 12 h and then rinsed with deionized water until a neutral pH was reached prior to being loaded into the column. Gauze (32S × 32S/40 × 40) was placed on both ends of the column to prevent the sand from leaking out. The basic column parameters are displayed in Table 2. The columns were sterilized (121 °C, 20 min) and each supplied 20 mL of cell suspension (except for column set 3) followed by a 12 h period of cultivation without medium flow to facilitate cell attachment. An equal volume of deionized water was used to replace the cell suspension in column set 3. The cell suspension flowed through the coarse sand column completely when pumped through each set due to the difference in permeability between fine and coarse sands. The growth medium was prepared as described previously in detail (ESI†) with 3.0 g L−1 Difco Nutrient Broth, 10.0 g L−1 ammonium chloride (NH4Cl), 11.1 g L−1 calcium chloride (CaCl2), and 20 g L−1 urea, while the calcium-free growth medium contained all of the above reagents except for CaCl2.21 The growth medium was continuously fed into the columns at 3.75 mL h−1 with a longer peristaltic pump (BT100-1L). A measuring cylinder was used to monitor the daily volume of effluent from each column.| Column sets | Experiment condition |
|---|---|
| 1 | S. pasteurii, CaCl2, growth medium |
| 2 | S. pasteurii, CaCl2, growth medium |
| 3 | CaCl2, growth medium |
| 4 | S. pasteurii, calcium-free growth medium |
SEM, XRD, EDX characterization, and NH4+, pH analyses
The coarse sand columns were destructively sampled for characterization and analysis at the end of the experiment described above. The sand samples were cut into 8 segments of 1 cm length with a saw and labeled 1–8 from inlet to outlet. Small samples from segment 1, segment 3, and segment 5 were analyzed by scanning electron microscopy (SEM) and powder X-ray diffraction (XRD). SEM analysis was performed on a field emission SEM (TESCAN MIRA 3) equipped with an energy-dispersive X-ray spectrometer (EDAX, GENESIS APEX), operated at an acceleration voltage of 5 kV. The samples for SEM analysis were coated with a thin film of platinum prior to observation to increase their conductivity. Energy-dispersive X-ray spectroscopy (EDX) was applied for elemental composition analysis of the mineralized products. The powder X-ray diffraction patterns were recorded on a Philips X'Pert ProSuper X-ray diffractometer using graphite-monochromatized Cu Kα irradiation (λ = 0.154056 nm) and a scanning rate of 0.02°·s−1 in the 2θ range of 10 to 70°. The samples were reused for calcium carbonate distribution measurements after testing in order to minimize calcium loss. The concentration of ammonium in the effluent was determined with an Aquakem 200 (ThermoFisher Scientific, Finland) water quality autoanalyzer based on the spectrophotometry of hypochloric acid and salicylic acid reagents. The pH was monitored daily with a pH meter (Leici, China).Calcium carbonate distribution
Each of the eight segments of the sand sample was immersed in 50 mL 10% v/v HCl for 12 h prior to determining the mass of calcium carbonate distributed along the column axis in the flow direction. The Aquakem 200 water quality autoanalyzer was operated based on the Calmagite spectrophotometry method to measure the concentration of calcium,22 which was then used to calculate the amount of calcium carbonate.The calcium concentration in the influent and effluent was measured in order to calculate the amount of calcium in the influent and effluent based on volume. The amount of calcium carbonate precipitation in the columns was also determined. This allowed for the mass balance of calcium to be calculated based on the amount of calcium in the influent, effluent, and columns.
Oil recovery experiment
The oil recovery experiment was conducted with the same setup described above (Fig. 1). Twenty milliliters of machine oil (Shell Helix Ultra 5W-40) was mixed with fine sand and coarse sand, respectively, and water flooding was used to flush the oil-saturated columns at 3.75 mL h−1 until no oil was found in the effluent. All pairs of columns were flooded with sterile growth medium using a peristaltic pump after being directly injected with 20 mL of a stationary phase S. pasteurii culture. The volume of oil recovered from each pair of columns was recorded daily and measured in the measuring cylinder by adding NaCl to separate the oil–water mixture.Nuclear magnetic resonance T2 curve
The NMR transverse relaxation time (T2) curve was measured on a MiniMR-60 magnetic resonance system (Shanghai Niumag Corporation, China) using the Carr–Purcell–Meiboom–Gill (CPMG) pulse sequence.23,24 This system was equipped with a 0.3 T magnet and 12.798 MHz proton resonance frequency. Sand column samples with different flooding stages on the 0th, 3rd, 7th, and 10th days were saturated with water prior to measurement. Different T2 values reflect the varying porosity of sand columns: higher T2 value indicates higher porosity. The specific principles, techniques, and permeability applications of T2-based NMR have been described in detail elsewhere.25,26Permeability variation
Permeability was determined in a metal iron sand-packed column system (Φ25 × 300, 32 MPa, Haian Oil Scientific Instrument Co., Ltd., China). The experimental procedure was similar to that of the column experiment described above. The differential pressure was monitored for 12 h with a pressure gauge CYYZ13 (Beijing Star Sensor Technology Co., Ltd. China) set at both ends of the column. The growth medium was fed at 1 mL min−1 by a 2BP-1040 (Beijing Xingda Science and Technology Development Co., Ltd. China) constant-flux pump. The viscosity of the medium was about 1.000 × 10⁻³ Pa s. Permeability was calculated as follows based on the Darcy law:
 | (6) |
Ureolysis reaction under different salinity and temperature
NaCl and MgCl2 were chosen as examples to study the effect of salinity on the ureolysis reaction. Growth media containing different concentrations (0, 1, 5, 10, and 20 g L−1) of NaCl and uniform concentrations of MgCl2 were prepared as described in the ESI† section. S. pasteurii microorganisms were cultivated in a shaker incubator under 30 °C and 150 rpm. The effects of temperature on the ureolysis reaction were studied under 20, 30, 40, 50, and 60 °C in a shaker incubator at 150 rpm. Samples were removed at various times and the concentration of ammonium was used as an indicator of the microbial activity under each experimental condition.The effects of salinity and temperature on the system were evaluated with the same setup described above (Fig. 1). The effluent volume was recorded daily from both the coarse sand column and fine sand column.
Results
Effluent profile from each column
Water initially flowed mainly through the coarse sand column in sets 1 and 2 due to the higher porosity and permeability of the coarse sand (Fig. 2A). As more precipitation was induced by the microorganisms, the flow direction began to switch from the coarse to the fine sand on the 5th day until ultimately switching completely to the fine sand column. Almost no change was observed at any measured time in column set 3, which did not contain S. pasteurii (Table 1); the water went entirely through the coarse sand column for the duration of the experiment (Fig. 2A). Although no CaCl2 was added to column 4, the change in flow direction after 10 days was likely a result of plugging caused by the biomass and EPS. To verify this hypothesis, the nutrients were replaced with deionized water on the 15th day (black dashed line), and the water once again changed its passage from the coarse to the fine sand column in column set 4. The same phenomenon did not occur in column set 1 or set 2, however (Fig. 2A). The difference between them was that S. pasteurii stopped growing and secreting EPS when nutrients were not offered; the bioplugging by biomass and EPS ceased as a result. MICP, however, is not affected by the presence or absence of nutrients once the flow direction switches from the coarse sand column to the fine sand column.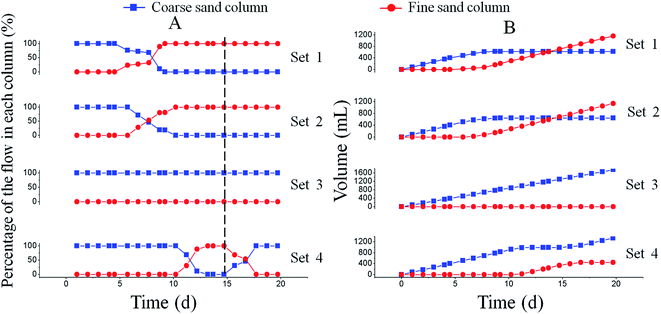 | ||
| Fig. 2 Effluent profile from each column, (A) percentage of the flow from each column (B) total effluent volume in different column sets. | ||
In set 1 and set 2, approximately 600 mL of effluent was accumulated (mainly from the coarse sand column) before the change in flow direction occurred. When the flow switched from the coarse to the fine sand column, there was no further accumulation of effluent from the coarse sand column in column set 1 and set 2 until the end of the experiment. In sets 1 and 2, the effluent from the fine sand column began to increase once the coarse sand column was plugged, finally reaching approximately 1200 mL (Fig. 2B). Conversely, in column set 3, the water volume discharged from the coarse sand column rose directly to approximately 1700 mL after 20 days and no effluent was detected from the fine sand column (Fig. 2B). Column set 4 showed similar results as column set 3 within 10 days, but once the flow direction changed due to the plugging induced by microorganisms, the volume of effluent from the coarse sand column stopped increasing. On the contrary, the effluent from the fine sand column rose to approximately 450 mL (Fig. 2B). This trend did not persist after the nutrient feed was ceased.
Ammonium concentration and pH of effluents
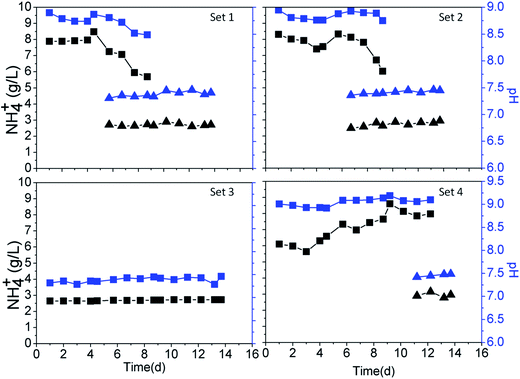
Both the ammonium concentration and the pH increased slightly at the beginning of the experiment, reaching 8.5 g L−1 and 9.0, respectively, followed by a gradual reduction in the effluents of the coarse sand columns 1, 2, and 4 (Fig. 3). These columns were distinguishable by the time at which they reached the peak value, which was the same as the time at which the flow direction was diverted (Fig. 2A). S. pasteurii remained highly active in the coarse sand column due to continuous injection of nutrients, leading to a high concentration of ammonium and a high pH before the flow direction diversion. The high concentration of ammonium caused the increase in pH, which was essential for the precipitation of calcium carbonate. There was no change in the ammonium concentration or pH in column set 3. Similarly, there was no change in any of the fine sand columns because they contained no microorganisms (Fig. 3).Distribution and mass balance of calcium carbonate
The amount of calcium carbonate was measured in the coarse sand columns 1, 2, and 3 as a function of the distance from the inlet to determine distribution of calcium carbonate. There was no precipitation in coarse column 3. The substitution of calcium carbonate with residual CaCl2 was used to calculate the calcium mass balance. The amounts of calcium carbonate precipitated at the first 3 cm were 3.80 g and 3.47 g in coarse sand columns 1 and 2, respectively, accounting for approximately 90% of the total amount of calcium carbonate (4.05 g and 3.93 g, respectively, in coarse sand columns 1 and 2) precipitated in the columns (Fig. 4). The pore space occupied by calcium carbonate was calculated according to the density (2.71 g cm−3) and mass of calcium carbonate; the volume filled by CaCO3 was only approximately 1.5 cm3 while the pore volume of the coarse sand column was 19.33 cm3 (Table 2).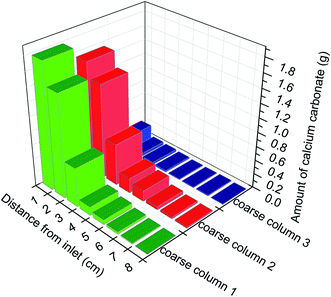 | ||
| Fig. 4 Distribution of calcium carbonate in the coarse column of each set from the inlet to the outlet. | ||
The above findings suggest that only the inlet of the column was plugged by calcium carbonate. However, precipitation mainly near the column inlet is undesirable. A relatively homogeneous distribution of CaCO3 was achieved along the flow axis in the region near the injection point of the sand-filled columns by controlling the balance between nutrient and calcium supply as well as the injection flow rate.21,28 Moreover, a two-phase injection procedure in which a bacterial suspension was injected into the sand body, immediately followed by a fixation fluid (i.e. a solution with high salt content) was developed. Therefore, bacteria (with their enzyme activity) were fixed and distributed relatively homogeneously in a sand bed to prevent clogging during injection.8 In another research, a staged injection protocol that S. pasteurii was injected first, followed by the cementation fluid, thus a homogeneous distribution of calcium carbonate precipitation was obtained. In addition, the use of nutrients was strictly avoided to prevent biomass growth and bioclogging.9 Above injection strategies were useful to make calcium carbonate precipitated over the entire length of the treated zone. A small amount of CaCl2 was retained in the coarse sand column 3 (Fig. 4). The mass balance of calcium in each coarse sand column was also calculated (Table 3). The calcium mass balance in each coarse sand column was over 90%, indicating that amount of calcium in column and effluent accounted for 90% of the influent; this was significantly higher in coarse sand column 3 than in columns 1 or 2 because the amounts of calcium in fine sand columns 1 and 2 were not taken into account.
| Set 1 | Set 2 | Set 3 | |
|---|---|---|---|
| Influent (g) | 12.38 | 12.35 | 12.08 |
| Effluent (g) | 7.78 | 7.32 | 11.65 |
| Precipitation (g) | 4.05 | 3.93 | 0.33 |
| Mass balance (%) | 95.56 | 91.09 | 99.17 |
Precipitation characteristics
At the end of the experiment, three samples were collected from coarse sand column 1 at 1 cm, 3 cm, and 5 cm away from the inlet. These samples were then characterized using SEM. A few small, rough particles were attached to a large, smooth grain (Fig. S1†). The EDX analysis, which distinguished calcium carbonate from the silicon dioxide of the sand particles, indicated that the small, rough particles were calcium carbonate while the large, smooth lump was composed of sand (Fig. S1†). (Au in the sample came from the gold sputtering process.) The amount of calcium carbonate adhered to the sand gradually decreased as the distance from the inlet increased (Fig. S2†), which was consistent with the CaCO3 distribution reported above (Fig. 4). XRD results showed that the calcium carbonate was formed as its calcite polymorph (Fig. S3†). This experiment was also conducted in the coarse sand column 2, and similar results were obtained (Fig. S3–S5†).Oil recovery performance
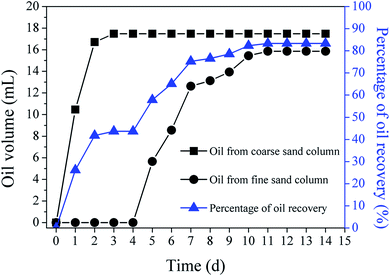
A sand column oil-saturated recovery experiment was conducted to validate the effect of MICP on the oil recovery. Almost all of the oil, i.e., 17.48 mL (20 mL in total), was recovered by water flooding through the coarse sand column in the two days prior to plugging. The percentage of oil recovered was only 43.7% of the total oil in the two columns (40 mL) (Fig. 5). After the water had been diverted from the coarse sand column to the fine sand column, the volume of oil recovered from the fine sand column began to increase on the 5th day until 15.86 mL oil was flushed out from the fine sand column on 11th day. The final percentage of oil recovery rose from 43.7% to 83.4% (Fig. 5), reflecting the benefits of MICP for enhancing oil recovery.Permeability variation and nuclear magnetic resonance T2 curve
Permeability is an effective hydraulic indicator of changes in pore volume resulting from MICP. Permeability in the samples decreased gradually for four days and then reduced sharply from 11 D to 2 D due to plugging (Fig. S6†). Approximately 8.5 days was required to reach a permeability of 0.75 D, which was lower than the permeability of the fine sand (Table 2). This was consistent with the fact that the flow changed completely from the coarse sand column to the fine sand column on the 9th day.NMR T2 curves reflecting changes in porosity were obtained in different flooding stages. As shown in Fig. 6, there were peaks around 1 ms, 10 ms, and 100–1000 ms; these peaks correspond to the micropores, mesopores, and macropores, respectively.29 The macropores had the greatest T2 value before MICP treatment, indicating that this sample had high porosity. On the 3rd day of MICP, the curve moved to the left towards smaller T2 values indicating that less water was available in the pores and reflecting lower porosity. The curves continued moving towards smaller T2 values with further MICP-related plugging on the 7th and 10th days. The signal amplitude also became weaker and weaker over time, suggesting that the portion of macropores in the sample continually decreased. There was no evident change in the micropores or mesopores, however, suggesting that the macropores were more easily plugged. These observations altogether indicate that reduction in porosity indeed resulted from the plugging of pores by calcium carbonate precipitation.
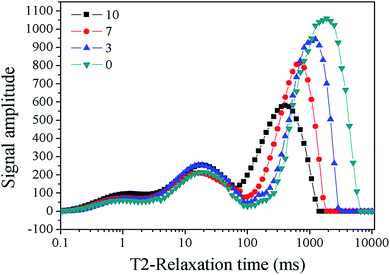 | ||
| Fig. 6 NMR T2 curve in different flooding stages after MICP treatment. 0, 3, 7, and 10 represent samples of sand columns in different flooding stages of the 0th, 3rd, 7th, and 10th day. | ||
Quantitative permeability and NMR measurements are excellent tools for gauging the effectiveness of experiments. In previous research, Sham et al. employed NMR techniques to probe the distributions of molecular displacement over a set observation time that could provide novel, non-invasive measurements and supplement conventional permeability measurements.30 In order to avoid destructive observation, a low-field NMR well-logging probe was used to monitor MICP in a sand-filled bioreactor, measuring NMR signal amplitude and T2 relaxation over an 8 day experimental period. The NMR result showed a reduction of water content in the reactor to approximately 76% of the initial value, which corresponded well to the measured reduction in porosity to approximately 88% of the typical initial value.31 Here, the effectiveness of plugging due to MICP was demonstrated by the changes in permeability and NMR T2 curve. The T2 curve results provide particularly compelling evidence of successful plugging by MICP leading to favorable permeability in the samples. Said changes in permeability explain the flow alteration also observed in the samples.
Effects of salinity and temperature on ureolysis reaction
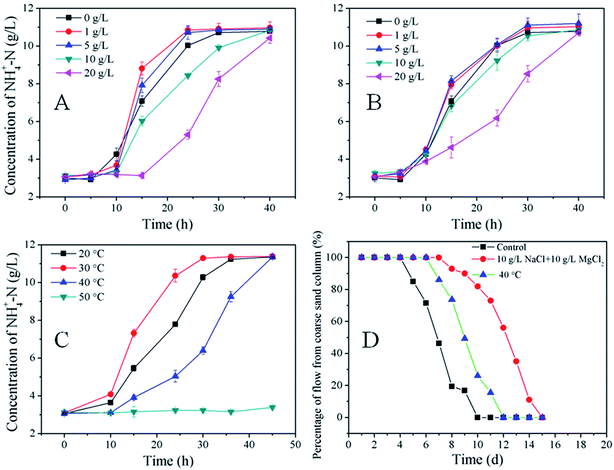
High salinities and high temperatures are common in oil reservoirs, thus it is vital to understand the effects of different salt concentrations and temperatures on ureolysis reactions. As shown in Fig. 7A, the ammonium concentration was fairly stable before 10 h regardless of NaCl concentration. The ammonium concentration was highest in the absence of NaCl at 10 h, but increased faster in 1 g L−1 and 5 g L−1 than in 0 g L−1 NaCl until the end of the experiment. Thus, supplying 1 g L−1 NaCl to the medium led to the maximum ammonium concentration. Compared to the absence of NaCl, the media containing 10 g L−1 and 20 g L−1 NaCl slowed the growth of microorganisms considerably. Ammonium concentration did not increase before 15 h when 20 g L−1 NaCl was added to the medium. At the end of the experiment (40 h), almost all urea was decomposed (based on the stoichiometric calculation, see eqn (5)) and the maximum ammonium concentration was reached for all salinities tested. Ammonium profiles for the 1 g L−1 and 5 g L−1 MgCl2 cases were similar to those of the 1 g L−1 and 5 g L−1 NaCl cases, respectively. However, when 10 g L−1 MgCl2 was used, there was no obvious difference from the 0 g L−1 MgCl2 control. Furthermore, the retardation stemming from the addition of 20 g L−1 MgCl2 was weaker than that which occurred with 20 g L−1 NaCl (Fig. 7B).High concentrations of Mg2+ and CO32− were likely responsible for the precipitation of MgCO3 due to the slight solubility of MgCO3 in water. At the end of the batch experiment, there was a layer of white precipitate in the flask. The appearance of MgCO3 was also demonstrated by XRD in a previous study on the application of seawater containing 50 mM magnesium ion in MICP.32 Reduced Mg2+ concentration in the solution due to the MgCO3 precipitation minimized any adverse effects on the microorganisms despite precipitate might have embedded some bacterial cells within it, resulting in less cells for ureolysis, thus lower ureolysis rates. Minor salinity (e.g., 1 mg L−1 NaCl in this study) promoted the growth of microorganisms; high NaCl concentration brought on more adverse effects than MgCl2. High salinity adversely affected metabolism, however, which may impede the practical application of MICP.
The ureolysis reaction was studied at 20, 30, 40, and 50 °C. As shown in Fig. 7C, S. pasteurii at 30 °C showed higher activity than at 20 °C or 40 °C, and no obvious change in ammonium was observed at 50 °C after 45 h of cultivation. The batch test results showed that S. pasteurii cannot survive at 50 °C. MICP is driven by the urease secreted by microorganisms, and urease is stable even at 80 °C,33 so a treatment strategy in which urease is produced “above ground” and then injected into the reservoir may yet be practical in high-temperature oil reservoirs.6
A mixture of salts (10 g L−1 NaCl and 10 g L−1 MgCl2) and 40 °C was also used to test the effect of salinity and temperature in the column system. An experiment with no salt addition and 30 °C served as the control. As shown in Fig. 7D, more time was needed to reach the flow direction turning point and to achieve complete flow diversion from the coarse to the fine sand column under higher salinity. It took two more days to achieve the same result under 40 °C compared to the control. To this effect, elevated salinity and temperature may prolong the time required for precipitation when applying this technique to real-world reservoirs.
Discussion
The MICP-based method described here showed several advantages in regards to plugging macro-voids to promote flow through micro-channels while flushing oil out from micro-channels. It took only four days for the S. pasteurii to cause visible flow alteration after the start of the nutrient feed; this is much less time than it took in a parallel study by Zhu et al.19 on anaerobic nitrate-dependent Fe(II) oxidation for EOR, though our oil recovery percentage was nearly the same. More nutrients were required for anaerobic microorganisms (Acidovorax ebreus, a nitrate dependent Fe(II) oxidizer) to induce Fe(II) oxidation, driving up the higher costs of operation. Biomass (i.e., microorganisms and EPS) can also be used as plugging agents in the proposed setup. In a similar study, biomass was used to achieve plugging in a porous medium consisting of glass beads with an average diameter of 300 mm; the plugging mechanism exhibited an exopolymer-induction phase, plugging phase, and plug-propagation phase.16 Lappan et al.34 used Leuconostoc mesenteroides cultures and dextran production to reduce the permeability of porous media (sand packs) in situ. However, as observed here in column set 4, if nutrients are not fed continuously to support the microorganisms in precipitating calcium carbonate, the benefits of this process are not long-lasting and the method becomes too expensive to practically operate. Again, this problem can be solved by using MICP.Polymer flooding is another effective method to enhance oil recovery by improving sweep efficiency while reducing the apparent viscosity and adsorptive capacity of oil.35 Unfortunately, it shows poor shear resistance and high operation costs. The calcium carbonate produced by MICP, conversely, is not affected by external shear forces after its formation. Further, like Bacillus subtilis and Pseudomonas aeruginosa, the bio-surfactant secreted by S. pasteurii can emulsify crude oil and reduce the surface tension between the oil and the surrounding rock, which is very beneficial for EOR.36,37
pH is a key factor for the precipitation, and also for bacterial growth and EPS production. On the one hand, the produced ammonia leads to the pH increase, but the dissolved CO2, as a form of CO32− or HCO3−, not only precipitates as part of calcite but also functions as buffer slowing down the pH increase as ammonia is produced from urea hydrolysis. On the other hand, the pH can affect the growth of S. pasteurii as well as urease activity from the cell, and the enzyme activity keeps high at pH around 8.0.38 High pH is required for the growth of S. pasteurii as it enhances the transport of essential nutrients and growth factors across the cell membrane.39
It is of significance to understand the transport and growth of bacteria in the porous media. Some influential factors that control the transport and fate of bacteria have been investigated in previous investigations, such as cell properties (e.g., cell size and morphology, hydrophobicity or charge of the cell surface), solution composition, the presence of particle coatings, flow velocities, and grain size.40–42 In terms of S. pasteurii, a well understanding of how it is transported through porous systems can effectively avoid the precipitation near the injection area. Tobler et al. studied the transport of S. pasteurii in sandstone and the results indicated that core length, bacterial density and flow rate all exerted important influence on the transport. Moreover, the comparison of transport of S. pasteurii in sandstone and sand pack column showed discrepancies even though they exhibited similar porosity and permeability.43 Therefore, further investigations are needed to understand the transport process of S. pasteurii so as to apply MICP to the subsurface in the real world.
An experimental setup constructed with a course sand column and fine sand column was utilized to simulate high-permeability formations and low permeability rock layers in this study. Similar setups also were found in the previous researches.19,44 There was an important limitation to this setup: that the coarse and fine sand columns were separated. In real-world oil reservoirs, the heterogeneous subsurface rock layers are composed of cross bedding and thus high- and low-permeability formations are mixed. In this sense, the experimental setup in this study is not perfectly reasonable and merits further optimization. For example, a combination of coarse sand and fine sand could be distributed in different layers in one column to more closely mimic its real-world counterpart. In addition, the porous media also affected the distribution of calcium carbonate and very homogeneous calcium carbonate precipitation was observed in the sandstone rock core with a reduction in overall porosity and permeability.30 Therefore, the replacement of sand beads with sandstone rock will be more meaningful.
Certainly, the injection of CaCl2 mineralising growth media (containing 3 g L−1 nutrient broth) into a real oil reservoir may result in some problems. Firstly, high cost must be taken into consideration if the media are injected in large-scale. Secondly, the contamination brought by the media to underground water cannot be ignored. Last but not least, adding nutrients to such a system, may actually lead to quite substantial growth of other bacteria, thud some undesirable bioclogging may occur. Such a bioclogging can shorten wellbore life and potentially inhibit oil mobilization.45 Therefore, large-scale injection of growth media into an oil reservoir may not be feasible. More studies need to be performed to improve MICP, for example, selective plugging the pores by immobilization of urea enzyme.
The precipitation of calcium carbonate was rather robust in this study compared with that of the biomass. Certain problems attributable to MICP are important to consider here, however – the contamination of underground water by ammonium could be especially problematic if this method was applied to petroleum production on a large scale.
Conclusions
In this study, a column experiment was conducted under different conditions to find that MICP was more durable than bioclogging once the switch of flow direction occurred even in the absence of a nutrient supply. Oil recovery was improved from 44% to 83% via MICP due to the switch of flow from the coarse sand column to fine sand column. The distribution of CaCO3 indicated that precipitation occurred mostly within the first 3 cm of entrance, which is not desirable in terms of practical application. There was a sharp reduction in permeability due to the plugging that contributed to the diversion of flowing water from the coarse to the fine sand column. The ureolysis reaction was still possible under high salinity and fairly high temperature (<50 °C) conditions despite the prolonged flow diversion period. Taken together, the results of this study suggest that MICP is a promising approach to next-generation EOR applications.Acknowledgements
This study received financial support from the Petro China Innovation Foundation (2014D-5006-0205), the Collaborative Innovation Center of Suzhou Nano Science and Technology, the Program for Changjiang Scholars and Innovative Research Team in University, and the Fundamental Research Funds for the Central Universities.References
- J. P. Dorian, H. T. Franssen and D. R. Simbeck, Energy Policy, 2006, 34, 1984–1991 CrossRef.
- E. Boquet, A. Boronat and A. Ramoscor, Nature, 1973, 246, 527–529 CrossRef.
- A. C. Mitchell, K. Dideriksen, L. H. Spangler, A. B. Cunningham and R. Gerlach, Environ. Sci. Technol., 2010, 44, 5270–5276 CrossRef CAS PubMed.
- A. B. Cunningham, R. Gerlach, L. Spangler, A. C. Mitchell, S. Parks and A. Phillips, Energy Procedia, 2011, 4, 5178–5185 CrossRef CAS.
- A. J. Phillips, E. Lauchnor, J. Eldring, R. Esposito, A. C. Mitchell, R. Gerlach, A. B. Cunningham and L. H. Spangler, Environ. Sci. Technol., 2013, 47, 142–149 CrossRef CAS PubMed.
- A. J. Phillips, A. B. Cunningham, R. Gerlach, R. Hiebert, C. C. Hwang, B. P. Lomans, J. Westrich, C. Mantilla, J. Kirksey, R. Esposito and L. Spangler, Environ. Sci. Technol., 2016, 50, 4111–4117 CrossRef CAS PubMed.
- M. O. Cuthbert, L. A. McMillan, S. Handley-Sidhu, M. S. Riley, D. J. Tobler and V. R. Phoenix, Environ. Sci. Technol., 2013, 47, 13637–13643 CrossRef CAS PubMed.
- M. P. Harkes, L. A. van Paassen, J. L. Booster, V. S. Whiffin and M. C. M. van Loosdrecht, Ecol. Eng., 2010, 36, 112–117 CrossRef.
- D. J. Tobler, E. Maclachlan and V. R. Phoenix, Ecol. Eng., 2012, 42, 270–278 CrossRef.
- L. Cheng and M. A. Shahin, Can. Geotech. J, 2016, 53, 1376–1385 CrossRef CAS.
- N. K. Dhami, M. S. Reddy and A. Mukherjee, Constr. Build. Mater., 2016, 104, 198–207 CrossRef CAS.
- Z. Wang, N. Zhang, G. Cai, Y. Jin, N. Ding and D. Shen, Mar. Georesour. Geotechnol., 2017, 1–12 Search PubMed.
- V. K. Surasani, L. Li, J. B. Ajo-Franklin, C. Hubbard, S. S. Hubbard and Y. X. Wu, Energy Fuels, 2013, 27, 6538–6551 CrossRef CAS.
- C. C. Ezeuko, A. Sen, A. Grigoryan and I. D. Gates, Biotechnol. Bioeng., 2011, 108, 2413–2423 CrossRef CAS PubMed.
- M. Thullner, Ecol. Eng., 2010, 36, 176–196 CrossRef.
- T. L. Stewart and H. S. Fogler, Biotechnol. Bioeng., 2001, 72, 353–363 CrossRef CAS PubMed.
- R. T. Armstrong and D. Wildenschild, J. Pet. Sci. Eng., 2012, 94–95, 155–164 CrossRef CAS.
- S. S. Sun, Y. J. Luo, S. Y. Cao, W. H. Li, Z. Z. Zhang, L. X. Jiang, H. P. Dong, L. Yu and W. M. Wu, Bioresour. Technol., 2013, 144, 44–49 CrossRef CAS PubMed.
- H. Zhu, H. K. Carlson and J. D. Coates, Environ. Sci. Technol., 2013, 47, 8970–8977 CAS.
- J. Wu, H. F. Wang, X. B. Wang, H. Y. Yang, R. Y. Jiang and R. J. Zeng, RSC Adv., 2017, 7, 2578–2586 RSC.
- A. B. Cunningham, R. Gerlach, L. Spangler, A. C. Mitchell, S. Parks and A. Phillips, Enrgy. Proced, 2011, 4, 5178–5185 CAS.
- F. Ingman and A. Ringbom, Microchem. J., 1966, 10, 545–553 CrossRef CAS.
- H. Y. Carr and E. M. Purcell, Phys. Rev., 1954, 94, 630–638 CrossRef CAS.
- S. Meiboom and D. Gill, Rev. Sci. Instrum., 1958, 29, 688–691 CrossRef CAS.
- E. H. Rios, I. Figueiredo, A. K. Moss, T. N. Pritchard, B. A. Glassborow, A. B. G. Domingues and R. B. D. Azeredo, Geophys. J. Int, 2016, 206, 260–274 CrossRef.
- M. D. Hurlimann, L. Venkataramanan and C. Flaum, J. Chem. Phys., 2002, 117, 10223–10232 CrossRef CAS.
- A. Prada and F. Civan, J. Pet. Sci. Eng., 1999, 22, 237–240 CrossRef CAS.
- A. Ebigbo, A. Phillips, R. Gerlach, R. Helmig, A. B. Cunningham, H. Class and L. H. Spangler, Water Resour. Res., 2012, 48 DOI:10.1029/2011WR011714.
- S. Li, D. Z. Tang, H. Xu, Z. Yang and L. L. Guo, Energ. Fuel, 2012, 26, 5005–5014 CrossRef CAS.
- E. Sham, M. D. Mantle, J. Mitchell, D. J. Tobler, V. R. Phoenix and M. L. Johns, J. Contam. Hydrol., 2013, 152, 35–43 CrossRef CAS PubMed.
- C. M. Kirkland, S. Zanetti, E. Grunewald, D. O. Walsh, S. L. Codd and A. J. Phillips, Environ. Sci. Technol., 2017, 51, 1537–1543 CrossRef CAS PubMed.
- L. Cheng, M. A. Shahin and R. Cord-Ruwisch, Geotechnique, 2014, 64, 1010–1013 CrossRef.
- V. S. Whiffin, PhD thesis, Murdoch University, 2004.
- R. E. Lappan and H. S. Fogler, Biotechnol. Bioeng., 1996, 50, 6–15 CrossRef CAS PubMed.
- N. Lai, X. Qin, Z. Ye, C. Li, K. Chen and Y. Zhang, J. Pet. Sci. Eng., 2013, 112, 198–205 CrossRef CAS.
- E. J. Gudina, J. F. B. Pereira, R. Costa, J. A. P. Coutinho, J. A. Teixeira and L. R. Rodrigues, J. Hazard. Mater., 2013, 261, 106–113 CrossRef CAS PubMed.
- X. Tang, Y. Zhu and Q. Meng, World J. Microbiol. Biotechnol., 2007, 23, 7–14 CrossRef CAS.
- S. Stocks-Fischer, J. K. Galinat and S. S. Bang, Soil Biol. Biochem., 1999, 31, 1563–1571 CrossRef CAS.
- W. R. Wiley and J. L. Stokes, J. Bacteriol., 1963, 86, 1152–1156 CAS.
- M. W. Becker, S. A. Collins, D. W. Metge, R. W. Harvey and A. M. Shapiro, J. Contam. Hydrol., 2004, 69, 195–213 CrossRef CAS PubMed.
- D. Ding, Hydrogeol. J., 2010, 18, 669–679 CrossRef CAS.
- C. Stumpp, J. R. Lawrence, M. J. Hendry and P. Maloszewski, Environ. Sci. Technol., 2011, 45, 2116–2123 CrossRef CAS PubMed.
- D. J. Tobler, M. O. Cuthbert and V. R. Phoenix, Appl. Geochem., 2014, 42, 38–44 CrossRef CAS.
- M. Nemati, E. A. Greene and G. Voordouw, Process Biochem., 2005, 40, 925–933 CrossRef CAS.
- D. Wildenschild, 56th Annual Report on Research, Under Sponsorship of the ACS Petroleum Research Fund, 2011 Search PubMed.
Footnote |
| † Electronic supplementary information (ESI) available. See DOI: 10.1039/c7ra05748b |
| This journal is © The Royal Society of Chemistry 2017 |

