 Open Access Article
Creative Commons Attribution 3.0 Unported Licence
An antimalarial drug, tafenoquine, as a fluorescent receptor for ratiometric detection of hypochlorite†
Avijit Kumar Dasa,
Naoto Hayashia,
Yasuhiro Shiraishi *ab and
Takayuki Hiraia
aResearch Center for Solar Energy Chemistry, Division of Chemical Engineering, Graduate School of Engineering Science, Osaka University, Toyonaka 560-8531, Japan. E-mail: shiraish@cheng.es.osaka-u.ac.jp
bPrecursory Research for Embryonic Science and Technology (PRESTO), Japan Science and Technology Agency (JST), Saitama 332-0012, Japan
First published on 13th June 2017
Abstract
Tafenoquine (TQ), a fluorescent antimalarial drug, was used as a receptor for the fluorometric detection of hypochlorite (OCl−). TQ itself exhibits a strong fluorescence at 476 nm, but OCl−-selective cyclization of its pentan-1,4-diamine moiety creates a blue-shifted fluorescence at 361 nm. This ratiometric response facilitates rapid, selective, and sensitive detection of OCl− in aqueous media with physiological pH. This response is also applicable to a simple test kit analysis and allows fluorometric OCl− imaging in living cells.
Introduction
Hypochlorous acid (HOCl) is one of the most biologically important reactive oxygen species (ROS).1 Its deprotonation at a physiological pH produces hypochlorite anions (OCl−),2 which act as a microbicidal agent in the immune system.3 OCl− is produced in vivo by the reaction of hydrogen peroxide (H2O2) and Cl− on myeloperoxidase (MPO), a heme enzyme expressed in activated leukocytes.4 Controlled OCl− generation is necessary to inhibit the invading microbes, although OCl− also reacts with several biomolecules such as amino acids, proteins, and nucleosides.5 In contrast, uncontrolled OCl− generation causes several diseases such as neuron degeneration, arthritis, and cancer.6 Analytical methods that quantitatively detect OCl− and allow visual imaging of OCl− in biological samples by simple pre-treatment and inexpensive instrumentation are therefore necessary.Fluorometric analysis with OCl−-selective receptor is one promising method for this purpose since this facilitates simple quantification or imaging of OCl− with a common fluorescence spectrometer or microscope.7 A number of fluorescent receptors for OCl− have been proposed;8 however, many of them show single-wavelength emission whose intensity is strongly affected by several factors (instruments and receptor concentrations). In contrast, ratiometric receptors, which show a new emission in addition to the inherent one by the interaction with OCl−, is more attractive because they allow simple quantification just by monitoring the intensities of two emissions, where the effects of several factors can be eliminated. There are, however, a few reports of ratiometric OCl− receptors.9 Exploitation of new receptor is therefore a challenge.
Tafenoquine (TQ) is a commercially-available antimalarial drug,10 one derivative of a representative antimalarial drug, primaquine (PQ),11 as shown in Scheme 1. TQ shows higher antimalarial activity than PQ12 and has attracted increasing attention because it is also effective for the treatment of Leishmaniasis, a disease caused by protozoan parasites.13 It is also reported that TQ produces some mitochondrial ROS in vivo such as superoxide anion (O2−), H2O2, hydroxide (OH−), and OCl−, which leads to apoptosis-like death of Leishmania.14 In addition, TQ inherently shows a strong fluorescence due to its quinoline platform. The strong fluorescence, high water solubility, high cell permeability, and high ROS tolerance of TQ are the ideal properties for fluorometric ROS sensing.
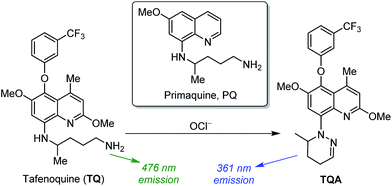 | ||
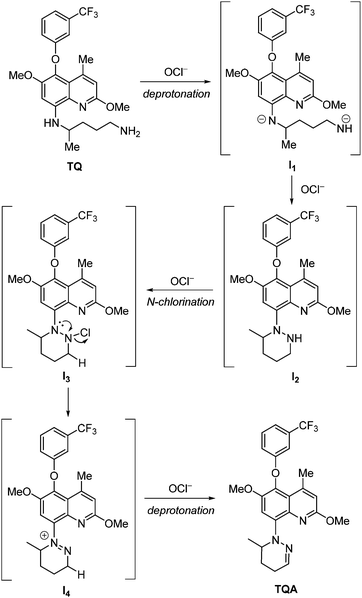
| Scheme 1 Structures of 8-aminoquinoline-based antimalarial drugs, and proposed mechanism for OCl−-induced fluorescence response of TQ. | ||
Here we report that TQ behaves as a ratiometric fluorescent receptor for OCl− detection. The TQ itself exhibits a strong cyan fluorescence at 476 nm. Selective reaction of TQ with OCl− leads to cyclization of its pentan-1,4-diamine moiety (Scheme 1). This creates a new blue-shifted emission at 361 nm, while decreasing the original 476 nm emission. This ratiometric response facilitates rapid, selective, and sensitive detection of OCl− in solution and allows OCl− imaging in living cells. This is the first report of TQ for application to sensory material.
Results and discussion
Fluorescence properties of TQ
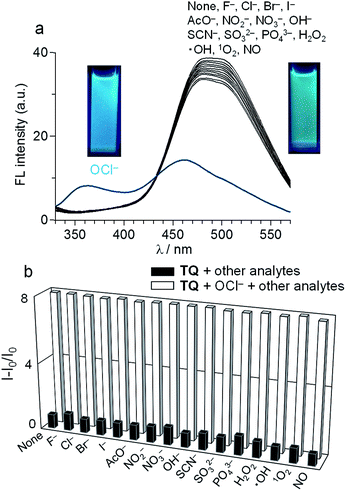
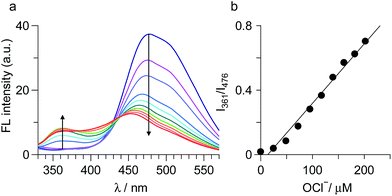
TQ was obtained by neutralization of commercially-available succinate salt of tafenoquine with Na2CO3 as brown solids with 83% yield. Its purity was confirmed by 1H, 13C NMR and ESI-MS analysis (Fig. S1–S3, ESI†). The fluorescence response of TQ was studied in a buffered water/MeCN (3/7 v/v) mixture with pH 7.4 (HEPES 0.1 M) at 25 °C (λex = 300 nm). As shown in Fig. 1a, TQ itself (20 μM) exhibits a strong fluorescence at 476 nm. Upon addition of 100 equiv. of OCl− to the solution, a blue-shifted fluorescence appears at 361 nm (Δλ = 115 nm), along with a decrease in the original 476 nm emission. To clarify the specific nature of TQ towards OCl−, effect of other typically encountered oxidative species such as F−, AcO−, Cl−, Br−, I−, NO2−, NO3−, SO32−, PO43−, OH−, H2O2, SCN−, hydroxyl radical (˙OH), singlet oxygen (1O2), and NO was studied. As summarized in Fig. 1a, these species, when added to a solution containing TQ, scarcely change the fluorescence spectrum. This indicates that OCl− selectively changes the fluorescence of TQ. It must also be noted that, as shown in Fig. 1b, the OCl−-induced fluorescence change is unaffected by the addition of these competing oxidative species. These findings clearly suggest that TQ selectively detects OCl− in aqueous media even in the presence of these competing species.Fig. 2a shows the results of fluorescence titration of TQ with OCl−. Stepwise addition of OCl− creates a blue-shifted 361 nm emission together with a decrease in the 476 nm emission, with an isoemission point at 435 nm. This indicates that the reaction of TQ with OCl− produces single component exhibiting the 361 nm emission. The fluorescence quantum yield of TQ is Φ = 0.39, while addition of 100 equiv. OCl− decreases to Φ = 0.16. Fig. 2b shows the change in the ratio of emission intensities (I361/I476) with the OCl− concentrations. The lower detection limit is determined to be 2.0 μM based on the signal-to-noise (S/N) ratio using the equation (DL = 3 × SD/S),15 where SD is the standard deviation of blank analysis (SD = 2.4 × 10⁻³, n = 8) and S is the slope of the intensity versus the OCl− concentrations (S = 3.7 × 10⁻³ μM−1). This detection limit is lower than the physiological OCl− concentrations (5–25 μM) in the human body,16 suggesting that TQ facilitates sensitive OCl− detection. It must also be noted that TQ detects OCl− very rapidly. Fig. S4 (ESI†) shows the time-dependent change in the fluorescence intensity of TQ after addition of OCl−. The intensity change occurs immediately after OCl− addition and almost terminates within 1 min, suggesting that only 1 min assay is enough for OCl− sensing as is the case for previously reported receptors.9 It is also noted that, as shown in Fig. S5 (ESI†), increase in the water content of solution decreases the intensity of OCl−-induced 361 nm emission; however, the intensity obtained with 90% water is ca. 50% as compared to the intensity obtained with 30% water. This indicates that TQ facilitates OCl− sensing even in high water content solution.
Reaction of TQ with OCl−
As shown in Scheme 2, the ratiometric emission response of TQ upon addition of OCl− is ascribed to the transformation to TQA, via a formation of six-membered pyridiazine (1,2-diazine) ring by cyclization of the pentan-1,4-diamine moiety of TQ. This occurs based on basic and oxidizing properties of OCl−. The OCl− remove acidic protons of amine groups of TQ and give an anionic intermediate (I1). Subsequent oxidative intramolecular coupling of the intermediate via an N–N bond formation17 by OCl− gives an azine-type intermediate (I2). Reaction of its azine nitrogen with OCl− produces an N-chlorinated intermediate (I3). Elimination of Cl− by an α-effect of lone pair on the adjacent nitrogen of hydrazino group gives a cyclic diazonium cation intermediate (I4). This then undergoes elimination of acidic β-hydrogen by OCl− and produces TQA. The formation of TQA was clearly supported by 1H and 13C NMR and EI-MS analysis (Fig. S6–S8, ESI†). These findings indicate that the OCl−-induced transformation of TQ to TQA results in ratiometric fluorescence response (Fig. 2a).It must be noted that pH of the solution is an important factor for OCl− sensing by TQ. As shown in Fig. S9 (ESI†), the 361 nm fluorescence does not appear in acidic media (pH < 7) or basic media (pH > 10) even upon addition of OCl−. In acidic media, protonation of OCl− (HOCl ⇄ H+ + OCl−; pKa = 7.6)18 decreases the basicity of OCl− and, hence, suppresses the deprotonation step (TQ → I1). In contrast, basic media stabilize OCl−, but suppress the oxidation step (I1 → I2). Therefore, fluorometric sensing of OCl− using TQ is enabled in physiological pH media (7–10).
Mechanism for fluorometric response
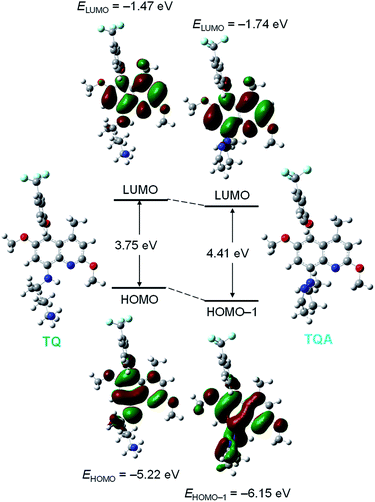
TQ itself shows a strong fluorescence at a relatively longer wavelength (476 nm). This is ascribed to the electron donation from the secondary amine group at the 8-position to the electron deficient quinoline moiety. Upon addition of OCl−, the resulting TQA shows a blue-shifted fluorescence at 361 nm. This is because the cyclization of the pentan-1,4-diamine moiety of TQ transforms the secondary amine moiety to the tertiary one, which has lower electron donation ability. This thus creates a blue-shifted emission.To confirm the above mechanism for ratiometric emission response, ab initio calculations based on the density functional theory (DFT) were performed within the Gaussian 03 program. As shown in Table S1 (ESI†), singlet electronic transition of TQ mainly consists of HOMO → LUMO (S0 → S1) transition. Its calculated transition energy (3.25 eV, 381 nm) is close to the absorption maximum (λmax) of TQ observed at 375 nm (Fig. S10, ESI†). As shown in Fig. 3 (left), π-electrons of LUMO for TQ lie not only on the quinoline ring but also on the adjacent nitrogen atom at the 8-position. This suggests that strong electron donation from the secondary amine moiety of TQ to the quinoline moiety at the excited state creates longer-wavelength fluorescence at 476 nm.
In the case of TQA, its singlet electronic transition is mainly contributed by HOMO−1 → LUMO (S0 → S3) transition (Table S2, ESI†). Its calculated transition energy (3.84 eV, 322 nm) is close to λmax of TQA (357 nm; Fig. S10, ESI†). As shown in Fig. 3 (right), π-electrons of LUMO for TQA lie mainly on the quinoline moiety, where the electrons are scarcely distributed on the nitrogen atom at the 8-position. These results indicate that TQ shows longer-wavelength fluorescence due to the electron donation from the secondary amine moiety; the cyclization of its pentan-1,4-diamine moiety by OCl− suppresses the electron donation and exhibits blue-shifted fluorescence.
Test kit analysis
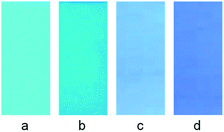
Prompted by high sensitivity and selectivity of TQ towards OCl−, simple test strip kit loaded with TQ was prepared for practical applications.19 The test strips were prepared by immersing a TLC plate (3 × 1 cm) into the TQ solution (200 μM, 5 mL) for 2 min followed by drying in vacuo for 12 h. The TQ-loaded test strips were added to solutions with different OCl− concentrations for 2 min. The obtained strips were then photoirradiated with a 365 nm UV lamp. As shown in Fig. 4, these test strips clearly change their fluorescence color with the OCl− concentrations. The test strip kit is therefore an useful qualitative tool for simple OCl− analysis.Cell imaging
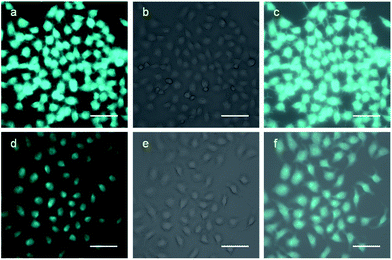
To clarify the cell permeability of TQ and its applicability for practical imaging of OCl− in living cells, biological experiments were performed using HeLa cells. The cells were incubated with TQ (40 μM) in DMSO at 37 °C under humidified air containing 5% CO2, and washed with phosphate buffered saline (PBS). A PBS containing 10 mM of OCl− was added to the cells, and the cells were incubated for 20 min. The cells were then washed with PBS, and their images were obtained by a fluorescence microscope. As shown in Fig. 5a, the cells incubated with TQ, when photoexcited at λex = 360 nm, show strong fluorescence. However, as shown in Fig. 5d, the emission intensity is weakened significantly by the addition of OCl− to the sample. These results clearly indicate that TQ successfully permeates through the plasma membrane of the cells and exhibits a fluorescence response toward OCl− even in the living cells.Conclusion
We demonstrated that an antimalarial drug, tafenoquine (TQ), behaves as a fluorescent receptor for ratiometric OCl− detection. TQ shows strong fluorescence at 476 nm, but OCl−-selective cyclization of its pentan-1,4-diamine moiety creates a blue-shifted emission at 361 nm. This ratiometric response facilitates rapid, selective, and sensitive detection of OCl− in aqueous media with physiological pH. This response is also applicable to a simple test kit analysis and allows fluorometric OCl− imaging in living cells. The basic receptor design presented here based on the tafenoquine platform with high fluorescence quantum yield, high water solubility, high cell permeability, and high ROS tolerance may contribute to the design of more efficient fluorescent receptor for OCl−.Experimental
Materials and methods
All chemicals were used as received. ˙OH was generated by the Fenton reaction.20 1O2 was generated from the H2O2/MoO42− system in alkaline media.21 NO was generated using sodium nitroferricyanide(III) dihydrate.22 1H and 13C NMR charts were recorded on a JEOL JNM-ECS400 spectrometer with CDCl3 using TMS as a standard. Mass analysis was performed on a JEOL JMS700 Mass Spectrometer. Absorption spectra were measured on an UV-visible photodiode-array spectrometer (Shimadzu; Multispec-1500) equipped with a temperature controller (S-1700).23 Fluorescence spectra were measured on a JASCO FP-6500 fluorescence spectrophotometer with a 10 mm path length cell (both excitation and emission slit widths, 5.0 nm) at 298 ± 1 K using a temperature controller.24 The pH titration was performed on Horiba pH Meter F-71. Fluorescence quantum yield (ΦF) was determined with Rhodamine B (in EtOH) as a standard.25Synthesis of TQ
Tafenoquine succinate salt (0.3 g, 0.52 mmol) was added to a water/CH2Cl2 (6/6 mL mL−1) mixture. Water (6 mL) containing sodium carbonate (0.1 g, 0.94 mmol) was added to the mixture, and the mixture was stirred for 2 h at room temperature. The aqueous phase was extracted with CH2Cl2 (10 mL × 3). The combined organic phases were washed with water and concentrated by evaporation, affording TQ as brown solid (200 mg, yield 83%). 1H NMR (300 MHz, CDCl3, TMS) δ (ppm): 7.32 (q, 1H, J = 18 Hz), 7.21 (d, 1H, J = 6 Hz), 7.07 (s, 1H), 6.94 (d, 1H, J = 6 Hz), 6.64 (s, 1H), 6.50 (s, 1H), 5.84 (d, 1H, J = 6 Hz), 4.00 (s, 3H), 3.79 (s, 3H), 3.66 (s, 1H), 2.78 (d, 2H, J = 6 Hz), 2.55 (s, 3H), 1.69 (dd, 6H, J = 6 Hz, J = 9 Hz), 1.35 (d, 3H, J = 6 Hz). 13C NMR (100 MHz, CDCl3, TMS) δ (ppm): 159.64, 148.961, 146.339, 142.010, 132.085, 131.760, 131.007, 129.968, 126.917, 125.344, 122.636, 120.681, 118.006, 115.256, 112.052, 94.996, 56.989, 52.870, 48.446, 42.248, 34.439, 30.130, 23.103, 20.833. MS (m/z): M+ calcd for C24H28F3N3O3: 463.2083; found (ESI): 464.17 (M + H)+.Synthesis of TQA
TQ (0.2 g, 0.43 mmol) was dissolved in MeCN (50 mL) by vigorous stirring. Sodium hypochlorite (64 mg, 0.86 mmol) was added to the solution, and the solution was stirred at room temperature. The progress of the reaction was monitored with a TLC plate. After the reaction, MeCN was removed by evaporation, and the gummy product was purified by column chromatography using AcOEt/n-hexane (1/9 v/v) as an eluent, affording brown powders of TQA (130 mg, yield 65%). 1H NMR (400 MHz, CDCl3, TMS) δ (ppm): 7.438 (s, 1H), 7.284 (d, 1H, J = 6.4 Hz), 7.221 (m, 1H), 7.063 (s, 1H), 6.911 (m, 1H), 6.753 (s, 1H), 4.946 (q, 1H, J = 6.4 Hz), 3.999 (s, 3H), 3.787 (s, 3H), 3.728 (d, 1H, J = 1.2 Hz), 2.589 (s, 3H), 2.547 (s, 1H), 2.391 (t, 1H, J = 12.8 Hz), 2.302 (t, 1H, J = 4 Hz), 1.865 (d, 1H, J = 3.6 Hz), 0.992 (t, 3H, J = 6.8 Hz). 13C NMR (100 MHz, CDCl3, TMS) δ (ppm): 159.649, 159.011, 147.760, 146.196, 142.458, 138.797, 135.765, 133.677, 132.142, 130.936, 130.016, 121.329, 118.221, 115.422, 112.090, 111.809, 99.247, 56.598, 52.975, 50.677, 24.752, 23.255, 20.309, 13.959. MS (m/z): M+ calcd for C24H24F3N3O3: 459.177; found (EI+): 459.Calculation details
Ab initio calculations were performed with tight convergence criteria at the DFT level with the Gaussian 03 package, using the B3LYP/6-31+G basis set for all atoms. The excitation energies and oscillator strengths of the compounds were calculated by TDDFT26 at the same level of optimization using the PCM with water as a solvent.27 Cartesian coordinates are summarized at the end of this ESI.†Cell culture and fluorescence microscopy
HeLa cells were grown in Dulbecco's modified Eagle's medium (DMEM) supplemented with 10% fetal bovine serum on cover slip in 60 mm dishes. The cells were incubated with TQ (40 μM, in DMSO). After washing three times with phosphate buffered saline (PBS), 10 mM of OCl− (in PBS) was added and the cells were further incubated for 20 min. The cells then were washed three times with PBS and the imaging was carried out using BIOREVE BZ-9000 Fluorescence Microscope apparatus. All the cells were incubated at 37 °C in humidified air containing 5% CO2.Acknowledgements
We thank Dr Masaki Nakahata and Prof. Shinji Sakai (Graduate School of Engineering Science, Osaka University) for the use of fluorescence microscope. This work was supported by the Grant-in Aid for Scientific Research (No. 15K06556) from the Ministry of Education, Culture, Sports, Science and Technology, Japan (MEXT) and the Precursory Research for Embryonic Science and Technology (PRESTO, JPMJPR1442) from Japan Science and Technology Agency (JST).Notes and references
- A. Gomes, E. Fernandes and J. L. F. C. Lima, J. Biochem. Biophys. Methods, 2005, 65, 45 CrossRef CAS PubMed.
- J. Shepherd, S. A. Hilderbrand, P. Waternan, J. W. Heinecke, R. Weissleder and P. Libby, Chem. Biol., 2007, 14, 1221 CrossRef CAS PubMed.
- A. J. Kettle and C. C. Winterbourn, Redox Rep., 1997, 3, 3 CrossRef CAS PubMed.
- T. Aokl and M. Munemorl, Anal. Chem., 1983, 55, 209 CrossRef.
- S. L. Hazen, F. F. Hsu, K. Duffin and J. W. Heinecke, J. Biol. Chem., 1996, 271, 23080 CrossRef CAS PubMed.
- T. Sugiyama, M. Fujita, N. Koide and I. Mori, Microbiol. Immunol., 2004, 48, 957 CrossRef CAS PubMed.
- (a) Y. Zhou, J. Y. Li, K. H. Chu, K. Liu, C. Yao and J. Y. Li, Chem. Commun., 2012, 48, 4677 RSC; (b) Q. Xu, K. A. Lee, S. Lee, K. M. Lee, W. J. Lee and J. Yoon, J. Am. Chem. Soc., 2013, 135, 9944 CrossRef CAS PubMed.
- (a) X. Chen, F. Wang, J. Y. Hyun, T. Wei, J. Qiang, X. Ren, I. Shin and J. Yoon, Chem. Soc. Rev., 2016, 45, 2976 RSC; (b) S. Kenmoku, Y. Urano, H. Kojima and T. Nagano, J. Am. Chem. Soc., 2007, 129, 7313 CrossRef CAS PubMed; (c) Y. Koide, Y. Urano, K. Hanaoka, T. Terai and T. Nagano, J. Am. Chem. Soc., 2011, 133, 5680 CrossRef CAS PubMed; (d) X. Chen, X. Wang, S. Wang, W. Shi, K. Wang and H. Ma, Chem.–Eur. J., 2008, 14, 4719 CrossRef CAS PubMed; (e) S. Goswami, A. K. Das, A. Manna, A. K. Maity, P. Saha, C. K. Quah, H. K. Fun and H. A. A. Aziz, Anal. Chem., 2014, 86, 6315 CrossRef CAS PubMed; (f) P. Panizzi, M. Nahrendorf, M. Wildgruber, P. Waterman, J. L. Figueiredo and E. Aikawa, J. Am. Chem. Soc., 2009, 131, 15739 CrossRef CAS PubMed; (g) Y. K. Yang, H. J. Cho, J. Lee, I. Shin and J. Tae, Org. Lett., 2009, 11, 859 CrossRef CAS PubMed; (h) Y. Zhou, J. Y. Li, K. H. Chu, K. Liu, C. Yao and J. Y. Li, Chem. Commun., 2012, 48, 4677 RSC.
- (a) G. Chen, F. Song, J. Wang, Z. Yang, S. Sun, J. Fan, X. Qiang, X. Wang, B. Dou and X. Peng, Chem. Commun., 2012, 48, 2949 RSC; (b) Y. Huang, P. Zhang, M. Gao, F. Zeng, A. Qin, S. Wu and B. Z. Tang, Chem. Commun., 2016, 52, 7288 RSC; (c) L. Zhi, Z. Wang, J. Liu, W. Liu, H. Zhang, F. Chen and B. Wang, Nanoscale, 2015, 7, 11712 RSC; (d) J. T. Hou, K. Li, J. Yang, K. K. Yu, Y. X. Liao, Y. Z. Ran, Y. H. Liu, X. D. Zhou and X. Q. Yu, Chem. Commun., 2015, 51, 6781 RSC; (e) K. Y. Zhang, J. Zhang, Y. Liu, S. Liu, P. Zhang, Q. Zhao, Y. Tanga and W. Huang, Chem. Sci., 2015, 6, 301 RSC; (f) L. Yuan, W. Lin, Y. Xie, B. Chen and J. Song, Chem.–Eur. J., 2012, 18, 2700 CrossRef CAS PubMed; (g) S. Goswami, A. Manna, S. Paul, C. K. Quah and H. K. Fun, Chem. Commun., 2013, 49, 11656 RSC; (h) L. Long, D. Zhang, X. Li, J. Zhang, C. Zhang and L. Zhou, Anal. Chim. Acta, 2013, 775, 100 CrossRef CAS PubMed; (i) L. Wang, L. Long, L. Zhou, Y. Wu, C. Zhang, Z. Han, J. Wang and Z. Da, RSC Adv., 2014, 4, 59535 RSC; (j) L. Long, Y. Wu, L. Wang, A. Gong, F. Hu and C. Zhang, Chem. Commun., 2015, 51, 10435 RSC.
- N. Ponsa, J. Sattabongkot, P. Kittayapong, N. Eikarat and R. E. Coleman, Am. J. Trop. Med. Hyg., 2003, 69, 542 CAS.
- D. R. Hill, J. K. Baird, M. E. Parise, L. S. Lewis and E. T. Ryan, Am. J. Trop. Med. Hyg., 2006, 75, 402 CAS.
- Practical Chemotherapy of Malaria, World Health Organization Technical Report Series no. 805, World Health Organization, Geneva, 1990, p. 128 Search PubMed.
- Leishmaniasis Fact sheet No. 375, World Health Organization, January 2014 Search PubMed.
- (a) S. Dröse and U. Brandt, J. Biol. Chem., 2008, 283, 21649 CrossRef PubMed; (b) A. Mehta and C. Shaha, J. Biol. Chem., 2004, 279, 11798 CrossRef CAS PubMed.
- (a) M. Shortreed, R. Kopelman, M. Kuhn and B. Hoyland, Anal. Chem., 1996, 68, 1414 CrossRef CAS PubMed; (b) N. Sharma, S. I. Reja, V. Bhalla and M. Kumar, Dalton Trans., 2014, 43, 15929 RSC.
- C. Mancini, A. Kairdolf, M. Smith and S. Nie, J. Am. Chem. Soc., 2008, 130, 10836 CrossRef PubMed.
- (a) E. B. Love and L. Tsai, Synth. Commun., 1992, 22, 3101 CrossRef; (b) X. Liu, A. Zheng, D. Luan, X. Wang, F. Kong, L. Tong, K. Xu and B. Tang, Anal. Chem., 2017, 89, 1787 CrossRef CAS PubMed.
- M. Whiteman and J. P. E. Spencer, Biochem. Biophys. Res. Commun., 2008, 371, 50 CrossRef CAS PubMed.
- (a) J. Fan, H. Mu, H. Zhu, J. Du, N. Jiang, J. Wang and X. Peng, Ind. Eng. Chem. Res., 2015, 54, 8842 CrossRef CAS; (b) C. Wang, H. Ji, M. Li, L. Cai, Z. Wang, Q. Li and Z. Li, Faraday Discuss., 2017, 196, 427 RSC.
- K. Setsukinai, Y. Urano, K. Kakinuma, H. J. Majima and T. Nagano, J. Biol. Chem., 2003, 278, 3170 CrossRef CAS PubMed.
- N. Umezawa, K. Tanaka, Y. Urano, K. Kikuchi, T. Higuchi and T. Nagano, Angew. Chem., Int. Ed., 1999, 38, 2899 CrossRef CAS PubMed.
- (a) Z. Sun, F. Liu, Y. Chen, P. K. H. Tam and D. Yang, Org. Lett., 2008, 10, 2171 CrossRef CAS PubMed; (b) Y. Yang, H. J. Cho, J. Lee, I. Shin and J. Tae, Org. Lett., 2009, 11, 859 CrossRef CAS PubMed.
- Y. Shiraishi, K. Tanaka, E. Shirakawa, Y. Sugano, S. Ichikawa, S. Tanaka and T. Hirai, Angew. Chem., Int. Ed., 2013, 52, 8304 CrossRef CAS PubMed.
- Y. Shiraishi, M. Nakamura, K. Yamamoto and T. Hirai, Chem. Commun., 2014, 50, 11583 RSC.
- (a) A. Proutiere, E. Megnassan and H. Hucteau, J. Phys. Chem., 1992, 96, 3485 CrossRef CAS; (b) B. Bag and P. K. Bharadwaj, J. Phys. Chem. B, 2005, 109, 4377 CrossRef CAS PubMed.
- R. E. Stratmann, G. E. Scuseria and M. J. Frisch, J. Chem. Phys., 1998, 109, 8218 CrossRef CAS.
- M. Cossi, V. Barone, R. Cammi and J. Tomasi, Chem. Phys. Lett., 1996, 255, 327 CrossRef CAS.
Footnote |
| † Electronic supplementary information (ESI) available: Supplementary data (Fig. S1–S10), and Cartesian coordinates for molecules. See DOI: 10.1039/c7ra04867j |
| This journal is © The Royal Society of Chemistry 2017 |

