 Open Access Article
Solution combustion synthesis and enhanced gas sensing properties of porous In2O3/ZnO heterostructures†
Xinwei Zou *,
Xiaoyan Yan,
Guomin Li,
Yuming Tian,
Mingang Zhang and
Liping Liang
School of Materials Science and Engineering, Taiyuan University of Science and Technology, Taiyuan 030024, P. R. China. E-mail: moodland@163.com; Tel: +86 351 2161126
First published on 10th July 2017
Abstract
Self-assembled porous In2O3/ZnO heterostructures were prepared by a low temperature solution combustion synthesis method, and characterized using X-ray diffraction (XRD), scanning electron microscopy (SEM) and high resolution transmission electron microscopy (HRTEM). The results indicate that the as-synthesized porous In2O3/ZnO heterostructures were constructed from a large number of In2O3 and ZnO nanoparticles and showed high gas sensing performance toward Cl2. Compared with pure ZnO and other heterostructure sensors, the porous In2O3/ZnO heterostructures with an appropriate molar ratio of In2O3![[thin space (1/6-em)]](https://www.rsc.org/images/entities/char_2009.gif) :
:![[thin space (1/6-em)]](https://www.rsc.org/images/entities/char_2009.gif) ZnO exhibited highly enhanced gas sensing performances toward Cl2. An extremely high sensitivity of 6610 could be reached when exposed to 50 ppm Cl2 at 370 °C; also, In2O3/ZnO heterostructures showed high selectivity toward Cl2. Furthermore, the gas sensing mechanism was discussed.
ZnO exhibited highly enhanced gas sensing performances toward Cl2. An extremely high sensitivity of 6610 could be reached when exposed to 50 ppm Cl2 at 370 °C; also, In2O3/ZnO heterostructures showed high selectivity toward Cl2. Furthermore, the gas sensing mechanism was discussed.
1. Introduction
Chlorine (Cl2) is widely used in the chemical industry, but it is toxic. Exposure to chlorine will result in injury and disease. Properly installed, reliable gas detection can help prevent chlorine-related injury or death. Therefore, several sensing technologies have been reported for detection of Cl2, such as conductivity-type gas sensors using metal-oxides,1–4 gas chromatography,5 electrochemical sensors6 and chemical detecting tubes.7 As for gas chromatography and the chemical detecting tubes, the detecting process is very complicated. Electrochemical sensors can not detect dilute chlorine gas. Metal oxides and complex metal oxides are promising chlorine gas sensors due to their outstanding features including low cost, simple fabrication, good selectivity and high sensitivity.8–10 However, the metal oxide gas sensors still have several unsolved problems such as slow response and long recovery time, which limit their commercial applications. For example, Tamaki's group has prepared In2O3 thin film chlorine gas sensors showing extremely high sensitivity to dilute Cl2 gas of 0.2–5 ppm, while the recovery time is in the range of 1–15 min.11 In addition, a WO3 gas sensor for Cl2 also has similar disadvantages of slow response and long recovery time.2Gas sensing performance can be further enhanced by the appropriate integration of two different kinds of semiconductor oxides due to the strong interactions between the closely packed nano-units in the composites.12–14 Solution combustion synthesis SCS is an excellent method which is simple, high-efficiency and low-cost, and does not require high-temperature furnaces and complicated set-ups.15 Moreover, the products prepared by SCS tend to possess good crystallinity, small crystallite size, mesoporous nature and high surface area.16 Herein, the porous In2O3/ZnO heterostructures have been prepared by the simple and low-cost SCS method, also the sensors based on the porous heterostructures show tremendously high sensitivity and fast response and recovery gas sensing properties toward Cl2 gas.
2. Experiment
All the chemical reagents such as zinc nitrate hexahydrate (Zn(NO3)2·6H2O), oxalic acid dihydrate (C2H2O4·2H2O), indium nitrate pentahydrate (In(NO3)3·5H2O) used in the experiments are of analytical reagent (AR) grade without further purification. The typical synthesis procedure for the porous In2O3/ZnO heterostructures is as follow. First, a mixture aqueous solution containing stoichiometric amounts of zinc/indium nitrate and oxalic acid was stirred for about 30 min in order to make it transform into a uniform colloidal solution. Then, the colloidal solution was transferred to a pyrex dish. Next, the dish was introduced into a muffle furnace which has been preheated to 450 °C for 5 min. In this situation the solution was heated rapidly and the following redox reactions could occur.
 | (1) |
 | (2) |
During the reaction process, Zn(NO3)2 and In(NO3)3 acted as oxidants and C2H2O4 acted as a fuel. Meanwhile, the dehydration reaction occurred as well. It was observed that a spark appeared at one corner then spread throughout the mass and yielded voluminous solid product. Here, the precursor solutions with 0![[thin space (1/6-em)]](https://www.rsc.org/images/entities/char_2009.gif) :
:![[thin space (1/6-em)]](https://www.rsc.org/images/entities/char_2009.gif) 1, 1
1, 1![[thin space (1/6-em)]](https://www.rsc.org/images/entities/char_2009.gif) :
:![[thin space (1/6-em)]](https://www.rsc.org/images/entities/char_2009.gif) 30, 1
30, 1![[thin space (1/6-em)]](https://www.rsc.org/images/entities/char_2009.gif) :
:![[thin space (1/6-em)]](https://www.rsc.org/images/entities/char_2009.gif) 24, 1
24, 1![[thin space (1/6-em)]](https://www.rsc.org/images/entities/char_2009.gif) :
:![[thin space (1/6-em)]](https://www.rsc.org/images/entities/char_2009.gif) 20 and 1
20 and 1![[thin space (1/6-em)]](https://www.rsc.org/images/entities/char_2009.gif) :
:![[thin space (1/6-em)]](https://www.rsc.org/images/entities/char_2009.gif) 10 molar ratios of In3+
10 molar ratios of In3+![[thin space (1/6-em)]](https://www.rsc.org/images/entities/char_2009.gif) :
:![[thin space (1/6-em)]](https://www.rsc.org/images/entities/char_2009.gif) Zn2+ were prepared and the corresponding solid products S0, S1, S2, S3, S4 and S5 were obtained, respectively.
Zn2+ were prepared and the corresponding solid products S0, S1, S2, S3, S4 and S5 were obtained, respectively.
The phase structure and phase purity of the obtained samples were examined by X-ray diffraction (XRD; X'pert, Philips, Holland) with Cu Kα1 radiation (λ = 1.5406 Å). The morphology of the obtained samples were investigated using field emission scanning electronic microscopy (FE-SEM; JSM-6701F, JEOL, Japan) and transmission electron microscopy (TEM; JEM-3010, Questar, New Hope, USA).
Fig. 1a is a schematic of the gas sensor device and the basic fabrication process is as our previously studies.17 In brief, the as-synthesized porous In2O3/ZnO heterostructures were mixed and grinded with adhesive in an agate mortar to form a paste. The paste used as sensitive body was coated on an alumina tube with Au electrodes and platinum wires. A Ni–Cr alloy crossing alumina tube was used as a heating resistor which ensured both substrate heating and temperature controlling. Each element was sintered at 500 °C for 2 h in air. In order to improve their stability and repeatability, the gas sensors were aged at 300 °C for 10 days in air. The gas sensing performances were measured by HW-30A gas sensing measurement system (Hanwei Ltd., Zhengzhou, China), as shown in Fig. 1b, which has a glass test chamber of 15 L. When Cl2 gas was injected to the chamber from a little hole in the chamber wall, the resistance of the sensor began changing. The concentration of the test gas was controlled by the amount of the pure gas injected. I–V characteristics of the sensors were investigated by a Keithley sourcemeter (Model 2410, Cleveland, USA) which was connected with the gas sensing measurement system in the voltage range from −20 V to 20 V. Sensitivity is defined as the ratio of Rgas/Rair, where Rair and Rgas are the resistance values measured in air and in Cl2 gas, respectively. The response/recovery time is defined as the time taken to achieve 90% of the final change in resistance following the change of gas concentration.
 | ||
| Fig. 1 (a) Schematic structure of the gas sensor and (b) gas-sensing measurement system (inset: sensor fabricated using In2O3/ZnO heterostructures). | ||
3. Results and discussion
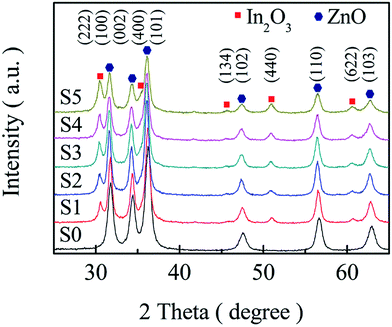
Fig. 2 displays the powder XRD patterns, two sets of diffraction peaks mixed together can be observed from the spectra, which can be indexed to hexagonal wurtzite ZnO (JCPDS no. 36-1451) and body-centred-cubic In2O3 (JCPDS no. 65-3170). There are no other characteristic peaks and peak shift detected, indicating that high purity and good crystalline In2O3 and ZnO are formed. Moreover, the relative intensity of In2O3 diffraction peaks increases as the molar ratio of In3+![[thin space (1/6-em)]](https://www.rsc.org/images/entities/char_2009.gif) :
:![[thin space (1/6-em)]](https://www.rsc.org/images/entities/char_2009.gif) Zn2+ increasing in the precursor solutions. The average crystallite sizes of all samples can be estimated by the Debye–Scherrer formula and the results are S0, S1, S2, S3, S4 and S5 are 13.21 nm (S0), 14.70 nm (S1), 13.90 nm (S2), 13.76 nm (S3), 13.31 nm (S4) and 11.64(S5) nm, respectively.
Zn2+ increasing in the precursor solutions. The average crystallite sizes of all samples can be estimated by the Debye–Scherrer formula and the results are S0, S1, S2, S3, S4 and S5 are 13.21 nm (S0), 14.70 nm (S1), 13.90 nm (S2), 13.76 nm (S3), 13.31 nm (S4) and 11.64(S5) nm, respectively.
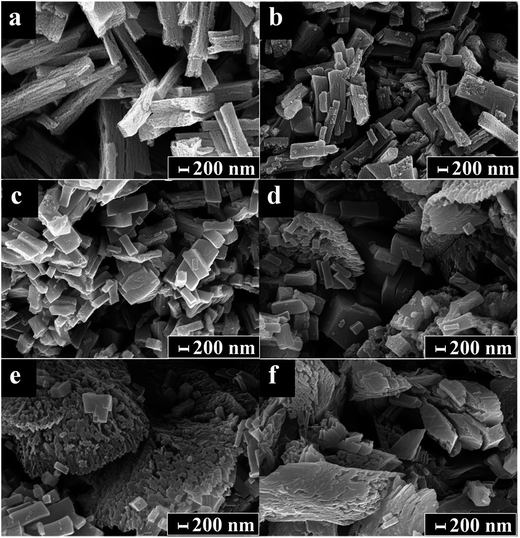
Fig. 3 shows the SEM images of different heterostructures. In Fig. 3a, pure ZnO shows self-assembly of three-dimensional porous rods with quite uniform size, the length and width of the rods are 1–2 μm and 100–200 nm, respectively. After the introduction of In2O3 the morphologies of the rods begin changing. At first, as the amount of In2O3 increases the rod length become shorter (Fig. 3b and c), further increases the amount of In2O3 the long structures gradually transform into random structures – irregular porous agglomerates of nano-heterostructures (Fig. 3d–f).
Fig. 4 shows the typical TEM analysis results of the heterostructures. The low magnification TEM image (Fig. 4a) demonstrates that the heterostructures possess a porous structure. The HRTEM image (Fig. 4b) indicates the heterostructures are composed of a large amount of nano-crystallites. Moreover, two sets of lattice fringes can be observed, the lattice distances of 0.282 nm and 0.253 nm match the (100) reflection of ZnO and the (400) reflection of cubic In2O3, respectively. The electron energy disperse spectroscopy (EDS) analysis result (Fig. 4c) shows that only Zn, In and O elements can be detected.
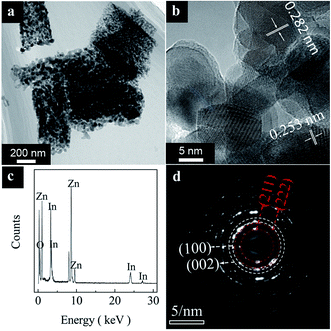 | ||
| Fig. 4 Typical TEM image (a), HRTEM image (b), EDS analysis result (c) and SAED pattern (d) of the heterostructures. | ||
In addition, the selected area electron diffraction (SAED) pattern (Fig. 4d) demonstrates clear rings with superimposed bright spots. The SAED pattern rings can be indexed as the (100), (002) reflections of ZnO and the (211), (222) reflections of In2O3, which is in agreement with the XRD patterns. These results further confirm the nano-crystalline nature of the In2O3/ZnO heterostructures.
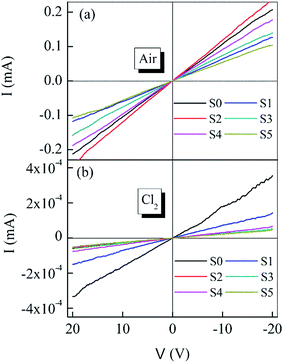
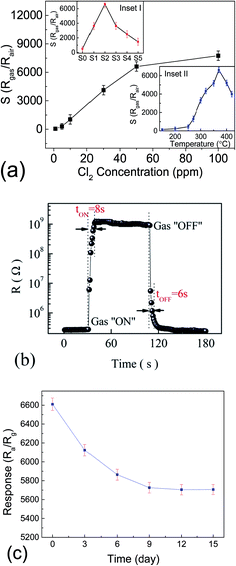
Fig. 5 shows the I–V curves of different sensors exposed to air and 50 ppm Cl2 at 300 °C. All the I–V curves are close to linear in low voltage region and fairly symmetric between positive and negative values of the voltage, which indicates all the sensors have good ohmic behaviors. Normally a good ohmic behavior means a high gas sensitivity.18 The sensor based on S2 has the maximum slop (resistance) variation which means it has the maximum gas sensitivity. Inset I of Fig. 6a shows the gas sensitivities of the sensors based on the heterostructures when exposed to 50 ppm Cl2 at 370 °C. The sensitivity is calculated as to the slop (resistance) variations of the related I–V curves in Fig. 5. Inset II of Fig. 6a shows the sensitivity transitions of S2 sensor depending on the temperature when exposed to 50 ppm Cl2. The sensitivity increases as temperature increasing and reaches the maximum value at 370 °C. These results indicate that S2 exhibits the maximum sensitivity and the optimum operating temperature for all the heterostructure sensors is determined to be 370 °C.
Fig. 6a displays the sensitivity changes of S2 when exposed to Cl2 with the concentrations of 1, 5, 10, 20, 50 and 100 ppm at 370 °C. It indicates that the sensitivity increases as Cl2 concentration increasing and can reach a huge value of 6610 when exposed to 50 ppm Cl2. Fig. 6b shows the typical response and recovery curve of S2 when exposed to 50 ppm Cl2. It can be observed that the response and recovery time are approximate 8 s and 6 s, respectively, which are acceptable in practical application. Fig. 6c displays the stability of the sensor based on S2 toward 50 ppm Cl2 at 370 °C. The results indicate that the gas response decreases over time. But the decrease is not very big which is reduced only by ∼14% after 15 days went by, and the response is stable at ∼5700 after 9 days.
Finally, the comparison with other reported sensing materials toward Cl2 shown in Table 1.13,19–21 Sensing performance of In2O3/ZnO is significantly superior to those previously reported.
| Chemical compounds | Concentration (Cl2) | Response | t(response)/t(recovery) (s) | Operating temperature (°C) | Morphology |
|---|---|---|---|---|---|
| In2O3/ZnO (this work) | 50 ppm | 6610 | 8/6 | 370 | Nanoparticles |
| SnO2 (ref. 19) | 10 ppm | 316.5 | 17/26 | 175 | Nanoparticles |
| In2O3/SnO2 (ref. 13) | 50 ppm | 1034.3 | 2/9 | 260 | Nanoparticles |
| In2O3 (ref. 20) | 50 ppm | 945.6 | 2/8 | 260 | Nanoparticles |
| ZnO21 | 5 ppm | 199 | 8/50 | 200 | Nanoparticles |
For metal oxide gas sensors, the change of resistance is mainly caused by the adsorption and desorption of gas molecules on the surface of the sensing structure. In the air oxygen species are adsorbed on the surface of particles, and then were ionized into O−(ads) or O2−(ads) by capturing free electrons from the valence band of the metal oxide leading to the formation of thick space charge layer.17,19 Upon exposure to Cl2 which is a stronger oxidizer than oxygen, Cl2 can not only capture the electrons from the valence band due to its higher electrophilic properties but also react with the pre-adsorbed oxygen species leading to the formation of Cl2 species (Cl−(ads) or Cl−O).19 ZnO and In2O3 are n-type semiconductors, when they are exposed to Cl2 the resistance increases for the charge carriers decreasing.
On the basis of the above results, it can be suggested that In2O3/ZnO heterostructures show an enhanced gas sensing performance compared with pure ZnO, and an appropriate amount of In2O3 can largely improve the sensitivity of In2O3/ZnO heterostructures while the excess of In2O3 plays the opposite role. Several reasons are believed to be responsible for this. As shown in the TEM (Fig. 4) image, a large amount of ZnO and In2O3 nanoparticles are piled up to form the loose and porous heterostructures. The BET surface area analysis results are shown in Table S1 and Fig. S1 in ESI,† which confirm the In2O3/ZnO heterostructures have porous structures and large specific surface areas more than 30 m2 g−1. A loose and porous structure can provide a higher surface area to volume ratio which benefits the adsorption and diffusion processes of NO2 gas resulting in the improvement of the gas sensing properties.22–24 Moreover, small sized particles enhanced the gas sensing activity to a great extent. A small particle size allows the electrons to reach the surface easily and hence enhances the gas sensing performance.25,26 In addition, the formation of a nano-heterostructure between In2O3 and ZnO is known to increase the gas response and selectivity.27,28 Just after the formation of junction between In2O3 and ZnO, the electrons will flow from the material with low work function to that with high work function until their Fermi levels equalize, which creates an electron depletion layer at the interface and bends the energy band. Unfortunately, the relative levels of work functions for In2O3 and ZnO are not consistent in the literatures and depend on the degree of nonstoichoiometry.29–31 In any case, the formation of electron depletion layer in the vicinity of the interface due to the difference of work functions can be considered, which increases the adsorption of oxygen species.12 On the other hand, as shown in Fig. 4, the excessive In2O3 leads to an agglomerate structure, which decreases the number of the active sites on the surface of ZnO. Correspondingly, the number of oxygen ions chemisorbing will be reduced, resulting in the decrease of the gas response.28
In practical application, selectivity is an important parameter for gas sensors to distinguish different kinds of detected gases. Fig. 7 shows the sensitivities of porous In2O3/ZnO heterostructures sensor (S2) against chlorine, benzene, toluene, hydrogen, carbon monoxide, nitrogen dioxide, ammonia, ethanol, methanol, formaldehyde, and acetone gases (the concentrations of these test gases are all 50 ppm at 370 °C. If the resistance of the sensor in test gas is smaller than in air, the sensitivity is defined as the ratio of Rair/Rgas). It can be observed from Fig. 7 that the porous In2O3/ZnO heterostructures sensor possesses a far higher selectivity to Cl2 than the other gases. The different sensitivities under the same condition can be attributed to different gases possess different inherent energies level for adsorption, desorption and reaction with active sites on the surface of the sensing materials.32
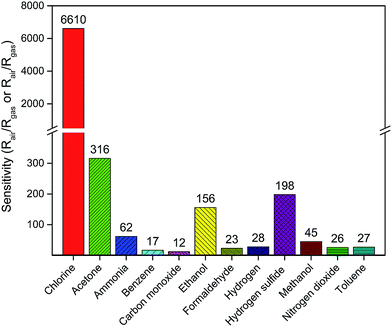 | ||
| Fig. 7 Sensitivity of In2O3/ZnO heterostructures upon exposure to 50 ppm of different gases at 370 °C. | ||
4. Conclusions
Self-assembled porous In2O3/ZnO heterostructures are successfully synthesized via a low temperature solution combustion method. The gas sensor based on the porous In2O3/ZnO heterostructures exhibits highly improved sensitivity to dilute chlorine. The sensitivity value increases linearly with the increasing Cl2 concentration and reaches 6610 exposed to 50 ppm Cl2 at 370 °C. Moreover, the response and recovery time are approximate 8 s and 6 s, respectively. The enhanced gas sensing performance are attributed to the small particle size, loose and porous structure and the formation of a depleted electron depletion layer at In2O3–ZnO interface.Acknowledgements
This work was supported by the Doctoral Scientific Research Foundation of Taiyuan University of Science and Technology (No. 20162006), Scientific and Technological Innovation Programs of Higher Education Institutions in Shanxi (2016-59), Talents Training Project of Shanxi Graduate Joint Training Base (2016-37), Shanxi Province Science Foundation and Fund for Shanxi Key Subjects Construction (201601D102019).References
- W. Hui, X. Jiaqiang and P. Qingyi, CrystEngComm, 2010, 12, 1280 RSC.
- P. Van Tong, N. D. Hoa, N. Van Duy and N. Van Hieu, RSC Adv., 2015, 5, 25204 RSC.
- V. B. Kamble and A. M. Umarji, J. Mater. Chem. C, 2013, 1, 8167 RSC.
- P. Li, H. Fan, Y. Cai and M. Xu, CrystEngComm, 2014, 16, 2715 RSC.
- A. L. Hunt and J. F. Alder, Anal. Commun., 1996, 33, 61 RSC.
- H. Zhang, J. Li, H. Zhang, X. Liang, C. Yin, Q. Diao, J. Zheng and G. Lu, Sens. Actuators, B, 2013, 180, 66 CrossRef CAS.
- A. Abdelhalim, M. Winkler, F. Loghin, C. Zeiser, P. Lugli and A. Abdellah, Sens. Actuators, B, 2015, 220, 1288 CrossRef CAS.
- G. F. Fine, L. M. Cavanagh, A. Afonja and R. Binions, Sensors, 2010, 10, 5469 CrossRef CAS PubMed.
- N. D. Hoa, V. V. Quang, D. Kim and N. V. Hieu, J. Alloys Compd., 2013, 549, 260 CrossRef.
- L. Ma, H. Fan, H. Tian, J. Fang and X. Qian, Sens. Actuators, B, 2016, 222, 508 CrossRef CAS.
- J. Tamaki, C. Naruo, Y. Yamamoto and M. Matsuoka, Sens. Actuators, B, 2002, 83, 190 CrossRef CAS.
- S. Wang, Z. Li, P. Wang, C. Xiao, R. Zhao, B. Xiao, T. Yang and M. Zhang, CrystEngComm, 2014, 16, 5716 RSC.
- P. Li, H. Fan and Y. Cai, Sens. Actuators, B, 2013, 185, 110 CrossRef CAS.
- H. Tian, H. Fan, M. Li and L. Ma, ACS Sens., 2016, 1, 243 CrossRef CAS.
- F.-T. Li, J. Ran, M. Jaroniec and S. Z. Qiao, Nanoscale, 2015, 7, 17590 RSC.
- W. Wen and J.-M. Wu, RSC Adv., 2014, 4, 58090 RSC.
- X. Zou, H. Fan, Y. Tian, M. Zhang and X. Yan, Dalton Trans., 2015, 44, 7811 RSC.
- J. S. Yang, J. H. Park, S.-I. Kim, Y. T. Kim and Y. H. Kim, Curr. Appl. Phys., 2010, 10, 370 CrossRef.
- X.-B. Wang, N. Qin, T.-J. Lou and X.-D. Lou, Phys. B, 2011, 406, 597 CrossRef CAS.
- P. Li, H. Fan and Y. Cai, Colloids Surf., A, 2014, 453, 109 CrossRef CAS.
- S. T. Navale, V. V. Jadhav, K. K. Tehare, R. U. R. Sagar, C. S. Biswas, M. Galluzzi, W. Liang, V. B. Patil, R. S. Mane and F. J. Stadler, Sens. Actuators, B, 2017, 238, 1102 CrossRef CAS.
- P. Song, Q. Wang and Z. Yang, Mater. Lett., 2011, 65, 430 CrossRef CAS.
- G. Korotcenkov and B. K. Cho, Sens. Actuators, B, 2017, 244, 182 CrossRef CAS.
- P. Li and H. Fan, Mater. Sci. Semicond. Process., 2015, 29, 83 CrossRef CAS.
- N. Vorobyeva, M. Rumyantseva, D. Filatova, E. Konstantinova, D. Grishina, A. Abakumov, S. Turner and A. Gaskov, Sens. Actuators, B, 2013, 182, 555 CrossRef CAS.
- J.-A. Park, J. Moon, S.-J. Lee, S. H. Kim, H. Y. Chu and T. Zyung, Sens. Actuators, B, 2010, 145, 592 CrossRef CAS.
- M. Gholami, A. A. Khodadadi, A. Anaraki Firooz and Y. Mortazavi, Sens. Actuators, B, 2015, 212, 395 CrossRef CAS.
- L. Han, D. Wang, J. Cui, L. Chen, T. Jiang and Y. Lin, J. Mater. Chem., 2012, 22, 12915 RSC.
- S. Martha, K. H. Reddy and K. M. Parida, J. Mater. Chem. A, 2014, 2, 3621 CAS.
- W. Zang, Y. Nie, D. Zhu, P. Deng, L. Xing and X. Xue, J. Phys. Chem. C, 2014, 118, 9209 CAS.
- Z. Wang, B. Huang, Y. Dai, X. Qin, X. Zhang, P. Wang, H. Liu and J. Yu, J. Phys. Chem. C, 2009, 113, 4612 CAS.
- X. Chi, C. Liu, Y. Li, H. Li, L. Liu, X. Bo, L. Liu and C. Su, Mater. Sci. Semicond. Process., 2014, 27, 494 CrossRef CAS.
Footnote |
| † Electronic supplementary information (ESI) available. See DOI: 10.1039/c7ra04852a |
| This journal is © The Royal Society of Chemistry 2017 |

