DOI:
10.1039/C7RA04660J
(Paper)
RSC Adv., 2017,
7, 29193-29199
Sulfonic acid-grafted polyvinylidene fluoride electrospun mats as electro-Fenton reactor membrane components
Received
25th April 2017
, Accepted 27th May 2017
First published on 5th June 2017
Abstract
Electro-Fenton (EF) reactors, involving in situ generation of H2O2 by reaction of O2 in aqueous Na2SO4 upon applying voltage, show a number of advantages for organic pollutants degradation. The membrane, a key component of EF reactors, prevents H2O2 from being consumed in the anode. Recently, polyvinylidene fluoride (PVDF) nanofibers have emerged as promising membrane components, although the high interface impedance and low conductivity of these materials are serious drawbacks. Sulfonic acid-grafted PVDF nanofiber membranes can overcome these limitations. In this work, nanofiber PVDF membranes were prepared from electrospun single-fiber mats loaded on non-woven fabrics. In these fibers, the PVDF polymer was functionalized with sulfonic acid via covalent (3-mercaptopropyl)trimethoxysilane (MPS) bonding. These sulfonic acid-grafted PVDF nanofiber membranes showed a remarkable decrease in the water contact angle (WCA, from 120 to 6°), thereby greatly improving the hydrophilicity while reducing the membrane impedance (from 21.9 Ω for the unmodified membrane to 15.7 Ω for the acid-grafted material). Methyl orange (MO), a model pollutant, was completely EF removed within 30 min using the modified membrane. The modified membrane allowed a decrease of the electric energy consumption (EEC) from 76.8 to 65.0 kW h kgTOC−1, thereby suggesting that this novel material can provide an effective approach to improve the EF performance.
Introduction
Electro-Fenton (EF) is a highly efficient and environmentally friendly technology that has been widely applied in degrading toxic or biorefractory organic pollutants.1–3 The EF process is based on the electrochemical generation of powerful oxidizing agents such as hydroxyl radicals (˙OH)4 able to non-selectively degrade most organics into CO2, H2O, and inorganic ions.5 During the EF process, ˙OH are produced via oxidation–reduction of the Fenton's reagent (i.e., H2O2 + Fe2+).6 Therefore, the production and storage of H2O2 largely influences the EF performance.
In the EF process, H2O2 is generated by reaction of O2 on the surface of the cathode electrode under acid conditions.7 However, as a side effect, H2O2 is simultaneously consumed on the surface of anode electrode,8 thereby reducing the utilization of H2O2. In this sense, a membrane is typically suggested to separate the anode and cathode electrodes. Different membranes (e.g., cationic, anionic, and Nafion-based) have been developed with the aim to improve the EF performance.1,9,10 However, to be used under strong acid and oxidation environments, the EF membrane is required to present high conductivity and chemical stability. Therefore, enormous efforts have been devoted to develop high selectivity membranes for efficiently improving the EF performance.
Recently, PVDF nanofibers have emerged as promising membrane components for enhancing the EF process owing to their high chemical stability, high porosity, high dielectric constant, and low cost characteristics.11 The open pore structure of PVDF nanofiber membranes facilitate ion transfer, thereby improving the membrane conductivity.12 However, PVDF membranes are typically hydrophobic, thereby providing these materials with high interface impedance and low conductivity characteristics. These drawbacks can be typically overcome by grafting on the membrane a hydrophilic group that serves also as a proton carrier, thereby enhancing the water and proton transfer phenomena. Especially, sulfonic acid-grafted PVDF membranes have attracted a great deal of attention as promising proton-conducting materials.13,14 These materials are usually prepared by grafting styrene or substituted styrene monomers onto fluorinated polymer chains via electron beam radiation followed by sulfonation reactions.15–17 However, this method typically involves complex and costly equipment operation.
Considering the above, we used an easy-to-use grating method for preparing PVDF membranes. Taking advantage of the strong polarity of the C–F bond, sodium hydroxide can be effectively used for introducing (–OH) functional groups onto the fluoropolymer main chains. (3-Mercaptopropyl)trimethoxysilane (MPS) was subsequently grafted onto the PVDF-OH material via silanization reaction. The final sulfonic acid-modified PVDF (SO3H-PVDF) membrane was obtained by oxidation with H2O2. The influence of the MPS concentration on the water contact angle (WCA) and the water flux was studied. The sulfonic acid-grafted PVDF nanofiber membrane with the optimum MPS content was further employed as a EF proton conducting membrane. Using methyl orange (MO) as a model pollutant, the performance (i.e., degradation rate and total organic carbon (TOC) removal) and electric energy consumption (EEC) of the EF system involving PVDF and SO3H-PVDF membranes was discussed herein.
Results and discussion
Morphology and properties of the PVDF electrospun mats
As shown in Table 1, the viscosity of the spinning solution increased with the PVDF concentration. By increasing the PVDF concentration, the molecular weight of the polymer chains increased, thereby increasing the degree of molecular chain entanglement and the viscosity of the solution as a result.
Table 1 Viscosity values for spinning solutions containing different concentrations of PVDF
| Solvent |
PVDF contents (wt%) |
Viscosity (cP) |
| DMF |
15 |
163 |
| DMF |
18 |
278 |
| DMF |
20 |
374 |
| DMF |
22 |
628 |
| DMF |
24 |
815 |
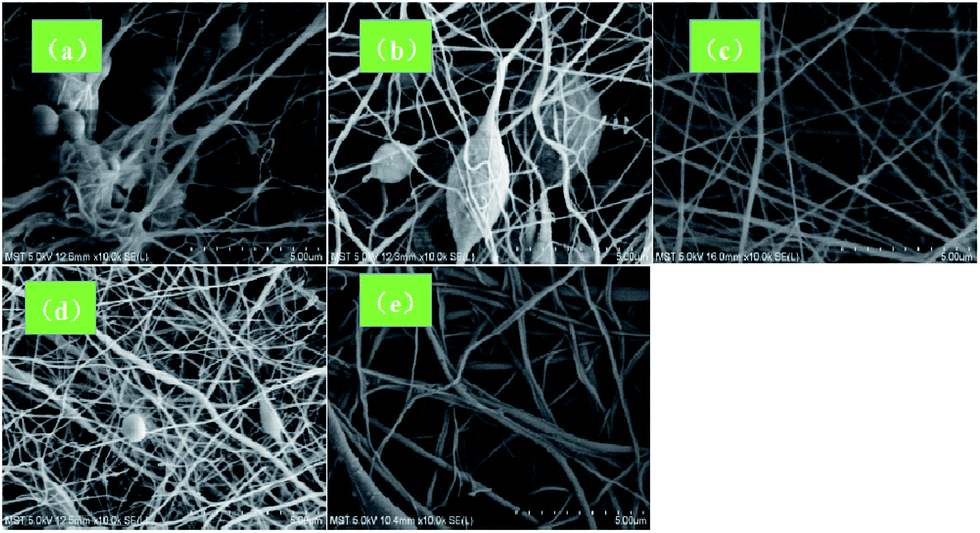
The viscosity of the spinning solution has a significant influence on the morphology of the electrospun fiber. Thus, at low viscosities, the surface tension is well below the electric field force and the nanofibers generated were prone to breaking, thereby producing the spinning liquid to directly move to the receiving screen to form a bead. As clearly shown in Fig. 1a and b, a large number of beads were formed at low PVDF concentrations. In contrast, at very high viscosity values, the splitting power of the spinning solution was weakened and coarse fibers were formed since the electric field force needs to overcome the larger surface tension. In addition, the volatilization of the solvent was hindered while increasing the viscosity, thereby favoring nanofiber adhesion. As shown in Fig. 1e, non-uniform nanofibers were obtained at a PVDF concentration of 24 wt%. However, bead-free nanofibers were obtained at 20 wt% PVDF (Fig. 1c). Accordingly, a spinning solution containing 20 wt% PVDF was employed to prepare the PVDF nanofiber membrane.
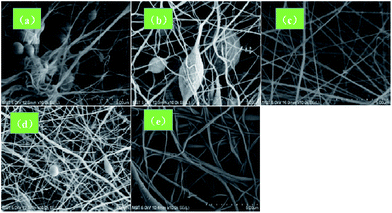 |
| | Fig. 1 SEM images the electrospun mats containing: (a) 15 wt%, (b) 18 wt%, (c) 20 wt%, (d) 22 wt%, and (e) 24 wt% PVDF contents. | |
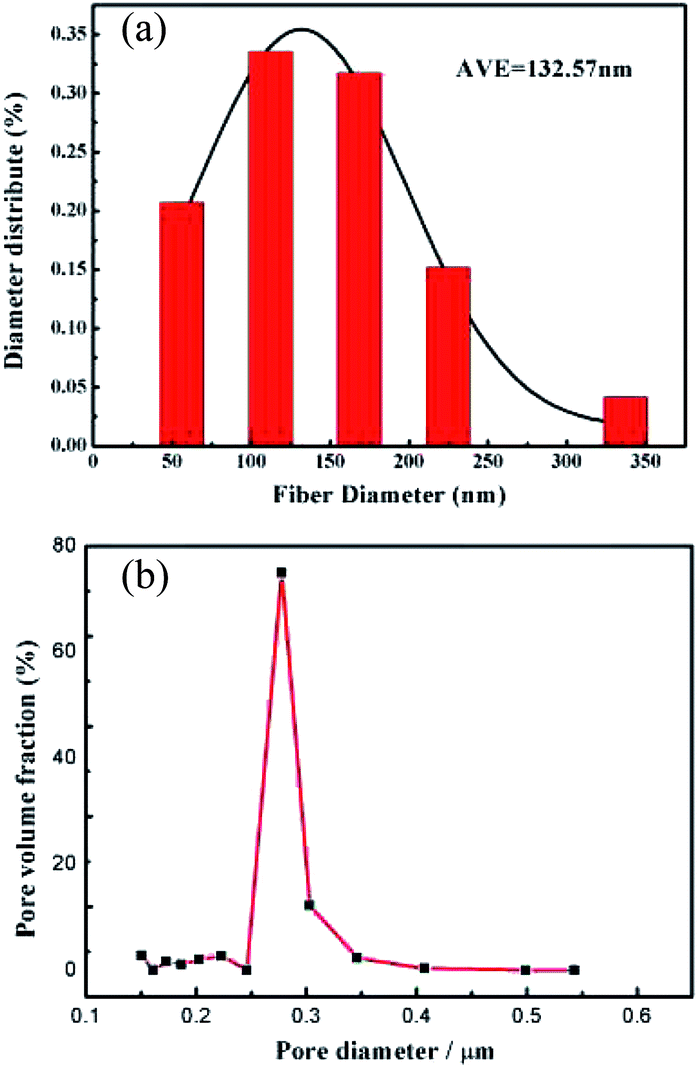
The diameter distribution of the PVDF nanofibers was analyzed. As shown in Fig. 2a, the average nanofiber diameter was 132.57 nm, while an average pore size of 0.29 μm (Fig. 2b) was obtained by the bubble pressure method. Remarkably, the membrane exhibited a high porosity of 71.91%, thereby potentially facilitating electrolyte uptake and ion transport through the membrane.
 |
| | Fig. 2 (a) Fiber diameter and (b) pore diameter distributions of the PVDF nanofiber membranes. | |
Sulfonic acid-grafted PVDF electrospun nanofiber membrane
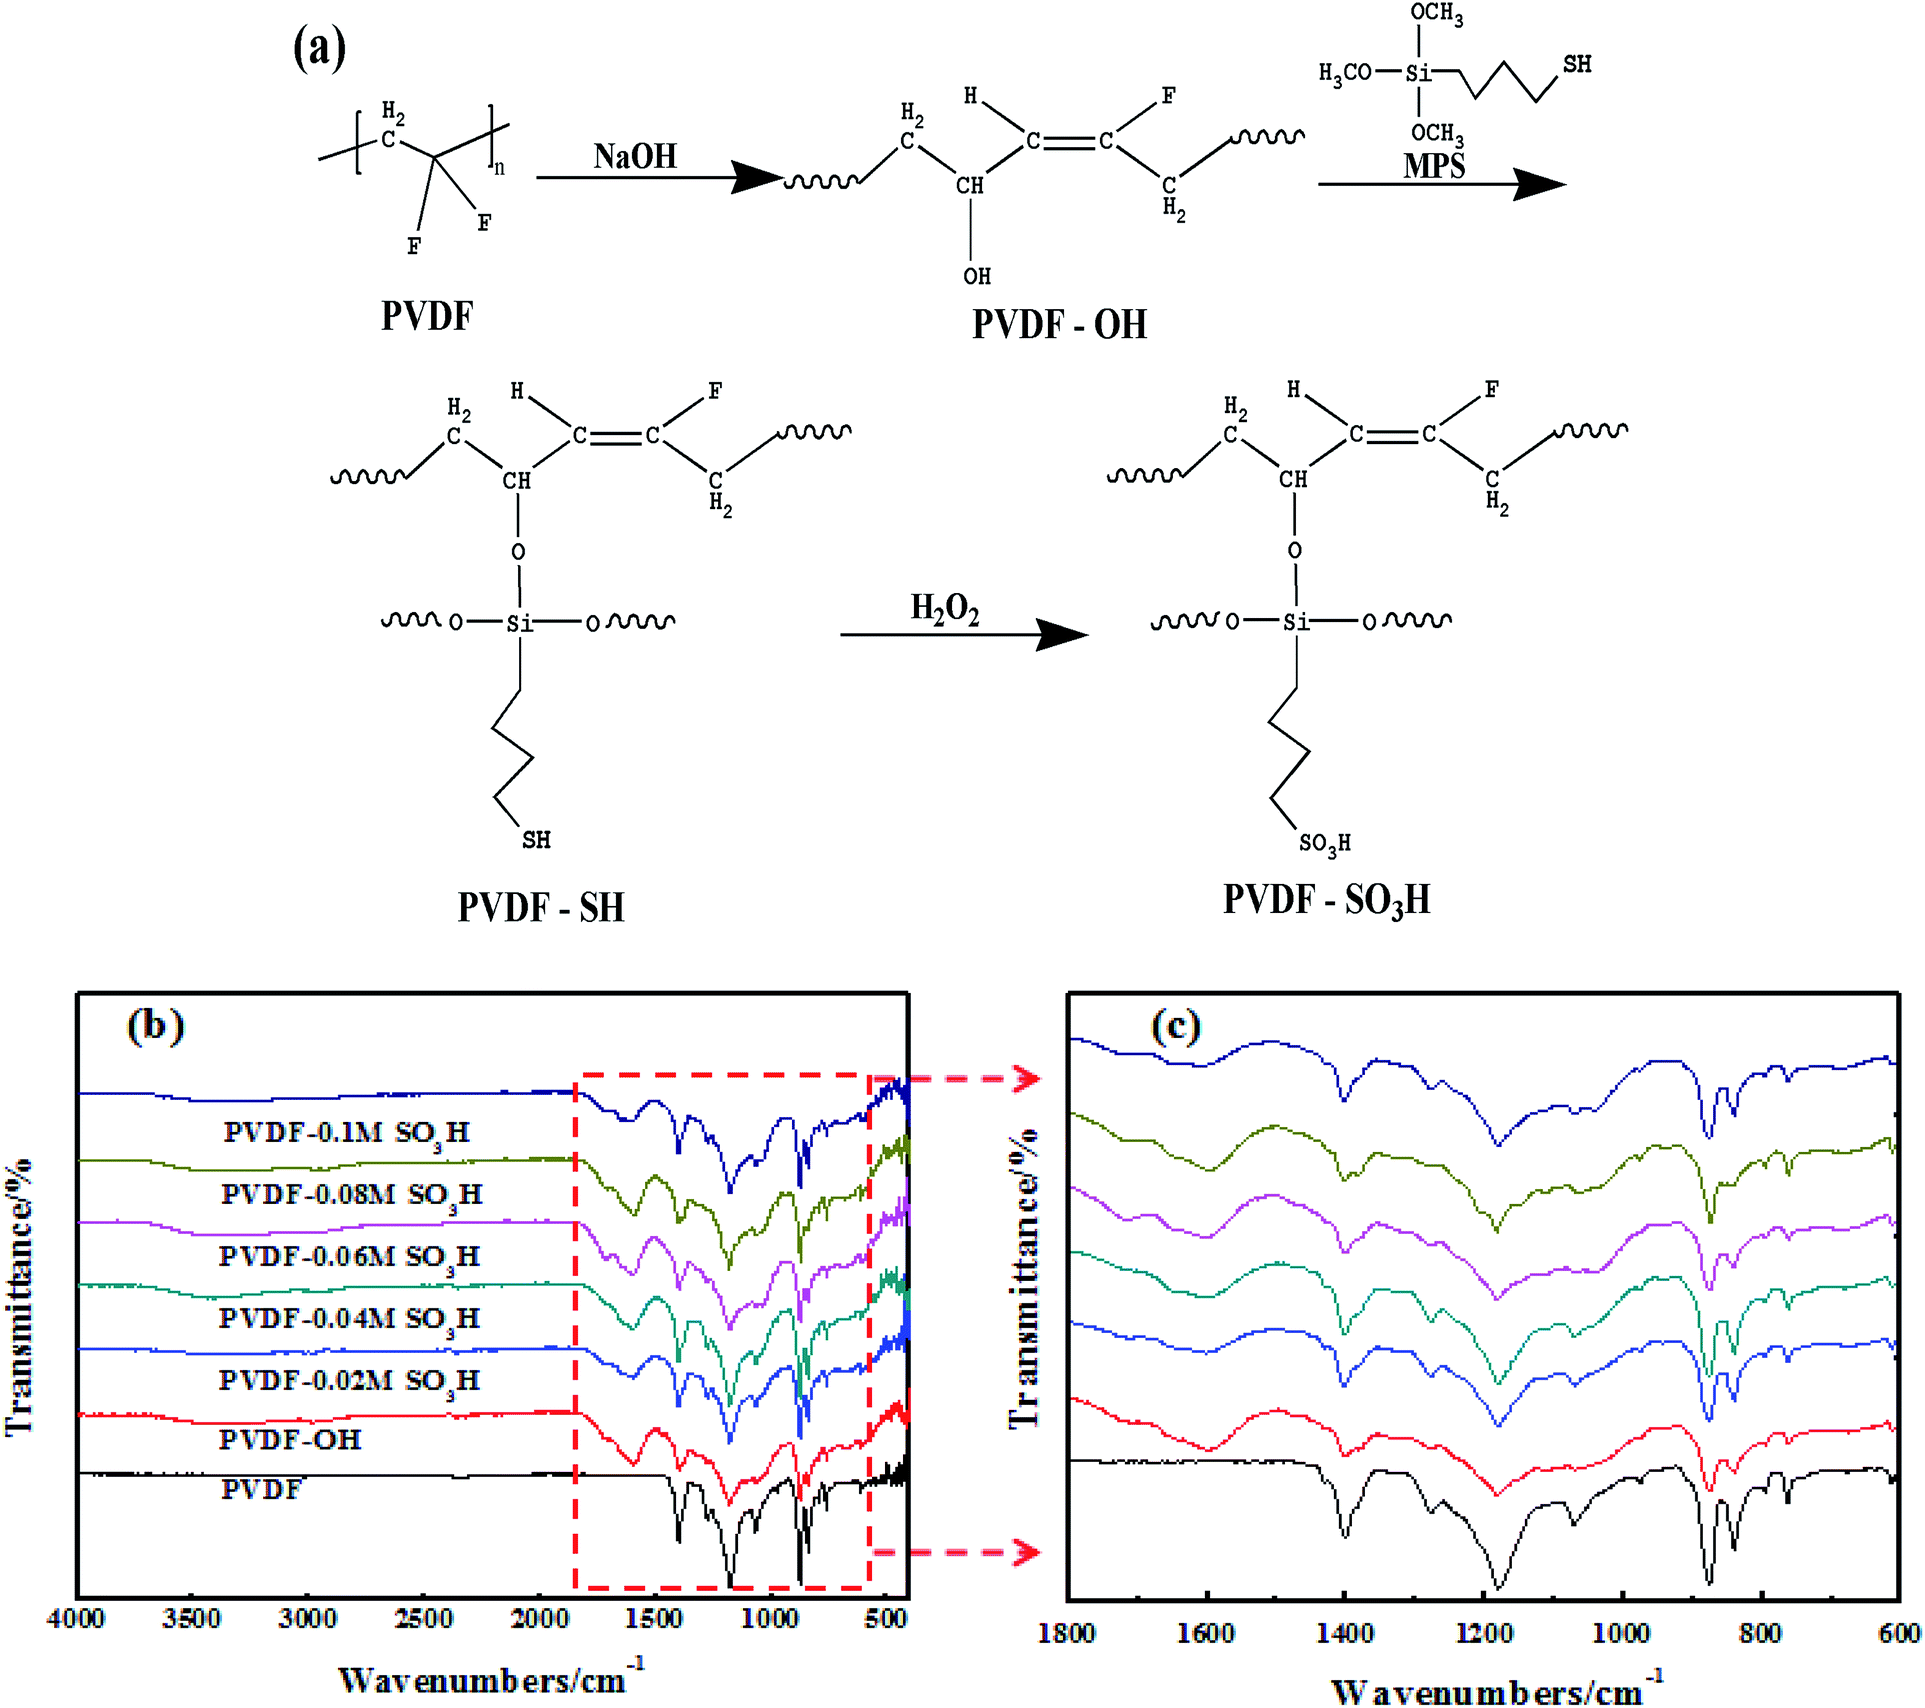
Sulfonic acid groups were grafted onto the PVDF nanofiber membrane by a chemical route. As illustrated in Fig. 3a, the grafting reaction was accompanied with HF in the main chain to form C![[double bond, length as m-dash]](https://www.rsc.org/images/entities/char_e001.gif) C double bonds serving as active sites for the introduction of hydrophilic hydroxyl groups. The silane coupling agent was subsequently introduced onto the surface of PVDF by reaction of the mercapto and the hydroxyl groups. Finally, sulfonic acid group-modified membranes were obtained by oxidation with H2O2.
C double bonds serving as active sites for the introduction of hydrophilic hydroxyl groups. The silane coupling agent was subsequently introduced onto the surface of PVDF by reaction of the mercapto and the hydroxyl groups. Finally, sulfonic acid group-modified membranes were obtained by oxidation with H2O2.
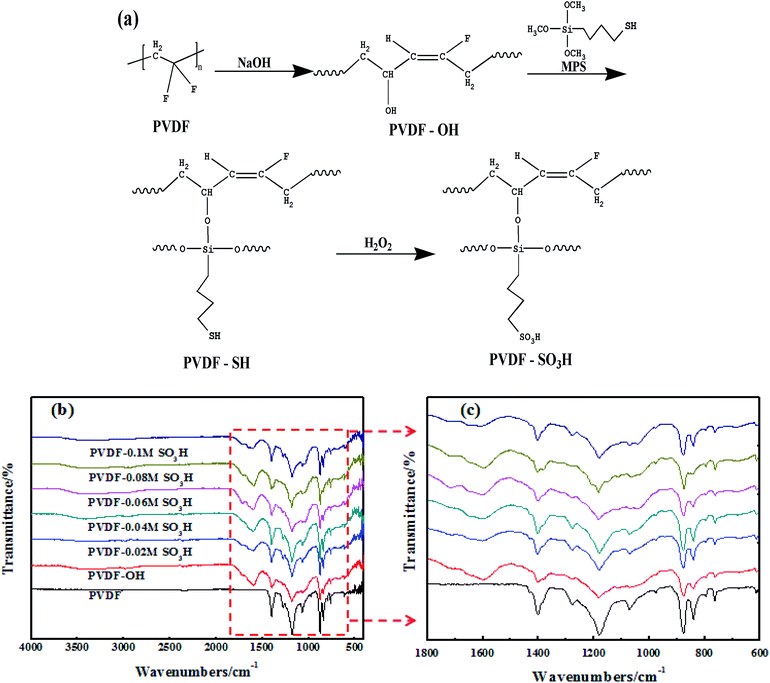 |
| | Fig. 3 (a) Schematic illustration of the synthesis route used to prepare the sulfonic acid-grafted PVDF membrane. FTIR spectra for the (b) PVDF and (c) PVDF-SO3H membranes. | |
The pristine and modified membranes were analyzed to verify that the grafting reaction took place, and the results are shown in Fig. 3b and c. As expected, a CC characteristic peak was observed at 1600 cm−1 in the NaOH-modified membranes. The Si–O–C characteristic peak was detected at 1080 cm−1 after silanization. In addition, the peaks characteristics of –SO3H were observed at 1043, 1110, 1151, and 1182 cm−1, and their intensity clearly increased with the MPS content of the feed. The above results indicated that –SO3H was successfully attached onto the PVDF chains through HF and silylation reactions of PVDF.
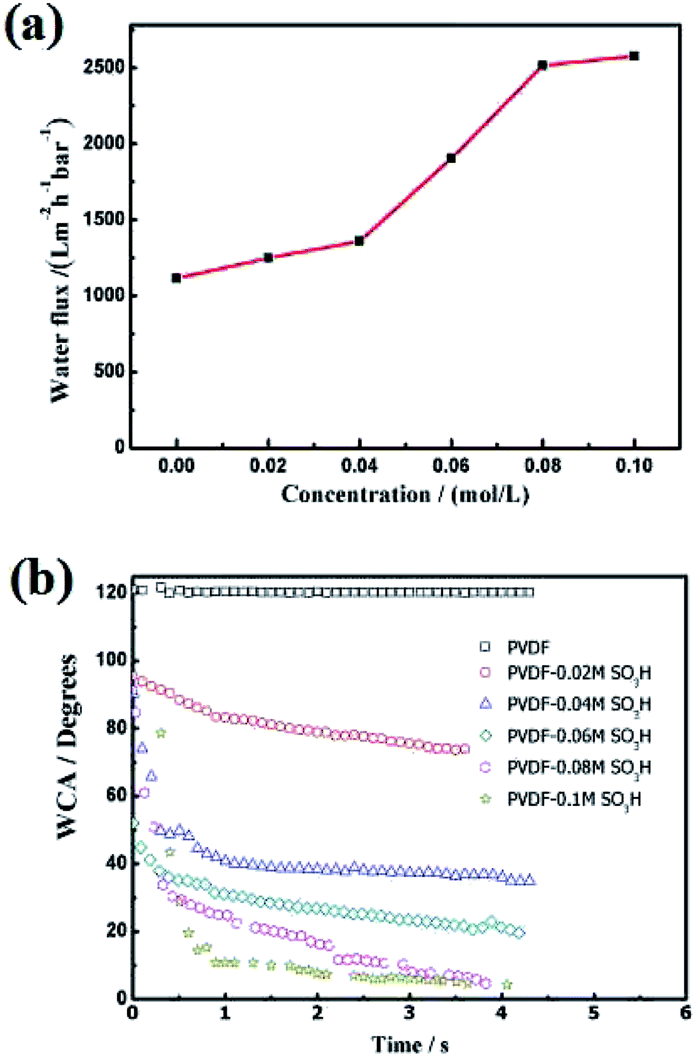
Subsequently, the wettability of the membrane surface was evaluated. The pristine membrane showed an hydrophobic behavior (WCA = 120°, Fig. 4b). This WCA value sharply decreased in the presence of sulfonic acid groups. As previously reported by numerous groups,19,20 the membrane became more hydrophilic with the MPC concentration and levelled off at a certain acid concentration. These resulted indicated that the wettability of the membrane surface was modified upon grafting sulfonic acid groups.
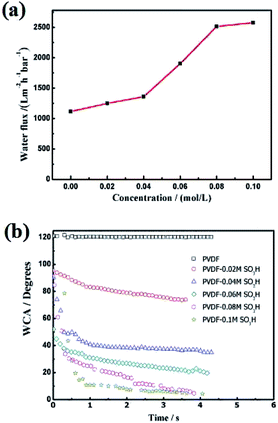 |
| | Fig. 4 (a) Water flux and (b) WCA of the PVDF nanofiber membrane at different MPS concentrations. | |
Hydrophilic surfaces typically promote water transport through the membrane.12 To further verify this hypothesis, we measured the pure water flux through the membrane (Fig. 4a). As expected, the water flux significantly enhanced in the presence of sulfonic acid groups. The water flux through the modified membrane continuously increased with the acid concentration up to 0.08 mol L−1 and levelled off thereafter. Thus, the concentration of hydroxyl groups on the membrane surface was saturated at an acid concentration of 0.08 mol L−1. This concentration was therefore selected as the optimum value for the silylation reaction.
Sulfonic acid-PVDF electrospun membrane in the EF system
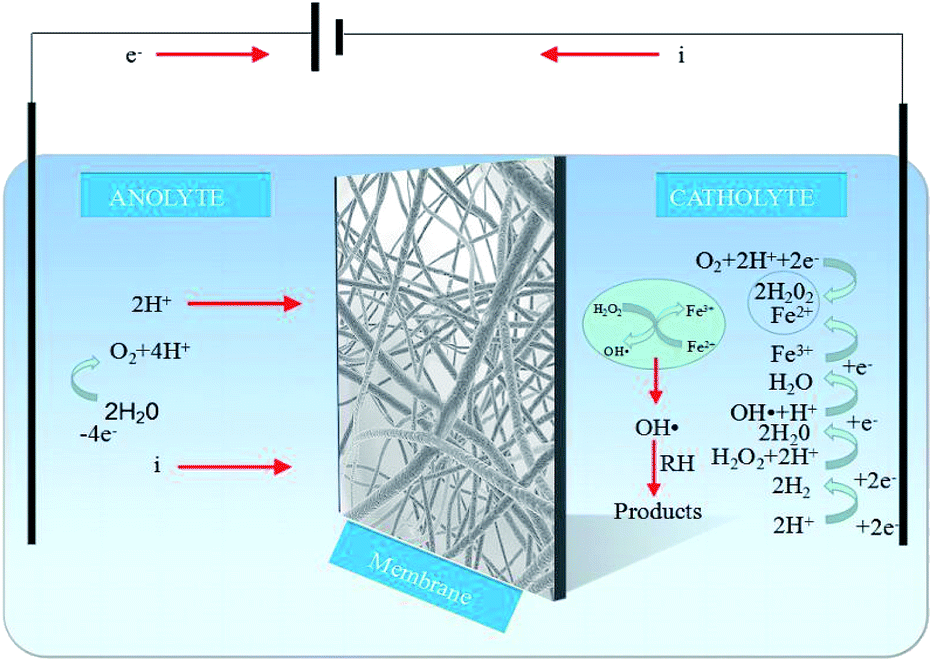
While the EF reaction mechanism is highly complex (Fig. 6), the main reactions involved can be described as follows:21–23| | |
O2 + 2H+ + 2e− → H2O2
| (1) |
| | |
H2O2 + Fe2+ + H+ → Fe3+ + ˙OH + H2O
| (2) |
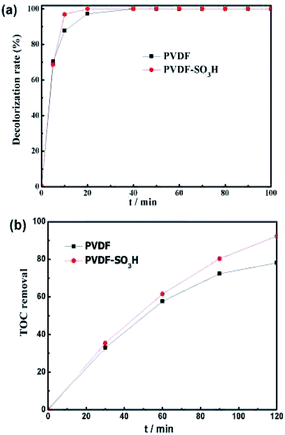 |
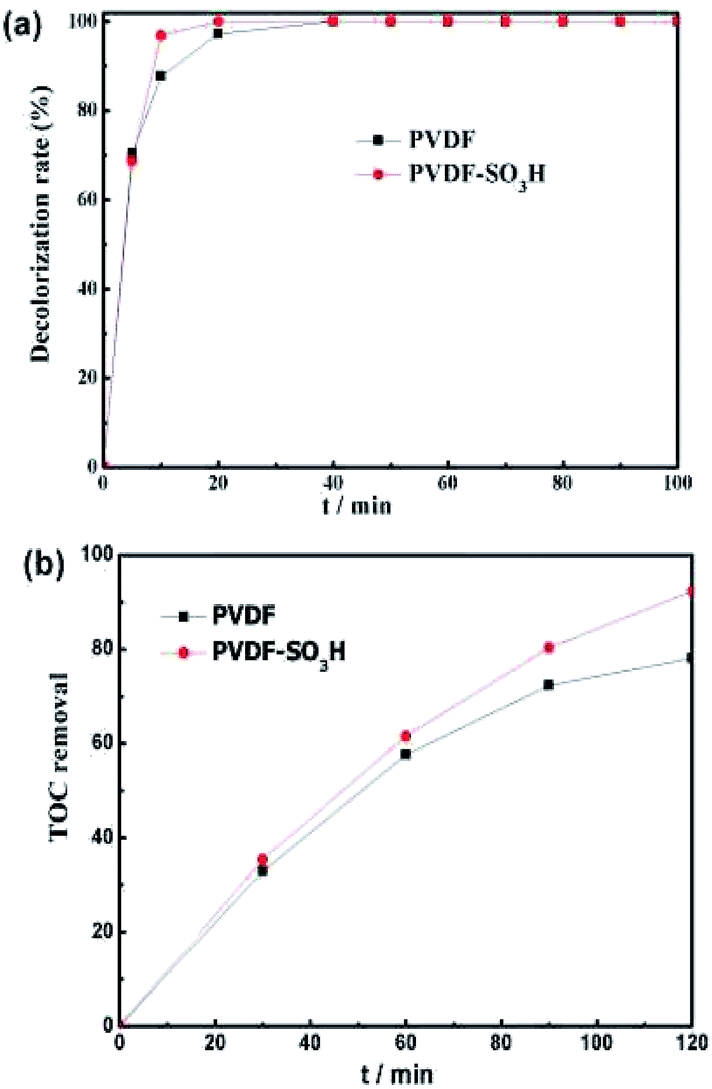
| | Fig. 5 (a) Decoloration of MO and (b) TOC removal for different membranes at divided flow cell. Conditions: V = 100 mL; [MO] = 0.1 mM; [Fe2+] = 0.2 mM; pH = 3; [H2SO4] = 5 mM; and I = −50 mA. | |
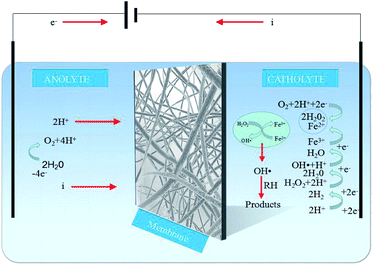 |
| | Fig. 6 Reaction mechanism of the EF process. | |
The performance of the electrospun nanofiber membranes in the EF system was evaluated by selecting MO as the model pollutant. As displayed in Fig. 5a, the PVDF-SO3H membrane showed a high degradation efficiency of 96.9% after 10 min. The PVDF-SO3H membrane showed a significant increase in the efficiency at the initial stage of reaction as compared to the pristine material. These results might be ascribed to the higher conductivity of the PVDF polymer in the presence of sulfonic acid groups, which promoted the production of H2O2 and ˙OH. The TOC removal also increased for the PVDF-SO3H membrane as compared to the pristine material (92.3 vs. 78.1%, Fig. 5b).
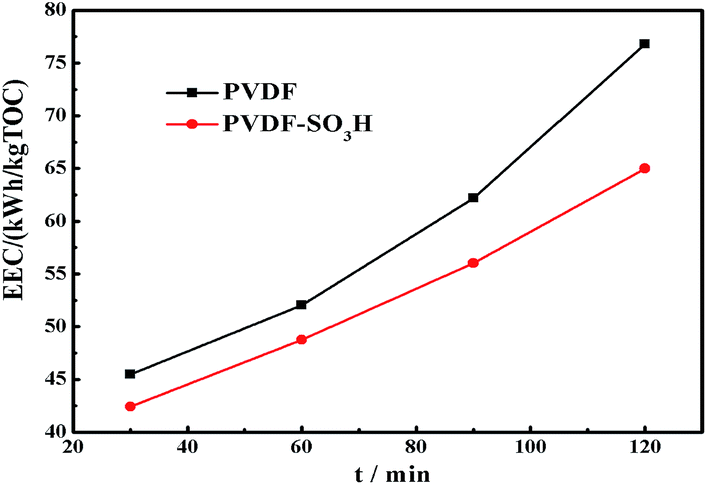
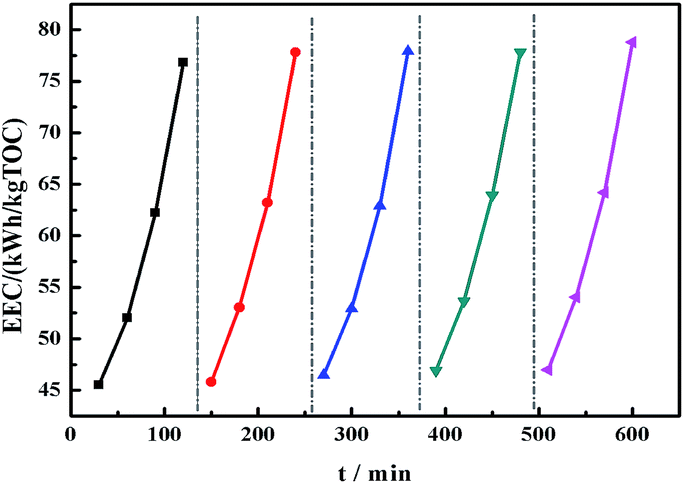
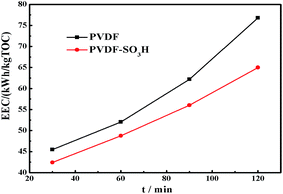
For practical engineering applications involving pollutant mineralization, the energy consumption is an important factor. Fig. 7 shows the EEC value of the membranes as a function of time. Remarkably, the modified membrane showed lower EEC values for the EF process as compared to the pristine material, and these values were significantly lower than those showed by other TOC removal technologies published in the literature (Table 2). In addition, the stability of the PVDF-SO3H membrane was tested. The modified membrane presented a fine long-cycling stability performance and its re-usability, as shown in Fig. 8. The results illustrated that the PVDF-SO3H membrane prepared herein can be suitable for EF applications with high degradation efficiency and low energy consumption.
 |
| | Fig. 7 EEC in the EF process for both membranes under study. | |
Table 2 Comparison of the EEC values of different TOC removal technologies published in literatures
| Method |
Electrode (anode/cathode) |
Pollutant |
Experimental conditions |
EEC (kW h kgTOC−1) |
References |
| Solar photoelectro-Fenton (SPEF) |
BDD/SPEF |
Food color additives |
Food color additives at a cyclic liquid flow rate of 200 L h−1, 0.05 M Na2SO4, 0.5 mM Fe2+, pH = 3.0 |
290 |
24 |
| SPEF |
BDD/ADE |
Acid yellow 36 azo dye |
2.5 L of 108 mg L−1 pollutant at a cyclic liquid flow rate of 200 L h−1, 0.1 M Na2SO4, 0.5 mM Fe2+, pH = 3.0 |
70 |
25 |
| LED-assisted electro-Fenton |
Graphite sheet (GS)/GS |
Winery waste water |
40 mL pollutant at a recirculation volumetric flow of 2 mL min−1, 0.1 M Na2SO4, 75 mg L−1 of Fe2+, pH = 2 |
1000 |
26 |
| E-Fenton |
BDD/ADE |
Azo dye carmoisine |
2.5 L of 209.3 mg L−1 pollutant at a cyclic liquid flow rate of 200 L h−1, 0.05 M Na2SO4, 0.5 mM Fe2+, pH = 3.0 |
1280 |
27 |
| E-Fenton |
Pt/ADE |
Azo dye amaranth |
400 mL of 100 mg L−1 pollutant, H2SO4 (0.1 M) and K2SO4(0.1 M), 0.15 mM Fe2+ |
370 |
28 |
| E-Fenton |
MWNT/CNT-COOFe2+ |
Oxalate |
0.25 mM pollutant at a sequential liquid flow rate of 1.6 mL min−1, 0.01 M Na2SO4, neutral pH |
46 |
29 |
| E-Fenton |
DSA/ADE |
Tetracycline (TC) |
50 mg L−1 pollutant at a flow rate of 7 mL min−1, 0.05 M Na2SO4, 0.3 mM Fe2+, pH = 3 |
83.3 |
18 |
| E-Fenton |
BDD/carbon fibers |
Phenol |
1 mM phenol, 0.05 M K2SO4, 0.1 mM Fe2+ |
80 |
30 |
| Vertical-flow E-Fenton |
PbO2/graphite felt |
Tartrazine |
300 mL of 100 mg L−1 pollutant at a flow rate of 40 mL min−1, 0.05 M Na2SO4, 0.4 mM Fe2+, pH = 3 |
145 |
31 |
| E-Fenton |
Graphite felt (GF)/GF |
MO |
200 mL of 100 mg L−1 pollutant at a flow rate of 50 mL min−1, cathodic electrolyte: 0.05 Na2SO4, 0.3 mM Fe2+, pH = 3; anodic electrolyte: 0.05 mM NaCl, pH = 3 |
65 |
Present work |
 |
| | Fig. 8 EEC in the EF process for 5 consecutive experiments with the PVDF-SO3H membrane. | |
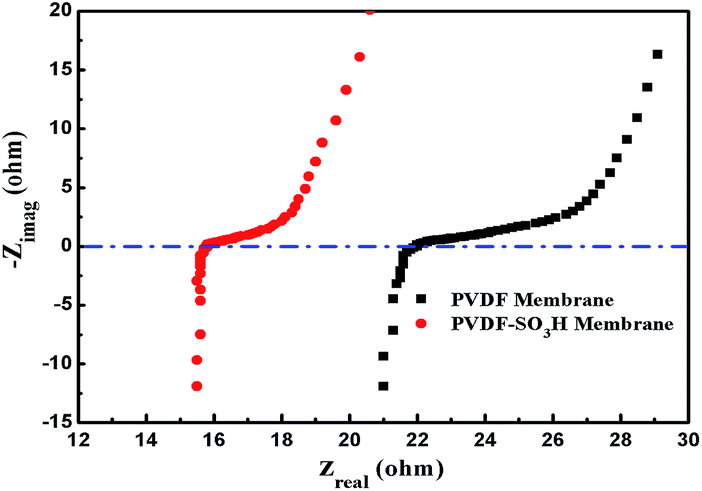
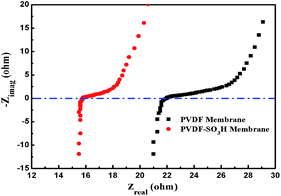
EIS measurements were carried out to explain the low EEC values of the PVDF-SO3H membrane. As shown in Fig. 9, the ohmic resistance of the pristine PVDF and PVDF-SO3H membranes were 21.9 and 15.7 Ω, respectively. Thus, the ohmic resistance significantly decreased upon –SO3H grafting. The hydrophilicity of the PVDF membrane was improved after modified by the –SO3H groups, thereby promote the water transfer through the membrane, which led to the acceleration of ion transport in the channel of membrane.1 Meanwhile, the sulfonic acid groups attached on the polymer chains can serve as proton sources, contributes significantly to proton conduction.2,3 And also, the negatively charged SO3− groups also coordinate with the cations, promoting the dissociation of the electrolytes.1 These effects allow significantly reducing the internal membrane resistance value.
 |
| | Fig. 9 Ohmic impedance of the pristine PVDF and PVDF-SO3H membranes. | |
Experimental section
Materials
All the chemicals used in this study were of analytical grade and used as received without further purification. PVDF (average Mn: ca. 400![[thin space (1/6-em)]](https://www.rsc.org/images/entities/char_2009.gif) 000, Sigma-Aldrich) and N,N-dimethylformamide (DMF, ≥99.5%, Sinopharm Chemical Reagent Co., Ltd) were used to prepare the electrospun nanofiber solution. Sodium hydroxide (NaOH, 96%, Sinopharm Chemical Reagent Co., Ltd), H2O2 (30%, Sinopharm Chemical Reagent Co., Ltd), and MPS (98%, Sigma-Aldrich) were used to modify the surface properties of the electrospun nanofiber mats. Furthermore, sodium chloride (NaCl), sodium sulfate (Na2SO4), hydrogen chloride (HCl), sulfuric acid (H2SO4), ferrous sulfate heptahydrate (FeSO4·7H2O), MO (Tianjin Chemical Reagent Research Institute) as a model pollutant, graphite felt (GF) (Shanghai Hong Jun Industry Co., Ltd) with a carbon content of 99.9% as an electrode material, and deionized water were used for the EF experiments.
000, Sigma-Aldrich) and N,N-dimethylformamide (DMF, ≥99.5%, Sinopharm Chemical Reagent Co., Ltd) were used to prepare the electrospun nanofiber solution. Sodium hydroxide (NaOH, 96%, Sinopharm Chemical Reagent Co., Ltd), H2O2 (30%, Sinopharm Chemical Reagent Co., Ltd), and MPS (98%, Sigma-Aldrich) were used to modify the surface properties of the electrospun nanofiber mats. Furthermore, sodium chloride (NaCl), sodium sulfate (Na2SO4), hydrogen chloride (HCl), sulfuric acid (H2SO4), ferrous sulfate heptahydrate (FeSO4·7H2O), MO (Tianjin Chemical Reagent Research Institute) as a model pollutant, graphite felt (GF) (Shanghai Hong Jun Industry Co., Ltd) with a carbon content of 99.9% as an electrode material, and deionized water were used for the EF experiments.
Preparation of the PVDF nanofibers
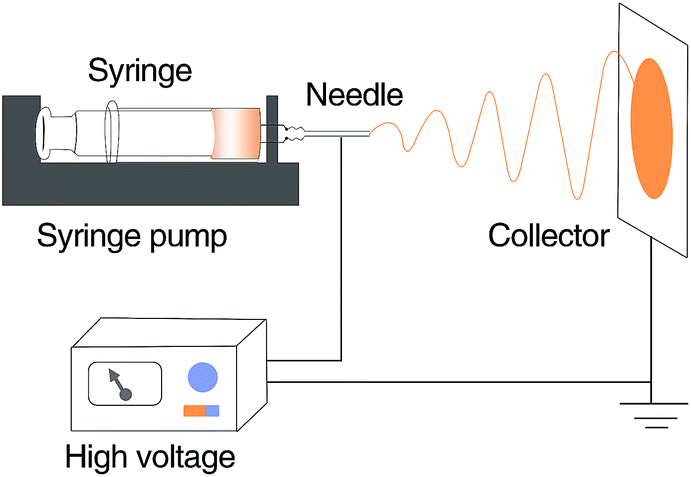
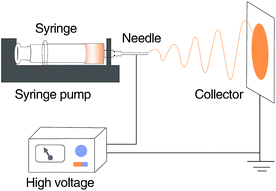
PVDF was dissolved in DMF at varying concentration (15, 18, 20, 22, and 24 wt%) and stirred at 60 °C for 12 h to obtain homogenous spinning solutions. The solutions were subsequently filled in a plastic syringe and used to fabricate the nanofiber membranes with a laboratory scale electrospinning apparatus (schematically shown in Fig. 10) at 25 °C, 45% relative humidity (RH), a voltage of 20 kV, a flow rate of 1.0 mL h−1, and a distance of 15 cm between the spinneret and the collector. The collected electrospun nanofiber membranes were vacuum dried at 80 °C for 12 h and subsequently stored until use.
 |
| | Fig. 10 Schematic of the electrospinning apparatus used herein. | |
Grafting of the sulfonic acid groups onto the PVDF nanofiber membranes
NaOH was dissolved in a 6 M ethanol aqueous solution at a volume ratio of 1:1. The membrane was subsequently immersed in this solution at 60 °C for 8 h to promote dehydrofluorination (HF) and introduce hydroxyl groups. The membrane was repeatedly washed with deionized water until neutral pH, and subsequently dried at 105 °C for 1 h. Silane coupling agents with different concentrations ranging from 0.02 to 0.08 M were dissolved in ethanol. Acetic acid (i.e., a hydrolysis catalyst) was added to the above solution to adjust the pH value at 3.5–5.5. After stirring for 1 h at 25 °C, a homogenous solution was obtained. Subsequently, the dried nanofiber membranes were immersed in the as-obtained solution and allowed to react for 10 h in a constant temperature oscillator at 60 °C. Subsequently, the membrane was thoroughly rinsed with ethanol and vacuum dried at 110 °C for an hour to completely remove the solvent.
Finally, the above membranes were soaked with a 2 wt% hydrogen peroxide aqueous solution to promote oxidation of mercapto groups to sulfonic acid in constant temperature oscillator at 60 °C. After 8 h, the membrane surface was rinsed with deionized water and subsequently dried at 110 °C for 1 h. All the modified membranes were stored in distilled water before being used.
Characterization
The viscosity of the spinning solution was determined using a rotary viscometer (DV-II+, Brookfield, USA) at 25 °C. Fourier transform infrared (FTIR) spectra were obtained on a PerkinElmer instruments Spectrum GX FTIR spectrometer provided with an attenuated total reflection (ATR) attachment operating in the transmittance mode in a wavenumber range of 400–4000 cm−1. Field emission scanning electron microscopy (FE-SEM, Hitachi S4800) was used to observe the surface morphology of the membrane. To measure the average diameter of the membrane nanofibers, 100 fibers from the SEM micrograph were randomly selected to prepare a diameter distribution. The hydrophilicity of the membranes was measured on a video optical contact angle tester (Drop Meter A-100p, China). The membrane permeability was determined by measuring the permeation of deionized water at a transmembrane pressure of 0.1 MPa. The porosity of the electrospun fiber membrane was determined by the Archimedes method by immersing the dry membrane in n-butanol for 3 h, and the porosity was calculated by the following equation:| |
 | (5) |
where WW is the mass of the absorbed n-butanol, Wd is the mass of pristine membrane, Vm is the volume of electrospun fiber membrane, and ρb is the density of n-butanol.
Electrochemical impedance spectroscopy (EIS) measurements
EIS measurements were carried out on a electrochemical workstation (GAMRY Instruments Reference 3000). The sinusoidal excitation voltage applied to the EF system was 0.01 V, while the frequency ranged from 0.1 to 1000 kHz.
MO decoloration degradation tests in the EF system
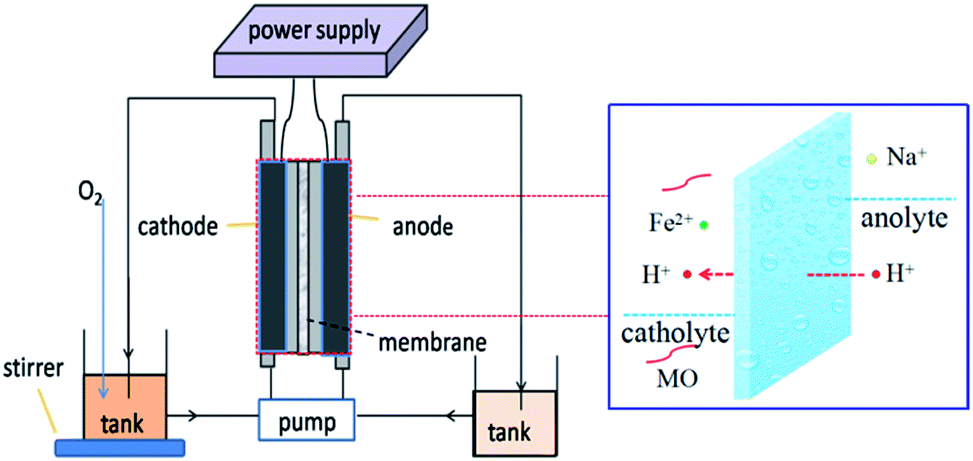
Degradation of MO was carried out in a circular double-chamber cell reactor schematically shown in Fig. 11. A −50 mA galvanostatic electrolysis was also conducted in the reactor by using the electrochemical workstation. GF was employed as both cathode and anode material. The anode cell was filled with a 50 mM NaCl solution and the pH was adjusted to 3 with a HCl solution, while the cathode cell was filled with 0.2 mmol L−1 FeSO4·7H2O and 50 mM Na2SO4 solutions and the pH was adjusted to 3 with a H2SO4 solution.18 Pure O2 was bubbled before starting the EF oxidation into the cathode storage tank for 10 min to generate a highly dissolved oxygen concentration in the cathode and thereby enhance the H2O2 production. A peristaltic pump with a running speed of 50 mL min−1 was used to re-circle the solutions. The concentration of MO was monitored by determining the absorbance at 463 nm on a UV-vis spectrophotometer (UV759, Shanghai Instrument Analysis Instrument Co., Ltd). The TOC of the solution was determined on a Phoenix 8000 TOC analyzer. With the aim to monitor the decolorization/degradation and TOC removal rate of MO, aliquots were withdrawn from the reactor at regular time intervals (i.e., 0, 5, 10, 20, 40, 60, 90, and 120 min) and subsequently analyzed.
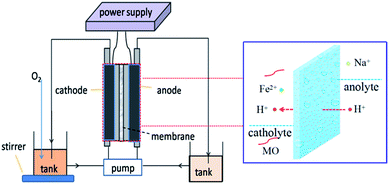 |
| | Fig. 11 Schematic diagram of the double-chamber cell reactor operating in batch recirculation mode. | |
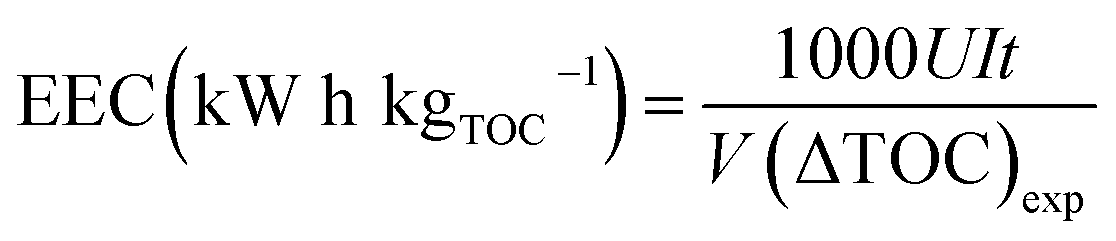
The EEC was calculated with the following formula:18
| |
 | (6) |
where
U is the voltage (V),
I is the applied current (A),
t is the electrolysis time (h),
V is the volume (L), and Δ(TOC)
exp is the experimental TOC removal (mg L
−1).
Conclusions
We reported an effective method for modifying electrospun nanofiber membranes with the aim to increase their hydrophilic performance and obtain excellent electrical conductivity in EF systems. Strong hydrophilicity and fast electron transportation were achieved by the modified samples, thereby efficiently improving the electrocatalytic EF activity. When modified at the optimal concentration of 0.08 M of MPS, the WCA of the membrane decreased from 120 to 6°, thereby greatly improving its hydrophilicity while also reducing the membrane impedance (from 21.9 to 15.7 Ω). Starting with 50 mg L−1 of MO as the model pollutant, the pristine PVDF and PVDF-SO3H membranes showed degradation efficiencies of 87.7 and 96.9% after 10 min, respectively. The TOC removal ratio of the pristine and modified materials reached 78.1 and 92.3% after 2 h, respectively. The modified membrane achieved significantly greater MO degradation and TOC removal rates within the EF system as compared to the untreated material. Thus, the reported modification methodology is a promising membrane modification alternative to improve the conductivity of EF systems.
Acknowledgements
This work is financially supported by the National Natural Science Foundation of China (21676139), the Higher Education Natural Science Foundation of Jiangsu Province (15KJA530001), the Project of Priority Academic Program Development of Jiangsu Higher Education Institutions (PAPD) and Research Fund of state key Laboratory of Materials-Oriented Chemical Engineering (ZK201604).
Notes and references
- I. S. E. B. Oturan and M. A. R. M. Panizza, Environ. Sci. Pollut. Res., 2014, 21, 8336–8367 CrossRef PubMed.
- P. V. Nidheesh, Desalination, 2012, 299, 1–15 CrossRef CAS.
- F. C. Moreira, R. A. R. Boaventura, E. Brillas and V. J. P. Vilar, Appl. Catal., B, 2017, 202, 217–261 CrossRef CAS.
- Z.-X. Wang, Carbohydr. Polym., 2011, 86, 1807–1813 CrossRef CAS.
- A. Maoa, Crit. Rev. Environ. Sci. Technol., 2014, 44, 2577–2641 CrossRef.
- E. Brillas, Chem. Rev., 2009, 109, 6570–6631 CrossRef CAS PubMed.
- H. Zhao, Y. Chen, Q. Peng, Q. Wang and G. Zhao, Appl. Catal., B, 2017, 203, 127–137 CrossRef CAS.
- S. Ignasi and N. Oturan, Appl. Catal., B, 2007, 72, 382–394 CrossRef.
- D. P. Anna and D. P. Luca, J. Appl. Electrochem., 2005, 35, 413–419 CrossRef.
- X. Li, X. Jin, N. Zhao, I. Angelidaki and Y. Zhang, Bioresour. Technol., 2017, 228, 322–329 CrossRef CAS PubMed.
- D. M. A. J. Pedro Zapata, Macromolecules, 2010, 43, 7625–7636 CrossRef.
- R. Zhou, W. Liu and W. L. Yew, ACS Appl. Mater. Interfaces, 2015, 7, 16548–16557 CAS.
- H. Li, Y. Lee, J. Lai and Y. Liu, J. Membr. Sci., 2014, 466, 238–245 CrossRef CAS.
- Y. Su, Y. Liu, D. Wang, J. Lai, Y. Sun, S. Chyou and W. Lee, J. Membr. Sci., 2010, 349(1–2), 244–250 CrossRef CAS.
- M. P. A. F. Sundholm, Chem. Mater., 2003, 15, 4447–4455 CrossRef.
- S. Hietala, S. Holmberg, M. N. Karjalainen, J. Sman, M. Paronen, R. Serimaa, F. Sundholm and S. Vahvaselk, J. Mater. Chem., 1997, 7(5), 721–726 RSC.
- C. C. Ami and A. R. Yang, J. Membr. Sci., 2014, 469, 251–261 CrossRef.
- L. Ma and M. H. Zhou, Electrochim. Acta, 2016, 200, 222–230 CrossRef CAS.
- B. G. Nathaniel and B. Baro, J. Membr. Sci., 2007, 290, 46–54 CrossRef.
- A. Faheem and M. A. Sheikha, Appl. Surf. Sci., 2016, 385, 417–425 CrossRef.
- O. I. E. R. Sanromán, Environ. Sci. Pollut. Res., 2013, 20, 2252–2261 CrossRef PubMed.
- A. R. Khataee, J. Hazard. Mater., 2009, 161, 1225–1233 CrossRef CAS PubMed.
- B. N. B. B. Samiha Hammamia, Chemosphere, 2008, 73, 678–684 CrossRef PubMed.
- I. S. E. E. Abdoulaye Thiam, Water Res., 2015, 81, 178–187 CrossRef PubMed.
- J. Edgar and A. Ruiz, Chemosphere, 2011, 82, 495–501 CrossRef PubMed.
- A. M. Díez, Chem. Eng. J., 2017, 310, 399–406 CrossRef.
- I. S. J. A. Abdoulaye Thiam, Sep. Purif. Technol., 2015, 140, 43–52 CrossRef.
- R. P. Willyam and P. C. Barros, J. Electroanal. Chem., 2014, 722–723, 46–53 Search PubMed.
- Q. Z. Z. H. Guandao Gao, Environ. Sci. Technol., 2015, 49, 2375–2383 CrossRef PubMed.
- E. Mousset, Water Sci. Technol., 2016, 74, 2068–2074 CrossRef CAS PubMed.
- M. Z. M. L. Gengbo Ren, Chem. Eng. J., 2016, 298, 55–67 CrossRef.
Footnote |
| † Yongxiang Zhuang contributed to this work. |
|
| This journal is © The Royal Society of Chemistry 2017 |
Click here to see how this site uses Cookies. View our privacy policy here. 
 Open Access Article
 This Open Access Article is licensed under a
  *a
*a