 Open Access Article
Boosting the photocatalytic H2 evolution activity of Fe2O3 polymorphs (α-, γ- and β-Fe2O3) by fullerene [C60]-modification and dye-sensitization under visible light irradiation†
Ting Song a,
Piyong Zhang
 a,
Jian Zengb,
Tingting Wanga,
Atif Alia and
Heping Zeng*a
aKey Laboratory of Functional Molecular Engineering of Guangdong Province, School of Chemistry and Chemical Engineering, South China University of Technology, Guangzhou 510640, P. R. China. E-mail: hpzeng@scut.edu.cn
bDepartment of Chemistry, National University of Singapore, 3 Science Drive 3, 117543, Singapore
First published on 5th June 2017
Abstract
C60/Fe2O3 nanocomposites are successfully prepared, well characterized, and employed in visible-light-driven photocatalytic H2 production. The Fe2O3 polymorphs show obvious broad-spectrum absorption, even close to the near infrared region (780–900 nm). The H2 production rates of β-Fe2O3 and γ-Fe2O3 are almost 2.1 times and 3.1 times higher than α-Fe2O3 (which itself is close to that of g-C3N4). This demonstrates that carefully controlling the polymorphs can tune the photocatalysts' H2 production properties. After modifying the Fe2O3 polymorphs with C60, the sample with 0.5 wt% C60/β-Fe2O3 has the optimum photocatalytic activity. This result indicates that the strength of the interaction and interfacial contact between C60 and Fe2O3 polymorphs plays an important role in the enhancement of photocatalytic activity, which can improve the transmission efficiency of photogenerated electrons via a conjugated three-dimensional π system. Fluorescein is introduced as a photosensitizer and the optimum mass ratio of fluorescein + 0.5C60/β-Fe2O3 is 1![[thin space (1/6-em)]](https://www.rsc.org/images/entities/char_2009.gif) :
:![[thin space (1/6-em)]](https://www.rsc.org/images/entities/char_2009.gif) 1, which significantly boosts the photocatalytic H2 evolution rate of 0.5C60/β-Fe2O3 from 321.8 to 1665.0 μmol g−1 h−1. Meanwhile, the composites exhibit high stability and reusability.
1, which significantly boosts the photocatalytic H2 evolution rate of 0.5C60/β-Fe2O3 from 321.8 to 1665.0 μmol g−1 h−1. Meanwhile, the composites exhibit high stability and reusability.
Introduction
Solar hydrogen generation is a very attractive area of research. Being free from emission of pollutants and greenhouse gases, it allows the production of clean and renewable energy to compensate for the depletion of fossil fuels and represents a possible solution to environmental pollution and the emerging energy crisis.1–4 In recent decades, several basic methods have been developed to improve the photocatalytic H2 evolution properties of materials, such as doping with other materials,5 surface modification,6 formation of heterostructures,7 formation of composites,8–10 and so on. However, the photocatalytic activity can also be regulated by carefully controlling the phase composition. Due to its well-suited band gap, natural abundance, nontoxicity, environmental compatibility, low cost, and chemical stability, α-Fe2O3 has attracted considerable interest for potential applications.11–13 Iron oxide has four crystal phases: α-Fe2O3, γ-Fe2O3, β-Fe2O3, and ε-Fe2O3.14 According to the literature, α-Fe2O3 has a corundum structure, while γ-Fe2O3 has a defect spinel structure.15,16 β-Fe2O3 has a bixbyite structure.17 Compared with α-Fe2O3, information on the photocatalytic H2 production rate and synthesis of γ-Fe2O3 and β-Fe2O3 are still scarce. Therefore, motivated by this situation that few studies have focused on the Fe2O3 polymorphs, (α-, γ-, β-Fe2O3) are obtained by different synthesis methods. Furthermore, the pure α-Fe2O3 material still suffers from unsatisfactory photocatalytic efficiency owing to the high recombination rate of photogenerated electrons and holes and its low absorption coefficient.18A suitable cocatalyst to modify the metallic oxide can increase the transmission efficiency of photogenerated electrons and provide additional active sites for photocatalytic H2 evolution.19–22 Fullerene [C60] was discovered in 1985 by Kroto et al.23 The C60 fusion structure (diameter 0.7 nm) shows stability, anti-compression performance, high electron affinity, and lower material cost, potentially making it advantageous for application in photocatalytic H2 evolution.24 However, relatively few studies have investigated the use of fullerene as a cocatalyst when compared to the number of studies using highly priced precious metal cocatalysts. It may be difficult to form stronger interactions and interface contacts by using C60-modified semiconductors.
Dyes usually do not show photocatalytic H2 production activity due to the fast recombination of the photogenerated electron–hole pairs under visible light illumination despite their strong ability to absorb visible light.25–27 However, the photocatalytic H2 evolution activity of a photocatalyst is greatly increased under visible light illumination if dye molecules are adsorbed on the surface of the photocatalyst.28–30 Recently, Schmuttenmaer et al. proposed that the overall efficiencies of water-splitting dye-sensitized photoelectron chemical cells (WS-DSPECs) remain low in large part because of poor electron injection into the conduction band (CB) of the oxide support.31 The electrons transfer from the LUMO of the dye to the CB of the oxide support. The dye's HOMO must be more positive than the sacrificial reagent's redox potential and its LUMO must be more negative than the semiconductor's CB.32 Therefore, present research knowledge of the photocatalytic H2 evolution activity of dye-sensitized semiconductors is still insufficient. Furthermore, many metal complex dyes are not suitable for the potential practical applications of capturing and converting solar energy because of their high cost. Fortunately, metal-free organic dyes, such as fluorescein, exhibit low cost, low toxicity, absorption in the visible light region, and high electron injection rates, making them suitable to enhance photocatalytic H2 evolution.33–35
Herein, we report the facile synthesis and detailed characterization of C60/Fe2O3 composites. Iron(III) oxide polymorphs exhibit significantly different photocatalytic H2 evolution properties. The fluorescein-sensitized 0.5C60/β-Fe2O3 composites deliver an extremely high solar-driven hydrogen production rate (1665.0 μmol g−1 h−1) under visible light illumination (λ > 420 nm). Fluorescein is used as a photosensitizer. Fullerene [C60] is exploited to improve the transmission efficiency of photogenerated electrons across the interface of the semiconductor.
Experimental section
Reagents
Ferric nitrate (Fe(NO3)3·9H2O, 99.9%), citric acid (C6H8O7, 99.5%), urea (CH4N2O, 99.5%), ferric chloride (FeCl3·6H2O, 99.0%), ethanediol (C2H6O2, 98.0%), methylbenzene (C7H8, 99.8%), triethanolamine (C6H15NO3, 99.0%), ammonia (NH3, 25.0%), and fullerene (C60, 99.9%) were purchased from Aladdin Co. Ltd. The materials were all utilized without further purification and were all analytically pure. Deionized water was utilized throughout the experiments. Pure g-C3N4 was synthesized directly by calcination of melamine at 550 °C for 4 h at a heating rate of 10 °C min−1.Synthesis of the α-Fe2O3 nanoporous material
The α-Fe2O3 nanoporous material was obtained by the sol–gel method. 16.16 g Fe(NO3)3·9H2O was dissolved in 6.8 mL deionized water to prepare metal ion solution A, and 2.56 g citric acid was dissolved in 4.0 mL ethanediol to prepare the clear and transparent solution B. Next, solution A was dropwise added to solution B to prepare solution C (with a metal ion concentration of 2.5–3.5 mol L−1) under vigorous magnetic stirring. NH3·H2O was used to regulate the pH value of solution C within the range 3–4 and a gel was formed at 70 °C by continuously stirring for 4 h. After gel formation, the gel was dried under vacuum at 70 °C for 10 h to form a xerogel. Finally, the xerogels were heat-treated at 900 °C for 1 h under air atmosphere.Synthesis of the γ-Fe2O3 nanoparticles
20.00 g Fe(NO3)3·9H2O was completely dissolved in 40 mL ethanol under magnetic stirring. 19.60 g urea was added to the Fe(NO3)3·9H2O ethanol solution. The ethanol solution was continually stirred for 2.5 h. After urea was added, the solution became light green and a light green powder was observed to grow on the bottom of the vessel. The light green powder was washed with anhydrous ethanol. After filtration, the powder (Fe(CON2H4)6]·(NO3)3) was dried at room temperature in a Petri dish with a filter paper cover. Finally, the powder was ground and heat-treated at 200 °C for 1 h under air atmosphere.Synthesis of low-dimensional tablet of β-Fe2O3
A low-dimensional tablet made from β-Fe2O3 was synthesized by a hydrothermal reaction. At room temperature, 1.35 g FeCl3·6H2O and 0.3 g urea were slowly added to 10 mL deionized water. Then, 2.6 mL NH3·H2O was added to the clear and transparent solution under vigorous magnetic stirring. Finally, the mixture solution was put in a hydrothermal cell and heated for 6 h at 150 °C in the oven. Then, the obtained solid was washed with ethanol followed by deionized water and dried at 70 °C.Synthesis of the C60/Fe2O3 polymorphs
The C60-modified Fe2O3 nanocomposites were obtained as follows: a known amount of C60 was dissolved completely in 30 mL toluene by sonication for 1 h. Next, to the solution was added the as-synthesized powder (ca. 0.3 g), which was vigorously magnetically stirred for 6 h at ambient temperature. Finally, an opaque powder was obtained by volatilization of the toluene. The opaque powder was washed with ethanol followed by deionized water and dried for 12 h at 80 °C in a vacuum drying oven. In addition, samples synthesized with different mass ratios (wt%) of C60/Fe2O3 (1C60/α-Fe2O3, 1C60/γ-Fe2O3, 1C60/β-Fe2O3, 0.25C60/β-Fe2O3, 0.5C60/β-Fe2O3, 2C60/β-Fe2O3) were prepared by following the same method as above.Characterization
To characterize the structural variation of the materials, X-ray diffraction (XRD) patterns (Bruker D8 Advance) were obtained using graphite monochromatized Cu-Kα (λ = 1.5406 Å) radiation in the 2θ range from 5° to 80°. Fourier transform infrared (FTIR) spectra of the materials were measured on a Bruker Tensor 27 spectrometer with the KBr tabletting method. Raman spectra were measured by a micro-Raman spectrometer (Renishaw InVia) in the backscattering geometry using an Ar ion laser (532 nm) as an excitation source at room temperature. The Brunauer–Emmett–Teller (BET) specific surface area was determined by a surface area and porosity analyzer (ASAP 2020, American) based on nitrogen adsorption and desorption isotherms measured at 77 K. The degasification temperature and the drying time of the samples were 200 °C and 2 h, respectively. Microstructural characterization and the elemental mapping of desired regions were performed by field-emission scanning electron microscopy (FESEM, Hitachi, S-4800) and energy dispersive X-ray analysis (EDX), respectively. Transmission electron microscopy (TEM) images were collected on an FEI Tecnai G2 F20 TEM. The UV-visible diffuse reflectance spectra (DRS, Hitachi U-3010 spectrophotometer) were obtained by the Kubelka–Munk approach with BaSO4 as a reference at room temperature. The room-temperature magnetization curves were measured by means of a vibrating sample magnetometer (VSM, Lakeshore Model 7304). X-ray photoelectron spectroscopy (XPS, Axis Ultra DLD, Kratos) measurements were carried out with a monochromatic X-ray source (Al Kα, 15 kV, 200 W).Photocatalytic H2 production
Photocatalytic experiments for H2 evolution were carried out in a Pyrex reaction cell connected to a closed gas evacuation and circulation system. The composites (0.005 g) were sonicated for 5 min in a 78 mL triethanolamine aqueous solution (10 vol% TEOA, sacrificial reagent). Then the aqueous suspension was degassed for 1 h and irradiated by a 300 W Xe lamp with an ultraviolet cut-off filter (λ > 420 nm) (PLS-SXE300, Trusttech). A flow of cooling water was used to maintain the reaction temperature at room temperature. The content of H2 generated was determined by online gas chromatography (GC7900, Tian Mei, Shanghai) equipped with a 5 Å molecular sieve column and a thermal conductivity detector (TCD) using nitrogen as the carrier gas, as shown in Fig. S1.†Photoelectrochemical measurements
The electrochemical measurements (CHI660C, Electrochemical Instruments) utilized a standard three-electrode system with Na2SO4 (1 mol L−1) aqueous solution as the electrolyte. Ag/AgCl (saturated KCl) and platinum flake were used as the reference electrodes and counter electrodes, respectively. The sample electrodes separately served as the working electrode, which was obtained by using the doctor blade coating method to deposit the suspensions onto indium tin oxide (ITO). The visible light source was a 300 W Xe lamp with an ultraviolet cut-off filter (λ > 420 nm) (PLS-SXE300, Trusttech). The working electrodes were prepared as follows: the nanocomposite (0.05 g) was ground with 0.5 mL deionized water and 0.02 g polyethylene glycol to make a slurry. Next, the slurry was coated onto ITO glass electrodes and these electrolytes were dried at 120 °C for 2 h.Results and discussion
Crystal structure and composition
By comparison with reference inorganic XRD patterns, it was confirmed that the desired Fe2O3 polymorphs (α-Fe2O3 (Fig. S2(a), γ-Fe2O3 (b), β-Fe2O3 (c)†)) had been obtained. It was found that β-Fe2O3 and α-Fe2O3 had similar diffraction peaks. However, those of γ-Fe2O3 were significantly different, suggesting a very different crystal structure for this polymorph. According to the results of the Scherrer equation shown in Table S1,† the particle size of α-Fe2O3 was 47.10 nm, of γ-Fe2O3 was 27.87 nm, and of β-Fe2O3 was 42.48 nm. As shown in Fig. 1, the XRD patterns of the 0.5C60/β-Fe2O3 (wt%) and 1C60/β-Fe2O3 (wt%) samples were unchanged from that of β-Fe2O3, which shows that the adsorption of C60 did not affect the lattice structure of β-Fe2O3. Due to the minimal C60 content, no XRD diffraction peak of C60 was observed. The grinding method was used to mix fluorescein with 0.5C60/β-Fe2O3. In comparison with 0.5C60/β-Fe2O3, the XRD diffraction spectrum of the fluorescein + 0.5C60/β-Fe2O3 sample shows additional diffraction peaks corresponding to the characteristic peaks of fluorescein.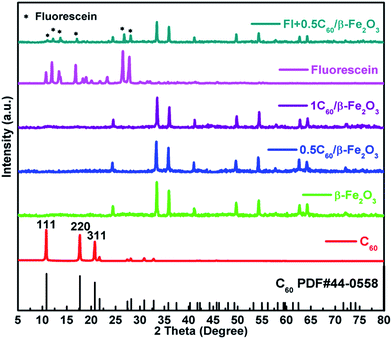 | ||
Fig. 1 X-ray diffraction patterns of C60, fluorescein, 0.5C60/β-Fe2O3, 1C60/β-Fe2O3, and Fl + 0.5C60/β-Fe2O3 (fluorescein + 0.5C60/β-Fe2O3 at a mass ratio of 1![[thin space (1/6-em)]](https://www.rsc.org/images/entities/char_2009.gif) : :![[thin space (1/6-em)]](https://www.rsc.org/images/entities/char_2009.gif) 1). 1). | ||
Fig. S3† depicts the FTIR spectra of the Fe2O3 polymorphs. It shows several bands at 462, 560, 1383, 1680, 2341, and 3430 cm−1. The Fe–O–Fe stretching vibration is responsible for the peaks at 462 and 560 cm−1,36 but the intensities of this stretching vibration are not the same for all samples, which implies that the different synthetic methods produced different Fe2O3 polymorphs. Fig. S4 and S5† present the FTIR spectra of the C60-modified β-Fe2O3 material and fluorescein-sensitized 0.5C60/β-Fe2O3 composites. As can be seen, no prominent infrared absorption peaks were exhibited by pure C60, but the peak intensity of β-Fe2O3 increased after modification with C60. The fluorescein component led to four additional absorption peaks at 1114 cm−1, 1260 cm−1, 1460 cm−1, and 1593 cm−1, which is consistent with the infrared spectrum of pure fluorescein. However, there was no enhancement of the peak intensity of 0.5C60/β-Fe2O3. This fact indicates that C60 and fluorescein have different effects on β-Fe2O3-based systems.
Fig. 2(a) shows that the α-Fe2O3 and β-Fe2O3 samples have similar Raman spectra. For the Fe–O stretching vibration, the primary characteristic peaks appear at 221, 240, 288, 290, 406, 410, and 608 cm−1. However, the peaks at 288 and 406 cm−1 for α-Fe2O3 are at slightly different wavenumbers than the corresponding peaks at 290 and 410 cm−1 for β-Fe2O3. Moreover, the characteristic peaks of γ-Fe2O3 are at 660 and 724 cm−1. The vibration frequencies of the Hg(7), Ag(2), and Hg(8) modes for pristine C60 are 1412, 1460, and 1560 cm−1, respectively, in agreement with the previous report.37 Aside from a major band (Ag(2)) at 1460 cm−1, it was noticeable that the other bands for C60 disappeared (Fig. 2(b)). It is known that C60 can adsorb on the surface of β-Fe2O3 in composite materials.38
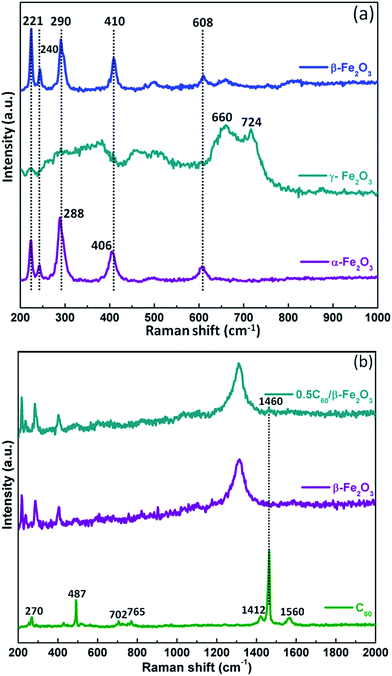 | ||
| Fig. 2 Raman spectra of Fe2O3 polymorphs (a); Raman spectra of C60, β-Fe2O3, and 0.5C60/β-Fe2O3 (b). | ||
As expected, the O1s spectrum can be decomposed into two peaks as shown in Fig. 3(b). The peaks for lattice oxygen and chemisorbed oxygen (hydroxyl groups) are at 529.5 and 530.8 eV, respectively.39 As shown in Fig. 3(c), the main peak at 284.6 eV is ascribed to sp2-hybridized carbon and adventitious carbon from the C60. Defect-containing sp2-hybridized carbon and carboxyl carbon (O![[double bond, length as m-dash]](https://www.rsc.org/images/entities/char_e001.gif) C
C![[double bond, length as m-dash]](https://www.rsc.org/images/entities/char_e001.gif) O) lead to the peaks located at 286.0 and 288.4 eV, respectively.40 The spectrum of Fe2p (Fig. 3(d)) shows two peaks at 710.6 and 724.1 eV (with a splitting energy of 13.5 eV), which is very close to the reported signal.41 This result shows that Fe is in the trivalent state in the 0.5C60/β-Fe2O3 composites.
O) lead to the peaks located at 286.0 and 288.4 eV, respectively.40 The spectrum of Fe2p (Fig. 3(d)) shows two peaks at 710.6 and 724.1 eV (with a splitting energy of 13.5 eV), which is very close to the reported signal.41 This result shows that Fe is in the trivalent state in the 0.5C60/β-Fe2O3 composites.
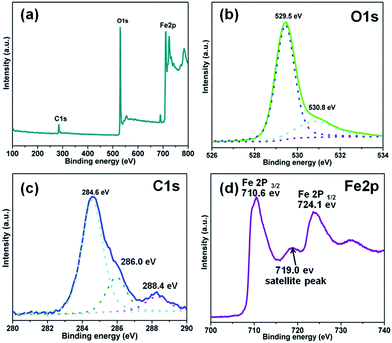 | ||
| Fig. 3 XPS analysis of the 0.5C60/β-Fe2O3 sample. Full-scale XPS spectrum (a), high resolution XPS spectra of O1s (b), C1s (c), and Fe2p (d), respectively. | ||
Morphology
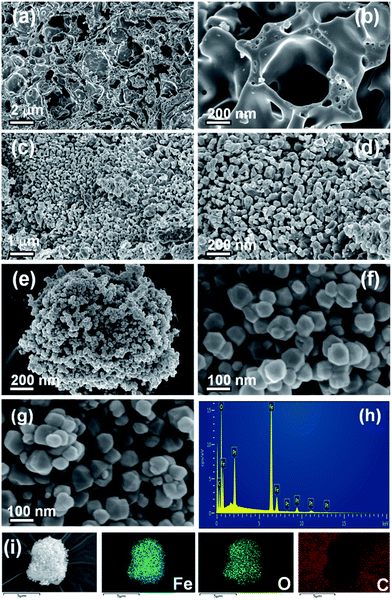
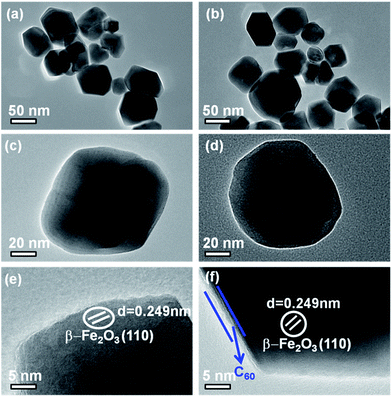
The scanning electron micrograph of the α-Fe2O3 material shows a porous structure, which facilitates the photocatalytic H2 evolution (Fig. 4(a) and (b)). As shown in Fig. 4(c) and (d), the morphology of γ-Fe2O3 consists of a small aggregation of grains or irregular particles. Fig. 4(e) and (f) show the high-magnified images of the β-Fe2O3 composite. The growth of the material in a uniform low-dimensional form was unexpected. A good dispersion of particles can supply more reactive sites for the photocatalytic H2 evolution than aggregated particles can.42 The uniform shape and low-dimensional form of the β-Fe2O3 composite did not change after C60 modification (Fig. 4(g)). In addition, the EDS (Fig. 4(h)) and element mapping from SEM (Fig. 4(i)) indicate the presence of Fe, O, and C.TEM and HRTEM analyses were performed to further investigate the shape and the lattice properties of the β-Fe2O3 and 0.5C60/β-Fe2O3 samples. Consistent with the FESEM observations, Fig. 5(a) and (c) show that β-Fe2O3 did indeed grow in a uniform low-dimensional form. The TEM (HRTEM) images of β-Fe2O3 (Fig. 5(e)) show that the samples are highly crystalline. The lattice spacing was measured as d = 0.249 nm, which is consistent with the (110) plane of β-Fe2O3 (JCPDS no. 89-2810). As shown in Fig. 5(b) and (d), it was found that the crystal structure of β-Fe2O3 was not affected by C60 adsorption, which is consistent with the other characterization results. However, the outer boundary of the β-Fe2O3 material became distinctly different upon C60 adsorption (Fig. 5(f)). It is clear that during the adsorption process, the two phases formed an intimate heterogeneous interface, which has a beneficial effect on the transmission efficiency of photogenerated electrons.43
BET specific surface area and pore textural analysis
The specific surface areas of α-Fe2O3, γ-Fe2O3, and β-Fe2O3 respectively were 1.5418 m2 g−1, 4.7966 m2 g−1, and 13.6316 m2 g−1 (Table S1†). After modification, the surface areas of α-Fe2O3 and γ-Fe2O3 increased, which not only facilitates the transfer of photogenerated electrons, but also provides additional active surface sites.44 However, the instrument was unable to detect the corresponding pore volume and pore size because the surface areas of α-Fe2O3 and γ-Fe2O3 are too small. The pore volume and pore size of β-Fe2O3, respectively, were 0.03114 cm3 g−1 and 9.1375 nm. Compared with β-Fe2O3, the C60-modified β-Fe2O3 samples have smaller BET specific surface areas. This is because the introduction of C60 molecules occupied some of the space and filled some of the pores of β-Fe2O3.Optical absorption and magnetic properties
The Fe2O3 polymorph materials obtained by different methods exhibit strong absorption of visible light and even the closest part of the near-infrared region (780–900 nm) (Fig. 6(a)). This excellent light absorption performance is better than that of any existing single photocatalyst at present, and is conducive to the conversion and application of solar energy. As shown in Fig. S6,† the band gaps of α-Fe2O3, γ-Fe2O3, and β-Fe2O3 were respectively 1.60 eV, 1.61 eV, and 1.91 eV. Primarily due to C60 being a visible light photosensitizer, the visible light absorption intensity of β-Fe2O3 material is known to be increased by C60.45 Furthermore, β-Fe2O3 itself already has better light absorption properties than pure fluorescein. Therefore, the light absorption strength of the 0.5C60/β-Fe2O3 sample was not further improved by the inclusion of fluorescein molecules. The effects of fluorescein and C60 on the β-Fe2O3 composite are thus notably different.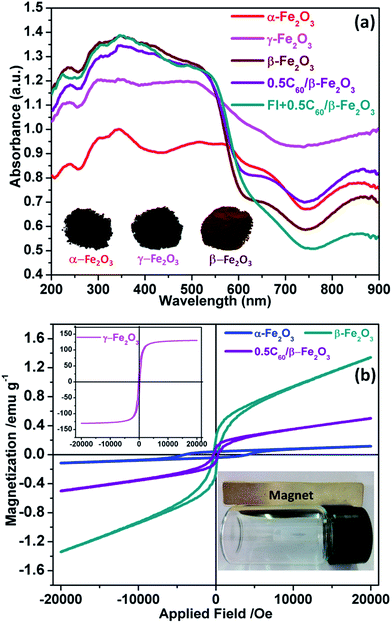 | ||
| Fig. 6 UV-vis diffuse reflectance spectra of the as-prepared samples (a); in-plane measurements of the magnetic properties of the as-prepared samples (b). | ||
The magnetization curve of the as-prepared sample at room temperature is shown in Fig. 6(b). The magnetization values obtained at 2 × 10⁴ Oe are approximately 0.11, 131.53, 1.34, and 0.48 emu g−1 for α-Fe2O3, γ-Fe2O3, β-Fe2O3, and 0.5C60/β-Fe2O3, respectively. As can be seen, the nano-sized γ-Fe2O3 exhibits strong magnetic properties at room temperature. The magnetic strength order of Fe2O3 polymorphs is γ-Fe2O3 > β-Fe2O3 > α-Fe2O3. Furthermore, the magnetic properties of the as-prepared samples allow them to be easily separated from the aqueous solutions compared with other, nonmagnetic photocatalysts, which facilitates their practical application as photocatalysts.
Photocatalytic H2 production and stability
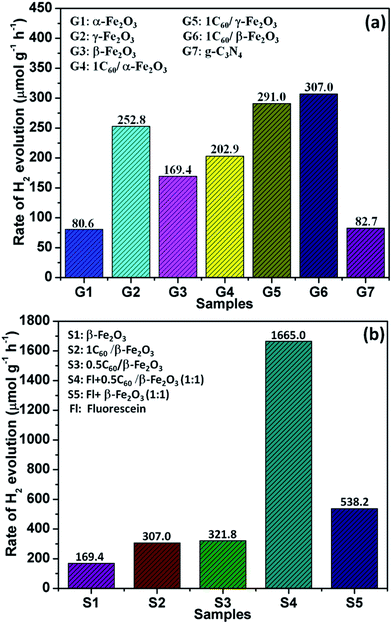
The photocatalytic H2 evolution ability of the C60/Fe2O3 and fluorescein-sensitized 0.5C60/β-Fe2O3 composites were compared in 10 vol% triethanolamine (TEOA) aqueous solution under visible light illumination (λ > 420 nm), as shown in Fig. 7. As shown in Fig. 7(a), the photocatalytic H2 evolution rate of α-Fe2O3 under these conditions was 80.6 μmol h−1 g−1, that of γ-Fe2O3 was 252.8 μmol h−1 g−1, and that of β-Fe2O3 was 169.4 μmol h−1 g−1. The H2 production rates of β-Fe2O3 and γ-Fe2O3 are almost 2.1 and 3.1 times higher than α-Fe2O3 (which itself is close to that of g-C3N4), respectively. The different light absorbing characteristics, specific surface areas, and particle sizes are responsible for the different photocatalytic H2 evolution activities of the Fe2O3 polymorphs. The photocatalytic H2 evolution activity of all the Fe2O3 polymorphs was improved by C60 modification. This result indicated that the intense interaction between C60 and Fe2O3 polymorphs played a key role in the improvement of photocatalytic activity, by improving the transmission efficiency of photogenerated electrons. Therefore, the 0.5C60/β-Fe2O3 sample exhibits a more efficient H2 release rate than pure β-Fe2O3. Next, the β-Fe2O3 materials modified with different contents of C60 as cocatalyst were evaluated for photocatalytic H2 evolution under visible light irradiation (Fig. S7†). With the addition of C60 in amounts below 0.5 wt%, the rates of H2 evolution increase with the C60 content. In contrast, the rate of H2 production decreases with increasing C60 content when the C60 is present at more than 0.5 wt%. This may be because excess C60 increased photon absorption and scattering.46 Thus, the 0.5C60/β-Fe2O3 sample is the best performing photocatalyst. However, because C60 does not have the ability to produce hydrogen under visible light irradiation by itself, its presence in the β-Fe2O3 material may limit the photocatalytic H2 evolution activity of the 0.5C60/β-Fe2O3 composite. This drawback was effectively overcome by the fluorescein-sensitized 0.5C60/β-Fe2O3 sample. As shown in Fig. 7(b) and S8,† the Fl + 0.5C60/β-Fe2O3 (1![[thin space (1/6-em)]](https://www.rsc.org/images/entities/char_2009.gif) :
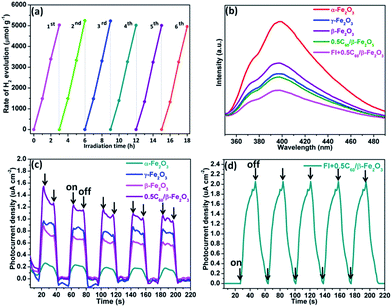
:![[thin space (1/6-em)]](https://www.rsc.org/images/entities/char_2009.gif) 1) sample is the best-performing of all the tested catalysts with an H2 production rate of 1665.0 μmol g−1 h−1. This implies that fluorescein molecules are adsorbed on the surface of the low-dimensional β-Fe2O3 material, thus widening the electron transport channels.47,48 As shown in Fig. 8(a), to evaluate the cycle stability of this sample, repeat cycles of photocatalytic H2 production (each cycle lasting 3 h in an experimental vacuum) were performed. The rate of photocatalytic H2 evolution was not observed to reduce after six consecutive cycles, indicating that the Fl + 0.5C60/β-Fe2O3 composite has good cycle stability. Its structural stability can be clearly seen from the XRD diffraction peaks and infrared spectrum peaks (Fig. S9†).49
1) sample is the best-performing of all the tested catalysts with an H2 production rate of 1665.0 μmol g−1 h−1. This implies that fluorescein molecules are adsorbed on the surface of the low-dimensional β-Fe2O3 material, thus widening the electron transport channels.47,48 As shown in Fig. 8(a), to evaluate the cycle stability of this sample, repeat cycles of photocatalytic H2 production (each cycle lasting 3 h in an experimental vacuum) were performed. The rate of photocatalytic H2 evolution was not observed to reduce after six consecutive cycles, indicating that the Fl + 0.5C60/β-Fe2O3 composite has good cycle stability. Its structural stability can be clearly seen from the XRD diffraction peaks and infrared spectrum peaks (Fig. S9†).49
Clarification of the mechanism
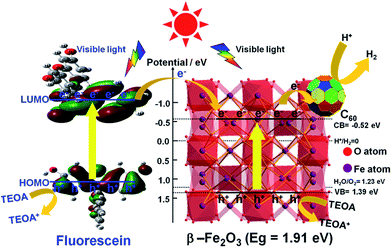
The emission spectra of the α-Fe2O3, γ-Fe2O3, β-Fe2O3, 0.5C60/β-Fe2O3, and Fl + 0.5C60/β-Fe2O3 composites have similar broad emission bands, but the samples differ in the intensity of emissions (Fig. 8(b)). When the intensity of emissions is higher, it can be concluded that the recombination of the photogenerated electron–hole pairs is increased. The results show that C60 improved the transmission efficiency of photogenerated electrons, thus reducing the recombination of the photogenerated electron–hole pairs. Furthermore, the emission intensity of the Fl + 0.5C60/β-Fe2O3 composite is lower than 0.5C60/β-Fe2O3, which is consistent with the greater H2 production rate of the former. To provide further detail, the transient photocurrent responses were recorded for α-Fe2O3, γ-Fe2O3, β-Fe2O3, and 0.5C60/β-Fe2O3 sample photoelectrodes for several on–off cycles under visible light irradiation, as shown in Fig. 8(c). The higher the photocurrent value, the higher the separation efficiency of photogenerated electrons–holes. The photocurrents quickly increased to a certain value after the lamp was turned on, and quickly returned to zero when the lamp was turned off. This method was repeated five times. As can be seen, the photocurrent values of α-Fe2O3, γ-Fe2O3, β-Fe2O3, and 0.5C60/β-Fe2O3 are consistent with the rate of photocatalytic H2 evolution. However, upon adding fluorescein, the current shape of the 0.5C60/β-Fe2O3 sample changes (Fig. 8(d)). The photocurrent value does not return to zero when the lamp is switched off. Under visible light irradiation, fluorescein molecules are excited to generate electrons in the LUMO, and these electrons migrate from fluorescein to the CB of β-Fe2O3. Finally, via a long, three-dimensionally conjugated π bond, the fluorescein electrons are transported to the ITO support by C60. Some of these electrons may still be traveling along the transmission path when the visible light is switched off. This would explain the observed photocurrent behavior.On the basis of the above experiments, proposed transfer mechanisms of the photo-generated electrons in the fluorescein-sensitized 0.5C60/β-Fe2O3 composites are shown in Fig. 9. By linearly extrapolating the leading edge of the valence band (VB) of the XPS of β-Fe2O3 to the base line (Fig. S10†), its VB level was determined to be +1.39 eV. The band gap of β-Fe2O3 was determined to be 1.91 eV, with the corresponding CB position at −0.52 eV. According to previous reports, the LUMO of fluorescein is more negative than the CB of β-Fe2O3, while the HOMO of fluorescein is more positive than the redox potential of TEOA.50 Under visible light irradiation, fluorescein and β-Fe2O3 are excited to produce electrons (e−) in the LUMO of fluorescein and the CB of the β-Fe2O3 composite, leaving corresponding holes (h+) in the HOMO and VB. The fluorescein electrons are then injected into the CB of β-Fe2O3. After this, the electrons tend to move rapidly towards the surface of the C60 via the intimate heterogeneous interface, which has a positive effect on the transmission efficiency of the photogenerated electrons. Finally, the electrons react with H+ to generate H2 on the C60 surface. Due to the unique electronic properties of C60, containing a highly three-dimensionally delocalized π electron system, it is advantageous for accelerating electron transfer, thereby increasing the rate of H2 evolution. In the meantime, the fluorescein and β-Fe2O3, which accumulate holes, can react with TEOA. Fig. S11 and S12† summarize the specific H2 evolution process.
Conclusions
In summary, iron(III) oxide polymorphs are respectively obtained by different synthetic methods, which are easier, cheaper, and consume less energy than alternative methods. Even close to the near infrared region (780–900 nm), the Fe2O3 polymorphs clearly show broad visible light absorption. The magnetic properties of materials based on these Fe2O3 polymorphs are favorable for potential practical application in photocatalytic H2 evolution. The particle size is probably the most important factor among the variety of factors found to affect the H2 production activity of Fe2O3 polymorphs. The 0.5C60/β-Fe2O3 (wt%) sample has the optimum photocatalytic activity among the C60-modified Fe2O3 polymorphs. With conjugated three-dimensional π systems, formation of interfacial contacts, and strong C60–Fe2O3 interactions, the C60-modified Fe2O3 polymorphs show improved transmission efficiency of photo-generated electrons. If fluorescein is introduced as a photosensitizer, the optimum mass ratio of fluorescein + 0.5C60/β-Fe2O3 is 1![[thin space (1/6-em)]](https://www.rsc.org/images/entities/char_2009.gif) :
:![[thin space (1/6-em)]](https://www.rsc.org/images/entities/char_2009.gif) 1, which significantly boosts the photocatalytic H2 evolution of 0.5C60/β-Fe2O3 (321.8 μmol h−1 g−1) to 1665.0 μmol g−1 h−1. Moreover, the composites remain highly stable and can withstand repeated use. We hope that this research will attract close attention to the use of Fe2O3 polymorphs for the potential practical applications of capturing and converting solar energy.
1, which significantly boosts the photocatalytic H2 evolution of 0.5C60/β-Fe2O3 (321.8 μmol h−1 g−1) to 1665.0 μmol g−1 h−1. Moreover, the composites remain highly stable and can withstand repeated use. We hope that this research will attract close attention to the use of Fe2O3 polymorphs for the potential practical applications of capturing and converting solar energy.
Acknowledgements
We are extremely grateful to the research fund of the Key Laboratory of Fuel Cell Technology of Guangdong Province, and the National Natural Science Foundation of China (No. 21571064, 21371060) for financial support. We thank Benjamin J. Deibert for proof-reading this article.Notes and references
- A. Fujishima and K. Honda, Nature, 1972, 238, 37 CrossRef CAS PubMed.
- X. Chen, S. Shen, L. Guo and S. S. Mao, Chem. Rev., 2010, 110, 6503 CrossRef CAS PubMed.
- M. S. Dresselhaus and I. L. Thomas, Nature, 2001, 414, 332 CrossRef CAS PubMed.
- T. Song, L. Zhang, P. Y. Zhang, J. Zeng, T. T. Wang, A. Ali and H. P. Zeng, J. Mater. Chem. A, 2017, 5, 6013 CAS.
- J. R. Ran, T. Y. Ma, G. P. Gao, X. W. Du and S. Z. Qiao, Energy Environ. Sci., 2015, 8, 3708 CAS.
- Y. Choi, H. Kim, G. H. Moon, S. W. Jo and W. Y. Choi, ACS Catal., 2016, 6, 821 CrossRef CAS.
- Y. P. Xie, Z. B. Yu, G. Liu, X. L. Ma and H. M. Cheng, Energy Environ. Sci., 2014, 7, 1895 CAS.
- K. Maeda, M. Eguchi and T. Oshima, Angew. Chem., Int. Ed., 2014, 53, 13164 CrossRef CAS PubMed.
- X. Wang, Q. Xu, M. R. Li, S. Shen and C. Li, Angew. Chem., Int. Ed., 2012, 51, 13089 CrossRef CAS PubMed.
- Y. Liao, W. Que, Q. Jia, Y. He, J. Zhang and P. Zhong, J. Mater. Chem., 2012, 22, 7937 RSC.
- J. X. Zhu, Z. Y. Yin, D. Yang, T. Sun, H. Yu, H. E. Hoster, H. H. Hng, H. Zhang and Q. Y. Yan, Energy Environ. Sci., 2013, 6, 987 CAS.
- G. Y. Rao, Q. Y. Zhang, H. L. Zhao, J. T. Chen and Y. Li, Chem. Eng. J., 2016, 302, 633 CrossRef CAS.
- S. Sakurai, A. Namai, K. Hashimoto and S. Ohkoshi, J. Am. Chem. Soc., 2009, 131, 18299 CrossRef CAS PubMed.
- G. Carraro, D. Barreca and P. Fornasiero, Adv. Funct. Mater., 2014, 24, 372 CrossRef CAS.
- K. F. Zhao, H. L. Tang, B. T. Qiao, L. Li and J. H. Wang, ACS Catal., 2015, 5, 3528 CrossRef CAS.
- L. Q. Guo, F. Chen, X. Q. Fan, W. D. Cai and J. L. Zhang, Appl. Catal., B, 2010, 96, 162 CrossRef CAS.
- A. Rathi, M. B. Gawande, J. R. Pechousek and R. Zborila, Green Chem., 2016, 18, 2363 RSC.
- M. Mishra and D. M. Chun, Appl. Catal., A, 2015, 498, 126 CrossRef CAS.
- I. Paramasivam, H. Jha, N. Liu and P. Schmuki, Small, 2012, 8, 3073 CrossRef CAS PubMed.
- R. B. Jiang, B. X. Li, C. H. Fang and J. F. Wang, Adv. Mater., 2014, 26, 5274 CrossRef CAS PubMed.
- Z. k. Zheng, T. Tachikawa and T. Majima, J. Am. Chem. Soc., 2015, 137, 948 CrossRef CAS PubMed.
- H. B. Fu, T. G. Xu, S. B. Zhu and Y. F. Zhu, Environ. Sci. Technol., 2008, 42, 8064 CrossRef CAS PubMed.
- H. W. Kroto, J. R. Heath, S. C. O. Brien, R. F. Curl and R. E. Smalley, Nature, 1985, 318, 162 CrossRef CAS.
- S. E. Zhu, F. Li and G. W. Wang, Chem. Soc. Rev., 2013, 42, 7535 RSC.
- Y. Bai, I. MoraSeró, F. D. Angelis, J. Bisquert and P. Wang, Chem. Rev., 2014, 114, 10095 CrossRef CAS PubMed.
- R. Abe, K. Shinmei, N. Koumura, K. Hara and B. Ohtani, J. Am. Chem. Soc., 2013, 135, 16872 CrossRef CAS PubMed.
- J. R. Swierk and T. E. Mallouk, Chem. Soc. Rev., 2013, 42, 2357 RSC.
- A. Kruth, S. Hansen, T. Beweries, V. Brüser and K. D. Weltmann, ChemSusChem, 2013, 6, 152 CrossRef CAS PubMed.
- T. Toyao, M. Saito, S. Dohshi, K. Mochizuki, M. Iwata, H. Higashimura, Y. Horiuchi and M. Matsuoka, Chem. Commun., 2014, 50, 6779 RSC.
- X. H. Zhang, U. Veikko, J. Mao, P. Cai and T. Y. Peng, Chem.–Eur. J., 2012, 18, 12103 CrossRef CAS PubMed.
- J. R. Swierk, N. S. McCool, C. T. Nemes, T. E. Mallouk and C. A. Schmuttenmaer, J. Phys. Chem. C, 2016, 120, 5940 CAS.
- X. H. Zhang, T. Y. Peng and S. S. Song, J. Mater. Chem. A, 2016, 4, 2365 CAS.
- D. P. Wu, K. Cao, F. J. Wang, H. J. Wang, Z. Y. Gao, F. Xu, Y. M. Guo and K. Jiang, Chem. Eng. J., 2015, 280, 441 CrossRef CAS.
- C. Kong, S. X. Min and G. X. Lu, ACS Catal., 2014, 4, 2763 CrossRef CAS.
- Y. P. Yuan, L. S. Yin, S. W. Cao, G. S. Xu, C. H. Li and C. Xue, Appl. Catal., B, 2015, 168, 572 CrossRef.
- H. Y. Zhu, R. Jiang, L. Xiao and W. Li, J. Hazard. Mater., 2010, 179, 251 CrossRef CAS PubMed.
- X. J. Bai, L. Wang, Y. J. Wang, W. Q. Yao and Y. F. Zhu, Appl. Catal., B, 2014, 152, 262 CrossRef.
- J. P. Huo and H. P. Zeng, J. Mater. Chem. A, 2015, 3, 6258 CAS.
- A. E. Kandjani, Y. M. Sabri, S. R. Periasamy, A. Nafady and S. K. Bhargava, Langmuir, 2015, 31, 10922 CrossRef CAS PubMed.
- B. K. Vijayan, N. M. Dimitrijevic, D. F. Shapiro, J. S. Wu and K. A. Gray, ACS Catal., 2012, 2, 223 CrossRef CAS.
- P. M. Rao and X. L. Zheng, Nano Lett., 2011, 11, 2390 CrossRef CAS PubMed.
- X. Zhang, M. I. Zhou and L. Lei, Carbon, 2005, 43, 1700 CrossRef CAS.
- S. H. Yang, X. F. Song, P. Zhang, J. Sun and L. Gao, Small, 2014, 10, 2270 CrossRef CAS PubMed.
- R. M. Navarro, M. C. A. Galvan, J. A. V. DelaMano, S. M. A. Zahrani and J. L. G. Fierro, Energy Environ. Sci., 2010, 3, 1865 CAS.
- M. X. Sun, Y. Wang, Y. L. Fang, S. F. Sun and Z. S. Yu, J. Alloys Compd., 2016, 684, 335 CrossRef CAS.
- S. B. Zhu, T. G. Xu, H. B. Fu, J. C. Zhao and Y. F. Zhu, Environ. Sci. Technol., 2007, 41, 6234 CrossRef CAS PubMed.
- J. C. D. Faria, A. J. Campbell and M. A. McLachlan, Adv. Funct. Mater., 2015, 25, 4657 CrossRef CAS.
- M. W. Mara, D. N. Bowman, E. Jakubikova and L. X. Chen, J. Am. Chem. Soc., 2015, 137, 9670 CrossRef CAS PubMed.
- P. Y. Zhang, T. Song, T. T. Wang and H. Zeng, Appl. Catal., B, 2017, 206, 328 CrossRef CAS.
- X. H. Zhang, T. Y. Peng, L. J. Yu, R. J. Li, Q. Q. Li and Z. Li, ACS Catal., 2015, 5, 504 CrossRef CAS.
Footnote |
| † Electronic supplementary information (ESI) available. See DOI: 10.1039/c7ra03451b |
| This journal is © The Royal Society of Chemistry 2017 |

