 Open Access Article
Creative Commons Attribution 3.0 Unported Licence
Synthesis and electrochemical performance of NaV6O15 microflowers for lithium and sodium ion batteries†
Fang Hu a,
Wei Jianga,
Yidi Donga,
Xiaoyong Lai
 b,
Li Xiaoa and
Xiang Wu*a
aSchool of Materials Science and Engineering, Shenyang University of Technology, Shenyang 110870, P. R. China. E-mail: wuxiang05@163.com; wuxiang05@sut.edu.cn
bState Key Laboratory of High-efficiency Utilization of Coal and Green Chemical Engineering, College of Chemistry and Chemical Engineering, Ningxia University, Yinchuan 750021, P. R. China
First published on 6th June 2017
Abstract
Hierarchical NaV6O15 flower-like structures were successfully synthesized via a facile hydrothermal reaction combined with subsequent thermal transformation. The as-prepared NaV6O15 microflowers are composed of many nanoneedles with a width of about 200 nm and a length of several micrometers. The electrochemical performance of NaV6O15 microflowers as cathodes for both lithium and sodium ion batteries are investigated. High first discharge capacities of 255 mA h g−1 (vs. Li+/Li) and 130 mA h g−1 (vs. Na+/Na) are observed and the capacity retention reaches 105% and 64% after 50 cycles under 4–1.5 V at a current density of 100 mA g−1 and 50 mA g−1, respectively. High lithium/sodium ion diffusion coefficients play an important role in improving the electrochemical performance of NaV6O15 microflowers.
1. Introduction
Recently, there has been increasing interest in rechargeable lithium-ion batteries (LIBs) and sodium-ion batteries (NIBs) because of their inherent advantages such as high specific energy density, long cycle life as well as environmental benignity.1–8 Especially, due to abundant sodium resources and potential low cost, NIBs have attracted much interest as an alternative to LIBs in large scale energy storage systems9,10 However, Na+ has a larger size (1.06 Å) than that of Li+ (0.76 Å), which makes it difficult for sodium ions to quickly insert/extract from the host materials.11 As a result, most common electrode materials for LIBs are unsuitable to accommodate sodium ions.12–15 Therefore, it is of great importance to develop new electrode materials for both LIBs and SIBs.Vanadium oxide possesses good reactive activity because of its variable oxidation states from +5 in V2O5 to +2 in VO. Especially, V2O5 could present various phase transformations during Li+/Na+ intercalation/deintercalation process. For different intercalated amounts of Li+/Na+, the theoretical capacities is up to 442 mA h g−1 and 236 mA h g−1 for Li3V2O5 and Na2V2O5, respectively. However, LixV2O5 or NaxV2O5 with an intercalated amount x > 1 suffers a significant capacity loss during Li+/Na+ intercalation/deintercalation process, leading to a poor cycling performance.16,17 A possible strategy is to introduce second metal cations, such as Na+ and NH4+, into V2O5 interlayer, which could support V2O5 layers as “pillars” and generate a fast Li+/Na+ diffusion path.18–20 At present, many types of synthesis methods for NaV6O15 (β-Na0.33V2O5), such as solid–state reaction,21 sol–gel method22 and hydrothermal method,23,24 have been attempted to improve its electrochemical performances. Among various morphologies of NaV6O15 structures, nanosheets,25 microspheres26 and nanoflakes,27 can improve electrochemical performance of the batteries further. For example, Lu et al. reported hydrothermal synthesis of β-Na0.33V2O5 nanosheets, which exhibited a discharge capacity of 258 mA h g−1 at the current density of 150 mA g−1 and the capacity retention of 70.2% after 50 cycles.25 Wang and his coworkers prepared β-Na0.33V2O5 nanorods, which delivered desirable discharge capacity of 223.9 mA h g−1 at 60 mA g−1 with high capacity retention of 81.3% after 50 cycles.28 Jiang's group obtained NaV6O15 nanoplates with a discharge capacity of 116 mA h g−1 (vs. Na+/Na) and a cycle retention of 55% after 30 cycles at the current density of 50 mA g−1.29
Herein, we report novel hierarchical NaV6O15 microflowers synthesized by a facile hydrothermal reaction combined with subsequent thermal transformation. Electrochemical properties of NaV6O15 microflowers as cathodes for both lithium and sodium ion batteries are investigated. High first discharge capacity of 255 mA h g−1 (vs. Li+/Li) and 130 mA h g−1 (vs. Na+/Na) are observed and capacity retentions reach 105% and 64% after 50 cycles under 4–1.5 V at the current density of 100 mA g−1 and 50 mA g−1, respectively. More importantly, Li/Na ion diffusion coefficients of NaV6O15 cathode material is proposed and verified.
2. Experimental
All the reagents were of analytical grade and used without further purification. In a typical procedure, 0.24 g NaOH, 0.234 g NH4VO3 and 0.053 g Na2CO3 were added together to a beaker with 50 mL of distilled water and the solution was stirred at 90 °C for 20 min. Then, put the beaker into cool water. 1 mL 3% H2O2 was dissolved in the solution and stirred about 2 min. The solution was adjusted to pH ≈ 2 by the titration of 2 mol L−1 HCl and kept for stirring about 30 min. Finally, the orange solution was thrown into a 50 mL autoclave and subjected to hydrothermal treatment at 200 °C for 24 h. And then, the autoclave was naturally cooled down and yellow precipitates were collected, followed with wash with distilled water and alcohol for several times, and finally dried at 110 °C. The resultant product was heated in air atmosphere at 400 °C for 4 h with an increasing rate of 3 °C min−1.The powder X-ray diffraction (XRD) patterns were obtained by an XRD-7000 diffractometer attached with Cu Kα radiation. The scan step was 6° min−1 and the tube current and voltage were 30 mA and 40 kV, respectively. Scanning electron microscope (SEM) images were recorded by a JSM-6700F, operated at 5.0 kV. Transmission electron microscope (TEM) images were obtained by an FEI Tecnai G2. The nitrogen adsorption–desorption isotherms at the temperature of liquid nitrogen (77 K) were measured on VSorb 4800P Surface Area and Pore Porosimetry Analyzer (Gold Spectrum Technology Co., Ltd., China) with prior degassing under vacuum for 4 h at 200 °C. Total pore volumes were determined using the adsorbed volume at a relative pressure of 0.99. The multi-point Brunauer–Emmett–Teller (BET) surface area was estimated from the relative pressure range from 0.05 to 0.2. The pore size distribution of all the materials was analyzed from the desorption isotherm using the Barrett–Joyner–Halenda (BJH) method.
Electrochemical tests were performed by using a coin battery cell, where a metallic lithium foil was used as the anode electrode. NaV6O15 active material (80%, mass fraction) were blended with acetylene black (10%, mass fraction) and poly-vinylidenefluoride (PVDF, 10%, mass fraction). The resultant slurry was pasted on an Al foil as cathode electrode and then dried in a vacuum oven. Each electrode (8 × 8 mm2) contain 2 mg of active material. 1 mol L−1 lithium hexafluorophosphate (LiPF6) dissolved in ethylene carbonate (EC), dimethyl carbonate (DMC) and ethyl methyl carbonate (EMC) (EC![[thin space (1/6-em)]](https://www.rsc.org/images/entities/char_2009.gif) :
:![[thin space (1/6-em)]](https://www.rsc.org/images/entities/char_2009.gif) DMC
DMC![[thin space (1/6-em)]](https://www.rsc.org/images/entities/char_2009.gif) :
:![[thin space (1/6-em)]](https://www.rsc.org/images/entities/char_2009.gif) EMC = 1
EMC = 1![[thin space (1/6-em)]](https://www.rsc.org/images/entities/char_2009.gif) :
:![[thin space (1/6-em)]](https://www.rsc.org/images/entities/char_2009.gif) 1
1![[thin space (1/6-em)]](https://www.rsc.org/images/entities/char_2009.gif) :
:![[thin space (1/6-em)]](https://www.rsc.org/images/entities/char_2009.gif) 8, by v/v ratio) was used as electrolyte. For Na coin cells, the electrolyte was 1 mol L−1 NaClO4 dissolved in a solvent mixture of ethylene carbonate (EC) and propylene carbonate (PC) (1
8, by v/v ratio) was used as electrolyte. For Na coin cells, the electrolyte was 1 mol L−1 NaClO4 dissolved in a solvent mixture of ethylene carbonate (EC) and propylene carbonate (PC) (1![[thin space (1/6-em)]](https://www.rsc.org/images/entities/char_2009.gif) :
:![[thin space (1/6-em)]](https://www.rsc.org/images/entities/char_2009.gif) 1 v/v) and 5% FEC. Galvanostatic charge–discharge cycling was carried out with an automatic battery tester (Land-2100, China) in the voltage window of 1.5–4.0 V. Cyclic voltammetry was performed with a VSP multichannel potentiostatic–galvanostatic system (Bio-Logic) at a scanning rate of 0.05, 0.1, 0.15, 0.2, 0.25 and 0.3 mV s−1, respectively.
1 v/v) and 5% FEC. Galvanostatic charge–discharge cycling was carried out with an automatic battery tester (Land-2100, China) in the voltage window of 1.5–4.0 V. Cyclic voltammetry was performed with a VSP multichannel potentiostatic–galvanostatic system (Bio-Logic) at a scanning rate of 0.05, 0.1, 0.15, 0.2, 0.25 and 0.3 mV s−1, respectively.
3. Results and discussion
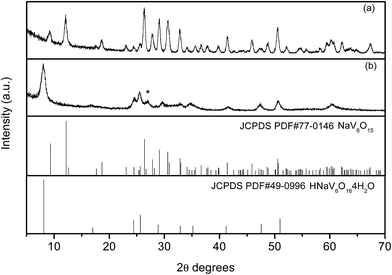
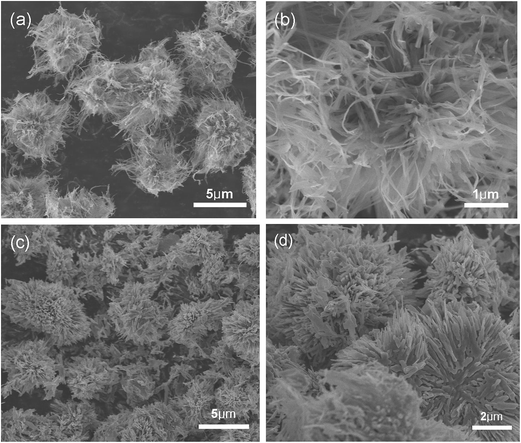
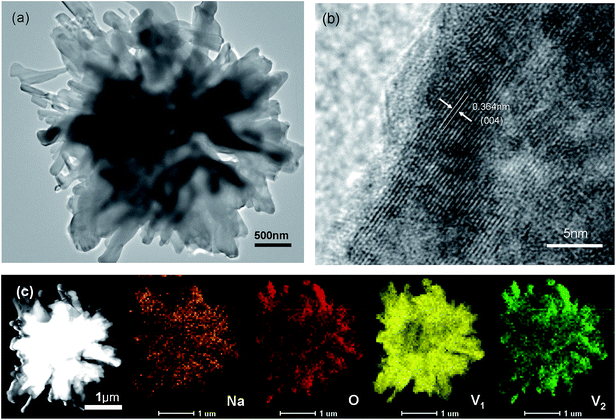
XRD patterns of the as-synthesized precursor and resultant NaV6O15 product are showed in Fig. 1, respectively. The diffraction peaks of the as-synthesized precursor could be well indexed to HNaV6O16·4H2O phase (JCPDS no. 49-0996) except for an unknown diffraction peak at about 2θ = 26.9°. After heated at 400 °C, all the peaks can be well indexed to monoclinic layered NaV6O15 phase (JCPDS No. 24-1155), and no other impurities are detected.General SEM images of HNaV6O16·4H2O and NaV6O15 samples are shown in Fig. 2a. HNaV6O16·4H2O are mainly some microflowers with a diameter of about 5 μm. High magnification SEM images in Fig. 2b shows the microflowers are composed of some nanobelts with a width of about 100 nm and a length of several micrometers. Fig. 2c and d show SEM images of NaV6O15 sample, which reveal that the nanobelts are melt to nanoneedles-like with a width of about 200 nm. After calcined at 500 °C, NaV6O15 microflowers are melted further to microcrystals with the size of about 1 μm (Fig. S1†). NaV6O15 microflowers are further investigated by TEM as shown in Fig. 3. The distance between the neighboring fringes is about 0.364 nm, which is consistent with that of the (004) plane of monoclinic layered NaV6O15. The mappings of different elements from NaV6O15 microflowers are shown in Fig. 3c. It shows that Na, V and O elements are all uniformly distributed.
Nitrogen adsorption–desorption isotherms and the corresponding pore size distribution curves of NaV6O15 microflowers is shown in Fig. 4. The isothermal curve is of typical IV type, which indicates the porous characteristic of NaV6O15 microflowers. According to multi-point BET method, a high specific surface area of 54 m2 g−1 is achieved with an average pore size of 6.4 nm and a large pore volume of 0.15 cm3 g−1. It is well known that nanoscale materials with high surface area can decreases effective diffusion path and increases surface area for insertion and extraction of Li+/Na+, all of which are beneficial to the battery performance.30,31
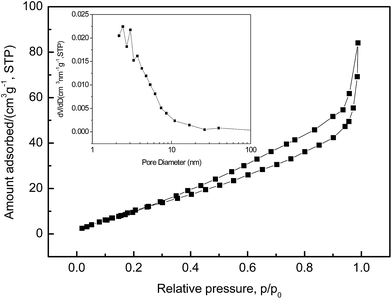 | ||
| Fig. 4 Nitrogen adsorption–desorption isotherms and pore size distribution curves (in set) of NaV6O15 microflowers. | ||
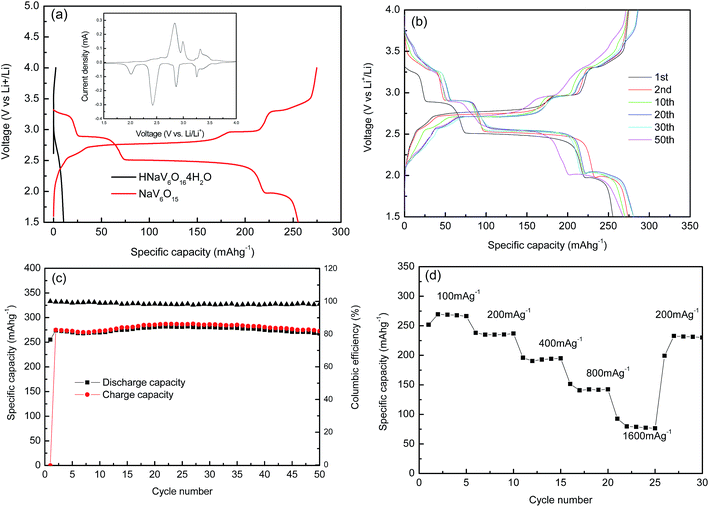
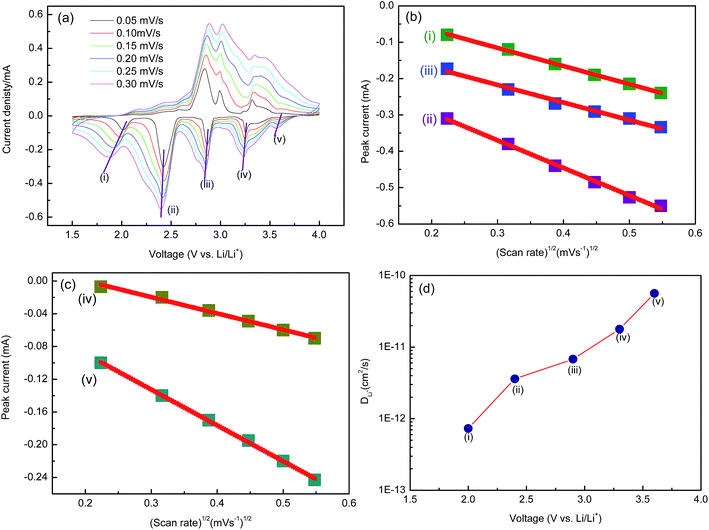
Galvanostatic charge–discharge profiles of HNaV6O16·4H2O and NaV6O15 microflowers are examined at a current density of 100 mA g−1 with Li in the voltage range from 4 V to 1.5 V, as presented in Fig. 5a. It can be observed that HNaV6O16·4H2O microflowers electrode presents almost no electrochemical performance. NaV6O15 microflowers give a high discharge capacity of 255 mA h g−1, which is larger than that of NaV6O15 powders calcined at 500 °C (Fig. S2a†). From the cyclic voltammetry curves of NaV6O15 microflowers (inset of Fig. 5a) at a scan rate of 0.05 mV s−1 from 1.5 to 4.0 V, there are four plateaus at 3.25 V, 2.88 V, 2.49 V and 1.97 V, indicating multi-step intercalation of Li+ ions and corresponding to Li contents of 0 < x ≤ 0.33, 0.33 < x ≤ 0.66, 0.66 < x ≤ 1.67 and 1.67 < x ≤ 2.0, respectively.32 Voltage profiles of first Li+ ion intercalation plateau are relatively lower than those in subsequent intercalation processes (Fig. 5b). It might be due to successive and reversible phase transformations in the cathode materials during the insertion/extraction and stress/strain, whereas a large volume expansion in the first insertion result in large strain over-potential.33 The second discharge capacity is about 280 mA h g−1, which is higher than the first, revealing that a part of extra charge capacity is attributed to the extraction of Na+ ions from the host material, which is similar to that of Na5V12O32.33 Therefore, more Li+ can be inserted into the host material in the next curves. All of the charge–discharge profiles in Fig. 5b show similar multistep discharge/charge behaviors, suggesting a highly reversible process of Li+ ion intercalation and deintercalation in NaV6O15 microflowers. After 50 cycles (Fig. 5c), NaV6O15 microflowers can maintain discharge capacities of 268 mA h g−1 at 100 mA g−1 with high coulombic efficiency of about 98% and high capacity retention of about 105%. For comparison, electrochemical properties of NaV6O15 microflowers and other work with Li were summarized in Table 1. It can be seen that NaV6O15 micromicroflowers show outstanding electrochemical performance. Fig. 5d shows rate performance of NaV6O15 microflowers at different current densities. At the current densities of 100 mA g−1, 200 mA g−1, 400 mA g−1, 800 mA g−1 and 1600 mA g−1, NaV6O15 microflowers exhibit discharge capacities of 250 mA h g−1, 237 mA h g−1, 195 mA h g−1, 142 mA h g−1 and 81.2 mA h g−1, respectively. When cycling at 100 mA h g−1 again, the discharge capacity remains at 233 mA h g−1, which indicates NaV6O15 microflowers cathode remains stable after high rates.
| Composition | Current density (mA g−1) | First discharge capacity (mA h g−1) | Cycle numbers | Capacity and retension (mA h g−1) | Li-ion batteries | Ref. |
|---|---|---|---|---|---|---|
| Rod-shaped β-Na0.33V2O5 | 3.8 | 284 | 70 | 253 (89%) | Li+/Li | 23 |
| Mesoporous β-Na0.33V2O5 | 20 | 339 | 50 | 177 (60.2%) | Li+/Li | 23 |
| Na0.33V2O5 nanosheets | 150 | 258 | 50 | 181 (70.2%) | Li+/Li | 25 |
| β-Na0.33V2O5 nanorods | 60 | 224 | 50 | 182 (81.3%) | Li+/Li | 28 |
| Na0.33V2O5 micro rod | 17 | 297 | 50 | 295 (99%) | Li+/Li | 32 |
| Rice-shaped Na1.08V6O15 | 30 | 302 | 100 | 205 (68%) | Li+/Li | 34 |
| NaV6O15 nanoflowers | 100 | 255 | 50 | 268 (105%) | Li+/Li | This work |
To further understand the electrochemical kinetics, cyclic voltammetry curves of the electrodes at different voltage scan rates with Li were show in Fig. 6a. The Li+ diffusion coefficient (DLi) of the material was calculated according to eqn (1).
| Ip = 2.69 × 10⁵n3/2AD1/2υ1/2C | (1) |
(n, electron number per specific reaction (for Li+ n = 1); A, electrode surface area, about 0.64 cm2 in this work; C, Li ion concentration in the sample; Ip, current intensity; υ, scan rate). Ip varies linearly with υ1/2 as shown in Fig. 6b and c. The lithium diffusion coefficients could be calculated by using eqn (1) (Fig. 6d). Li ions diffusion coefficient is about 5.6 × 10⁻¹¹ to 7.3 × 10⁻¹³ cm2 s−1, which is better than that of rod-shaped Na0.33V2O5.21 It may be attributed to porous structure of NaV6O15 microflowers, which could shorten the effective diffusion path and increase the window numbers for insertion and extraction of Li+. In addition, the Li ions diffusion coefficient (DLi) of NaV6O15 microflowers showed a decrease during the discharge process, indicating that the diffusion of Li+ in the electrode becomes more difficult, possibly resulted from the puckering [V6O15] layers as well as the corresponding structural transformation.
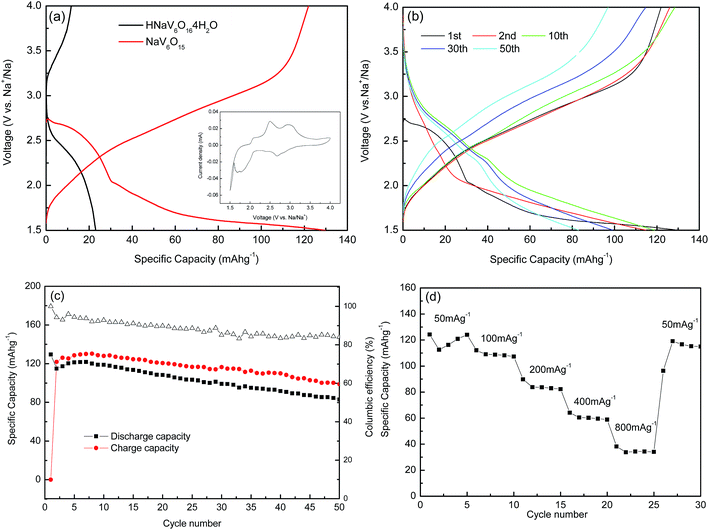
The electrochemical performance of NaV6O15 microflowers as cathode material for Na-ion batteries was also investigated. Fig. 7a shows charge–discharge profiles of HNaV6O16·4H2O and NaV6O15 microflowers at a current density of 50 mA g−1 with Na in the voltage range from 4 V to 1.5 V. It also can be observed that the HNaV6O16·4H2O microflowers electrode presents little electrochemical performance. NaV6O15 microflowers delivers a first discharge capacity of about 130 mA h g−1, which is also higher than that of NaV6O15 powders (Fig. S2b†). The cyclic voltammetry curves of NaV6O15 microflowers (in inset of Fig. 7a) at a scan rate of 0.05 mV s−1 from 1.5 to 4.0 V shows three obvious anodic peaks at 2.08, 2.49 and 2.95 V and two cathodic peaks at 2.67 and 1.71 V. Interestingly, NaV6O15 product shows different work plateaus between 4.0 and 1.5 V in the LIBs or SIBs, which can be understood by the complex structural transitions upon Li+/Na+ insertion with different ionic radius.34 In the subsequent charge–discharge processes, the discharge plateau at about 2.67 V in the first cycle disappears and the discharge capacity reduces to 115 mA h g−1, which might be related to the structure rearrangement of NaV6O15 in the first Na ion intercalation. In the next few cycles, higher capacity can be attributed to the incomplete electrochemical reaction because of flowerlike morphology and inadequate contact with electrolyte.
After 50 cycles, the discharge capacity of 83 mA h g−1 is maintained with the retention of 64% and the coulombic efficiency of 82% (Fig. 7c). Compared to NaV6O15/Li, good cycle performance of NaV6O15/Li may be due to that Na ions in NaV6O15 structure are thought to be immobile and to act as a pillar between the [V6O15] layers, which prevent the structural collapse of NaV6O15 during charge/discharge cycling. In NaV6O15/Na, Na+ will not act as the pillar again and the extensive discharge depth to 1.5 V brings about a collapse of the crystallographic structure of the sample.35 Nevertheless, NaV6O15 microflowers shows good cycle performance when it was used as a cathode material for Na-ion batteries, superior over those reported in early literatures (Table 2).
| Composition | Current density (mA g−1) | First discharge capacity (mA h g−1) | Cycle numbers | Capacity and retension (mA h g−1) | Na-ion batteries | Ref. |
|---|---|---|---|---|---|---|
| NaV6O15 nanoflakes | 15 | 148 | 30 | 136 (92.2%) | Na+/Na | 27 |
| NaV6O15 nanoplates | 50 | 116 | 30 | 63.8 (55%) | Na+/Na | 29 |
| NaV6O15 nanorods | 50 | 106 | 30 | 75 (71%) | Na+/Na | 35 |
| NaV6O15 nanorods | 50 | 134 | 20 | 96.5 (72%) | Na+/Na | 36 |
| Na0.33V2O5 nanosheets | 20 | 188.4 | 50 | 97.8 (51.9%) | Na+/Na | 37 |
| NaV6O15 nanoflowers | 50 | 130 | 30 | 100 (77%) | Na+/Na | This work |
| 50 | 83 (64%) |
Short cycling performance of NaV6O15 microflowers at different current rates from 50 to 800 mA g−1 is shown in Fig. 7d. The electrode presents good rate capability with high reversible discharge capabilities of 125 mA h g−1, 112 mA h g−1, 90 mA h g−1, 64 mA h g−1 and 38 mA h g−1 at the current densities of 50 mA g−1, 100 mA g−1, 200 mA g−1, 400 mA g−1 and 800 mA g−1, respectively. In Fig. 8a, cyclic voltammetry in different scan rates was also utilized to determine the Na+ diffusion coefficient (DNa) of the sample, and Ip varies linearly with υ1/2 is shown in Fig. 8b. On this basis, one can calculate Na ions diffusion coefficients according to eqn (1) is about 1.37 × 10⁻¹³ to 4.87 × 10⁻¹³ cm2 s−1, which is close to the results of Electrochemical Impedance Spectroscopy (EIS).36,37 The result shows that the value of DNa for NaV6O15 sample obtained is higher than that of olivine NaFePO4 (8.7 × 10⁻¹⁷ cm2 s−1),38 which shows potential application as a cathode candidate for NIBs with high performance.
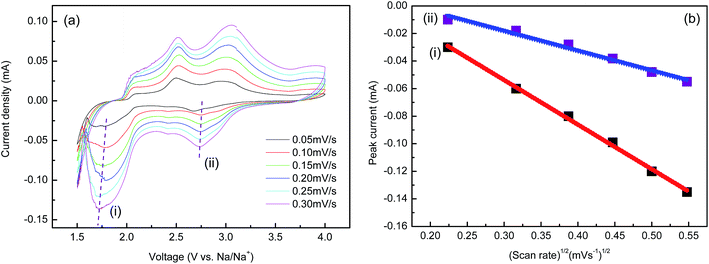 | ||
| Fig. 8 (a) CV curves of NaV6O15 microflowers at different voltage scan rates with Na (b) linear fitting of the Ip versus υ1/2 relationships. | ||
4. Conclusions
In summary, NaV6O15 microflowers have been successfully synthesized using a simple hydrothermal method with subsequent annealing treatment. The as-synthesized NaV6O15 microflowers are investigated as cathodes for both LIBs and SIBs, which exhibited good electrochemical storage performance. According to cyclic voltammetry analysis at different voltage scan rates, Li/Na, the Li/Na ions diffusion coefficients is about 10−11 and 10−13 cm2 s−1, respectively. High Li/Na ions diffusion coefficients would be responsible for remarkable electrochemical performance of NaV6O15 microflowers.Acknowledgements
This work was supported Foundation of state Key Laboratory of high effciency Utilization of Coal and Green Chemical Engineering (Grant No. 2016-19), initial funding for top level talents of Shenyang University of Technology and Nature Science Fund of Liaoning province (No. 20170540671).References
- D. X. Wang, Q. Liu, C. J. Chen, M. L. Li, X. Meng, X. F. Bei, Y. J. Wei, Y. H. Huang, F. Du and C. Z. Wang, ACS Appl. Mater. Interfaces, 2016, 8, 2238 CAS.
- Y. T. Han, X. Wu, Y. L. Ma, L. H. Gong, F. Y. Qu and H. J. Fan, CrystEngComm, 2011, 13, 3506 RSC.
- L. N. Gao, F. Y. Qu and X. Wu, J. Mater. Chem. A, 2014, 2, 7367–7372 CAS.
- N. Chen, Y. Gao, M. N. Zhang, X. Meng, C. Z. Wang, Y. J. Wei, F. Du and G. Chen, Chem.–Eur. J., 2016, 22, 7248 CrossRef CAS PubMed.
- Y. Liu, Y. Jiao, H. Y. Zhou, X. Yu, F. Y. Qu and X. Wu, Nano-Micro Lett., 2015, 7, 12 CrossRef CAS.
- L. N. Gao, X. F. Wang, Z. Xie, W. F. Song, L. J. Wang, X. Wu, F. Y. Qu, D. Chen and G. Z. Shen, J. Mater. Chem. A, 2014, 2, 7167–7173 Search PubMed.
- M. L. Li, Y. Gao, N. Chen, X. Meng, C. Z. Wang, Y. Q. Zhang, D. Zhang, Y. J. Wei, F. Du and G. Chen, Chem.–Eur. J., 2016, 22, 11405 CrossRef CAS PubMed.
- J. Wei, F. Hu, S. Y. Yao, Z. P. Sun and X. Wu, Mater. Res. Bull., 2017, 93, 303 CrossRef.
- X. H. Xiong, G. H. Wang, Y. W. Lin, Y. Wang, X. Ou, F. H. Zheng, C. H. Yang, J. H. Wang and M. L. Liu, ACS Nano, 2016, 10, 10953 CrossRef CAS PubMed.
- X. Ou, X. H. Xiong, F. H. Zheng, C. H. Yang, Z. H. Lin, R. Z. Hu, C. Jin, Y. Chen and M. L. Liu, J. Power Sources, 2016, 325, 410 CrossRef CAS.
- Y. Y. Zhao, Z. X. Wei, Q. Pang, Y. J. Wei, Y. M. Cai, Q. Fu, F. Du, A. Sarapulova, H. Ehrenberg and B. B. Liu, ACS Appl. Mater. Interfaces, 2017, 9, 4709 CAS.
- Z. J. Zhang, Y. X. Wang, S. L. Chou, H. J. Li, H. K. Liu and J. Z. Wang, J. Power Sources, 2015, 280, 107 CrossRef CAS.
- N. Yabuuchi, K. Kubota, M. Dahbi and S. Komaba, Chem. Rev., 2014, 114, 11636 CrossRef CAS PubMed.
- Y. J. Fang, L. F. Xiao, J. F. Qian, X. P. Ai, H. X. Yang and Y. L. Cao, Nano Lett., 2014, 14, 3539 CrossRef CAS PubMed.
- D. Z. Kong, C. W. Cheng, Y. Wang, B. Liu, Z. X. Huang and H. Y. Yang, J. Mater. Chem. A, 2016, 4, 11800 CAS.
- A. Q. Pan, J. G. Zhang, Z. M. Nie, G. Z. Cao, B. W. Arey, G. S. Li, S. Q. Liang and J. Liu, J. Mater. Chem., 2010, 20, 9193 RSC.
- M. Winter, J. O. Besenhard, M. E. Spahr and P. Novák, Adv. Mater., 1998, 10, 725 CrossRef CAS.
- H. N. He, G. H. Jin, H. Y. Wang, X. B. Huang, Z. H. Chen, D. Sun and Y. G. Tang, J. Mater. Chem. A, 2014, 2, 3563 CAS.
- H. N. He, Z. G. Shang, X. B. Huang, S. Tan, D. Sun, G. Q. Xu, Y. G. Tang and H. Y. Wang, J. Electrochem. Soc., 2016, 163, A2349 CrossRef CAS.
- G. Q. Xu, H. N. He, H. Wan, R. H. Liu, X. G. Zeng, D. Sun, X. B. Huang and H. Y. Wang, J. Appl. Electrochem., 2016, 46, 879 CrossRef CAS.
- J. K. Kim, B. Senthilkumar, H. S. Sun, J. H. Kim, M. F. Chi and Y. Kim, ACS Appl. Mater. Interfaces, 2015, 12, 7025 Search PubMed.
- S. A. Bach, J. Electrochem. Soc., 1990, 137, 1042 CrossRef CAS.
- S. Q. Liang, J. Zhou, G. Z. Fang, C. Zhang, J. Wu, Y. Tang and A. Q. Pan, Electrochim. Acta, 2014, 130, 119 CrossRef CAS.
- D. Sun, G. H. Jin, H. Y. Wang, P. Liu, Y. Ren, Y. F. Jiang, Y. G. Tang and X. B. Huang, J. Mater. Chem. A, 2014, 2, 12999 CAS.
- Y. K. Lu, J. Wu, J. Liu, M. Lei, S. S. Tang, P. J. Lu, L. Y. Yang, H. R. Yang and Q. Yang, ACS Appl. Mater. Interfaces, 2015, 7(31), 17433 CAS.
- Q. G. Tan, Y. P. Wang, Y. Tang, X. P. Tan, S. Q. Liang and G. Z. Cao, CrystEngComm, 2015, 17, 4774 RSC.
- D. L. Jiang, H. Wang, G. P. Li, G. Q. Li, X. Z. Lan, M. H. Abib, Z. P Zhang and J. G. Yang, J. Electrochem. Soc., 2015, 162(4), A697 CrossRef CAS.
- P. P. Wang, Y. X. Cheng, F. X. Ma, Y. Li and L. Zhen, RSC Adv., 2016, 6, 105833 RSC.
- H. N. He, X. G. Zeng, H. Y. Wang, N. Chen, D. Sun, Y. G. Tang, X. B. Huang and Y. F. Pana, J. Electrochem. Soc., 2015, 162(1), A39 CrossRef CAS.
- M. S. Park, Y. M. Kang, G. X. Wang, S. X. Dou and H. K. Liu, Adv. Funct. Mater., 2008, 18, 455 CrossRef CAS.
- Y. Liu and X. G. Zhang, Electrochim. Acta, 2009, 54, 4180 CrossRef CAS.
- I. Seo, G. C. H. Wang, J. K. Kim and Y. Kim, Electrochim. Acta, 2016, 193, 160 CrossRef CAS.
- Y. H. Cao, D. Fang, C. Wang, L. C. Li, W. L. Xu, Z. P. Luo, X. Q. Liu, C. X. Xiong and S. Q. Liu, RSC Adv., 2015, 5, 42955 RSC.
- S. L. Zheng, X. Y. Wang, H. Yan, H. Du and Y. Zhang, Mater. Res. Bull., 2016, 81, 10 CrossRef CAS.
- H. M. Liu, H. S. Zhou, L. P. Chen, Z. F. Tang and W. S. Yang, J. Power Sources, 2011, 196, 814 CrossRef CAS.
- X. Y. Wang, Q. Liu, H. Wang, D. L. Jiang, Y. J. Chang, T. Zhang, B. Zhang, H. H. Mou and Y. Jiang, J. Mater. Sci., 2016, 51, 8986 CrossRef CAS.
- Y. K. Lu, N. Su, L. Z. Cheng, J. Liu, L. Y. Yang, H. R. Yang, Q. Yang, S. T. Li, J. Min and M. Lei, Mater. Lett., 2016, 183, 346 CrossRef CAS.
- Y. Zhu, Y. Xu, Y. Liu, C. Luo and C. Wang, Nanoscale, 2013, 5(2), 780 RSC.
Footnote |
| † Electronic supplementary information (ESI) available. See DOI: 10.1039/c7ra04388k |
| This journal is © The Royal Society of Chemistry 2017 |

