 Open Access Article
Improved properties of Al–Si3N4 nanocomposites fabricated through a microwave sintering and hot extrusion process
Penchal Reddy Matlia,
Fareeha Ubaida,
Rana Abdul Shakoor *a,
Gururaj Parandeb,
Vyasaraj Manakarib,
Moinuddin Yusufa,
Adel Mohamed Amer Mohamedc and
Manoj Guptab
aCenter for Advanced Materials, Qatar University, Doha, Qatar. E-mail: shakoor@qu.edu.qa; Tel: +974-44036867
bDepartment of Mechanical Engineering, National University of Singapore, Singapore
cDepartment of Metallurgical and Materials Engineering, Suez University, Suez, Egypt
First published on 10th July 2017
Abstract
In this study, nano-sized Si3N4 (0, 0.5, 1.0 and 1.5 vol%)/Al composites were fabricated using a powder metallurgy method involving microwave sintering technique followed by hot extrusion. The influence of Si3N4 content on the structural, mechanical and thermal behaviour of Al–Si3N4 nanocomposites was systematically investigated. Electron microscopy examination reveals the uniform distribution of hard Si3N4 nanoparticles in the soft Al matrix. The compressive and tensile strengths of Al composites increased with the increase of Si3N4 content while the ductility decreased. The thermal expansion coefficient of the Al composite decreased with the progressive addition of hard Si3N4 nanoparticles. Overall, hot extruded Al–1.5 vol% Si3N4 nanocomposites exhibited the best combination of tensile, compressive, hardness, Young's modulus and thermal properties of 191 ± 4 MPa, 412 ± 3 MPa, 16.3 ± 0.8 GPa, 94 ± 2 GPa and 19.3 μ K−1, respectively. Tensile tests performed at 200 °C revealed that the tensile strength reduced by ∼35% when compared to the strength at room temperature. The strength, however, was still higher compared to that of the pure Al at 200 °C. The major enhancement in the strength of the nanocomposites is primarily attributed to the presence of uniformly distributed nano-sized Si3N4 nanoparticles in the Al matrix.
1. Introduction
Aluminum metal matrix composites (AMMCs) are potential candidates for a wide spectrum of applications in the automobile and aerospace structure industries, due to their high specific modulus, strength and thermal stability.1,2 Light weight metal matrix composites (Al, Mg and Ti based) consist of a metallic matrix and ceramic particles as reinforcement. Commonly used reinforcing ceramics belong to oxide, carbide, boride and nitride families. Generally, micron length scale powder particles are used as reinforcing phase in the metal matrix.Recently, there is a considerable interest in the production of metal matrix nanocomposites in which nanoparticulates are incorporated into the base matrix. The production of nanocomposites is currently in the exploration and experimental research stage. When compared to composites with micron-sized reinforcements, nanocomposites exhibit comparable or better mechanical properties with the use of a lower amount of nanoparticulate reinforcements.3–7
The most commonly used particulate reinforcements are silicon carbide and alumina8,9 but AlN, Si3N4, TiC, B4C, MgO, and graphite are also being used.10–14 Especially, silicon nitride (Si3N4) exhibit high chemical and thermal stability, higher hardness, strength and excellent corrosion, wear and creep resistance.15 A uniform distribution of reinforcement in a fine grained metal matrix is critical for the enhancement of the mechanical characteristics of AMMCs.
The end properties of composites are also significantly affected by the type, size and amount of reinforcement.16–18 However, to synthesize MMCs, the choice of reinforcing particles depends on the cost of the materials used, final application, and the manufacturing method adopted.19 Composites containing ceramic particles have been successfully fabricated by casting method20 and powder metallurgy (PM) methods such as cryomilling,21 ball milling22 and wet mixing process.23 PM methods usually involve blending of powders, compaction and solid state sintering followed by secondary deformation process such as extrusion. Among these steps, sintering is an important step because it have the ability to develop the microstructural characteristics that govern the final properties of the material. Sintering can be done in many ways involving plasma, radiant, induction and microwave heating techniques.24 Among various sintering techniques, microwave sintering include rapid and more uniform heating, prevention of hot spot formation, more uniform and finer microstructure leading to high performance products.25,26
Accordingly, the aim of the present research work was to fabricate high performance aluminum metal matrix composites for structural applications. It focuses on new Al composites containing Si3N4 nanoparticles developed by a combination of blending, rapid microwave sintering and hot extrusion techniques. The effect of the Si3N4 content on the microstructural, mechanical and thermal characteristics of the Al–Si3N4 nanocomposites was investigated in detail.
2. Experimental
Pure Al powder (99% purity, Alfa Aesar, USA) with an average size of ∼7–15 μm was used as the matrix and silicon nitride (Si3N4, 99% purity, Alfa Aesar, USA) with an average size of ∼15–30 nm was used as the reinforcement for the synthesis of Al–Si3N4 nanocomposites.The pure powders were carefully mixed with the required amount of silicon nitride (0, 0.5, 1.0 and 1.5 vol%). The mixing process was performed at room temperature using a Retsch PM400 planetary ball mill for 2 h at the milling speed set at 200 rpm in order to get a homogeneous particle distribution. No balls were used in this stage. The blended powder mixtures were compacted at a pressure of 97 bar (50 tons) into green compacts of size 35 mm diameter and 40 mm length. The compacted cylindrical billets were sintered at 550 °C using an novel hybrid microwave assisted two-directional sintering technique.27
The microwave sintered billets were subjected to hot extrusion at 350 °C and under load of 500 MPa, with an extrusion ratio of 20.25![[thin space (1/6-em)]](https://www.rsc.org/images/entities/char_2009.gif) :
:![[thin space (1/6-em)]](https://www.rsc.org/images/entities/char_2009.gif) 1 to produce extruded rods of 8 mm diameter. These extruded rods were subsequently used for characterization and testing as per ASTM standards. The schematic diagram of the experimental process is shown in Fig. 1.
1 to produce extruded rods of 8 mm diameter. These extruded rods were subsequently used for characterization and testing as per ASTM standards. The schematic diagram of the experimental process is shown in Fig. 1.
The phase analysis was performed using X-ray diffractometer (PANalytical X'pert Pro) with Cu Kα radiation. The operating parameters were 40 kV and 40 mA, with a 2θ step size of 0.02°. The microstructure observation and element analysis of the polished surfaces of diametric cross-sections were carried out using a scanning electron microscope (JEOL JSM-6010 and Hitachi FESEM-S4300) equipped with energy dispersion spectroscopy (EDS) detector.
Microhardness was determined using a Vickers tester (FM-ARS9000, USA) under an applied load of 100 gf with an indentation time of 15 s as per the ASTM standard E384-08.
Nanoindentation measurements at room temperature were performed using a MFP-3D Nano Indenter (head connected to AFM equipment) system equipped with standard Berkovich diamond indenter tip. The forces applied were in the mN range, and penetration depths ranged from several nm to μm. The microhardness and young's modulus (E) from nanoindentation test were calculated directly. The indentation was made at a maximum load of about 100 mN and under loading and unloading rate of 200 μN s−1 and dwell time at maximum load was kept at 5 s. With the aim of take the repeatability into account, the test results were calculated from the average of 6 indentations.
Compressive testing of the cylindrical specimens was done at room temperature according to the procedures given in the ASTM standard E9-89a using Universal testing machine-Lloyd. The test specimens with a length to diameter (l/d) ratio of ∼1 were subjected to a compression load at a constant strain rate of 8.3 × 10⁻⁴ s−1. From the load–displacement curves, 0.2% offset yield strength (YS), ultimate compression strength (UCS) and failure strain were determined.
Tensile testing was carried out as per the ASTM E8/E8M-15a using universal testing machine at room temperature (RT), 100 °C and 200 °C using a strain rate of 8.3 × 10⁻⁴ s−1. For each composition, three samples were tested to ensure repeatable values. From the load displacement curves, 0.2% offset yield strength (YS), ultimate tensile strength (UTS) and percentage elongation (ductility) were determined.
The fracture surfaces of the compression and tensile specimens were examined by field emission scanning electron microscope (Hitachi FESEM-S4300).
Coefficient of thermal expansion (CTE) of Al–Si3N4 nanocomposites was determined using a INSEIS TMA PT 1000LT thermo-mechanical analyzer at a heating rate of 5 °C min−1 for a temperature range of 50–350 °C with an argon flow rate of 0.1 lpm.
3. Results and discussion
XRD analysis of Al–Si3N4 nanocomposites
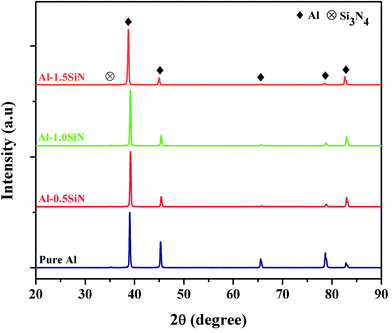
The X-ray diffraction (XRD) patterns of the microwave sintered Al–Si3N4 nanocomposites with different volume fraction of the reinforcement shown in Fig. 2 confirms the presence of Si3N4 particulates within the aluminium matrix. The peak of Si3N4 was weak due to low amount of Si3N4 (<2 vol%) but visible in the case of Al–1.5 vol% Si3N4. These peaks are recognized with the help of JCPDS software. The XRD results also approve the elemental map results which verifies that the fabricated nanocomposites are Si3N4 reinforced Al composites.Microstructural analysis of Al–Si3N4 nanocomposites
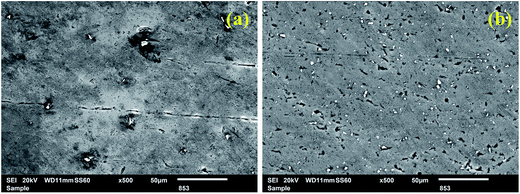
The microstructure of the Al–Si3N4 nanocomposites was studied by using a field-emission scanning electron microscope (FESEM) and the corresponding micrographs are shown in Fig. 3. The SEM images of hot extruded composites reveal the homogeneous distribution of Si3N4 nanoparticles (white areas) in the Al metal matrix (grey areas). At some places cluster of Si3N4 particulates were also observed and may be attributed to different density of Si3N4 particles (3.44 g cm−3) when compared to that of aluminium (2.7 g cm−3).Fig. 4 shows the SEM image of the Al–1.5 vol% Si3N4 nanocomposites along with corresponding EDS elemental mapping images of Al, Si & N and EDX spectrum. The elemental distribution map clearly reveals the homogeneous distribution of Si3N4 nanoparticles in Al matrix. The Si and N elemental mapping images are in good agreement with the distribution of Si3N4 in Al matrix.
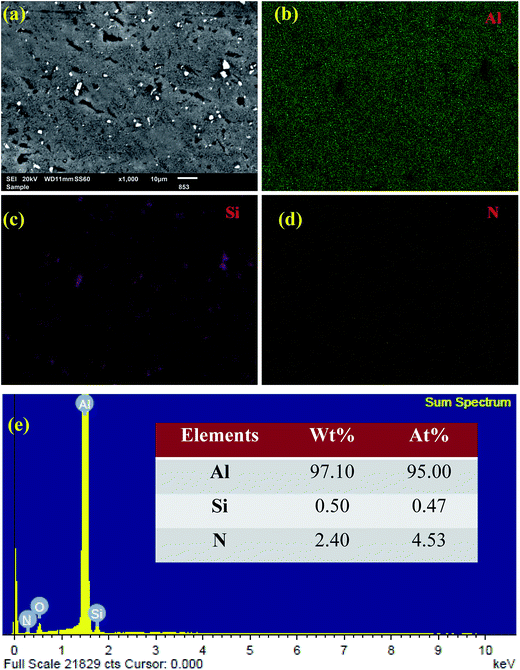 | ||
| Fig. 4 (a) SEM images of extruded Al–1.5 vol% Si3N4 nanocomposites and corresponding EDS mapping images of (b) Al, (c) Si, (d) N elements and (e) EDX spectrum. | ||
Microhardness of Al–Si3N4 nanocomposites
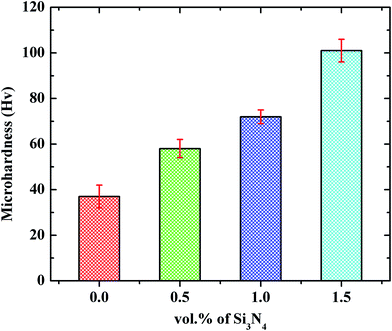
Hardness is a useful mechanical property that provides valuable insight into overall mechanical behaviour of composites. Generally, several factors would affect the microhardness of the composites such as particle shape, size, amount, distribution, density of reinforcement and method of preparation.28 Fig. 5 shows the hardness of the pure Al and Al–Si3N4 nanocomposites. It can be observed that the hardness increased with increasing the content of nano-sized Si3N4 particles. The hardness of the unreinforced pure Al was found to be 37 ± 3 HV, while that of Al–1.5 vol% Si3N4 nanocomposites were around 101 ± 5 HV (1.7 times). This increase in the hardness is because of the presence of hard ∼15 nm Si3N4 in the matrix. Similar outcomes of rise in hardness with increasing amount of reinforcement in the matrix irrespective of the fabrication process of AMMCs were reported by researchers earlier.29,30 Also, the microhardness values of the microwave-extruded samples in this study were found to be higher than those of the conventional or stir cast samples.29,30The presence of hard ceramic particles can enhance the microhardness of composites according to the rule of mixtures.31
| Hc = Hmfm + Hrfr | (1) |
Nanoindentation studies of Al–Si3N4 nanocomposites
The load–displacement plots from nanoindentation for the extruded pure Al and Al–Si3N4 nanocomposite samples are presented in Fig. 6(a). A maximum load of 100 mN was applied, and the indentation depth resides within 1.3 to 2.4 nm. Lower depth of penetration in composites can be observed from the nanoindentation graphs in comparison to that of pure Al. The decrease of indentation depth with the increase in hardness agrees with the fact that hardness increased with increase in volume fraction of Si3N4 particles. A similar trend in the hardness values was observed in the AA6082-Si3N4 composites.29 The lower displacement is attributed to the higher resistance offered by the matrix incorporated with hard Si3N4 particles to the indenter.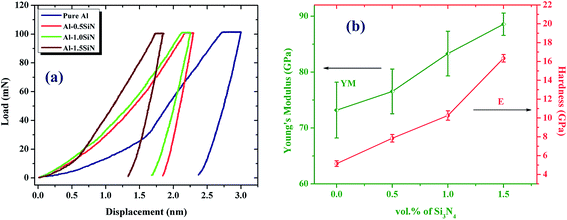 | ||
| Fig. 6 (a) Room temperature load/unload–displacement curves and (b) Young's modulus and hardness of extruded Al–Si3N4 nanocomposites. | ||
The Young's modulus and hardness of extruded pure Al and Al–Si3N4 nanocomposite samples achieved directly from the nanoindentation test, are shown in Fig. 6(b). The Young's modulus and hardness increased with increasing amount of hard Si3N4 nanoparticles. The enhanced modulus for the extruded composites from 73 ± 5 to 88 ± 2 GPa by increasing Si3N4 from 0 to 1.5 vol% is attributed to the high modulus of Si3N4 nanoparticles in the aluminium matrix.
Compressive analysis of Al–Si3N4 nanocomposites
Fig. 7 shows the representative engineering stress–strain curve obtained under compressive loading conditions. It can be observed that the shape of the stress–strain curves display a downward concave profile after yield. The results of compressive testing revealed an improvement in 0.2% YS and UCS for all the composite formulations investigated when compared to pure aluminum, as seen in Table 1. With the addition of Si3N4 nanoparticles, the yield strength and ultimate compression strength (UCS) of Al–1.5 vol% Si3N4 nanocomposites are 142 ± 6 MPa and 412 ± 3 MPa, which are increased by 32% and 103%, respectively, compared to those of the pure Al (70 ± 3 MPa and 313 ± 5 MPa). The increase in UCS is because of the presence of Si3N4 particles and the strengthening mechanism was triggered due to their presence. It can be observed that the ultimate compressive strength of the microwave-hot extruded Al–Si3N4 nanocomposites is superior to that of conventional sintered AMMCs.29,30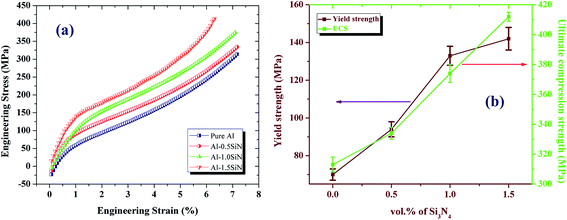 | ||
| Fig. 7 Representative compressive stress–strain curves (a) and variation in YS and UCS with amount of Si3N4 (b) of extruded Al–Si3N4 nanocomposites. | ||
| Sample | Hardness | Young's modulus (GPa) | Compressive properties | Tensile properties | |||||
|---|---|---|---|---|---|---|---|---|---|
| (HV) | (GPa) | CYS (MPa) | UCS (MPa) | Failure strain (%) | TYS (MPa) | UTS (MPa) | Elongation (%) | ||
| Pure Al | 37 ± 3 | 5.1 ± 0.3 | 73 ± 5 | 70 ± 3 | 313 ± 5 | >70 | 105 ± 2 | 116 ± 4 | 13.6 ± 0.3 |
| Al–0.5 vol% Si3N4 | 58 ± 4 | 7.8 ± 0.4 | 77 ± 4 | 94 ± 4 | 336 ± 4 | >70 | 124 ± 4 | 139 ± 7 | 11.2 ± 0.3 |
| Al–1.0 vol% Si3N4 | 72 ± 3 | 10.2 ± 0.5 | 83 ± 4 | 133 ± 5 | 374 ± 6 | >70 | 140 ± 5 | 163 ± 5 | 9.3 ± 0.5 |
| Al–1.5 vol% Si3N4 | 101 ± 5 | 16.3 ± 0.8 | 88 ± 2 | 142 ± 6 | 412 ± 3 | >70 | 165 ± 8 | 191 ± 6 | 7.2 ± 0.4 |
Tensile analysis of Al–Si3N4 nanocomposites
Tensile stress strain curves of monolithic and nanocomposites conducted at ambient temperature under uniaxial tensile loading are shown in Fig. 8(a). The corresponding tensile test data variation as a function of amount of Si3N4 is shown in Fig. 8(b).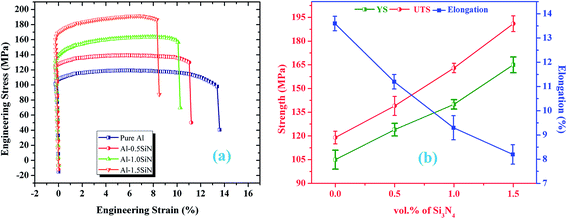 | ||
| Fig. 8 Representative tensile stress–strain curves (a) and variation in YS, UTS and Elongation with amount of Si3N4 (b) of extruded Al–Si3N4 nanocomposites. | ||
The results of the tensile testing show that the use of silicon nitride nano reinforcing particles in pure Al led to a considerable increase in 0.2% yield strength and ultimate tensile strength (UTS) of pure Al suggesting that the Si3N4 particles can strongly improve the strength of the soft Al matrix. The 1.5 vol% nano-sized Si3N4/Al composite exhibited the best tensile properties. The yield strength, UTS and elongation of the 1.5 vol% nano-sized Si3N4/Al composite are 165 ± 5 MPa, 191 ± 4 and 8.2%, which changed by +24%, +65% and −40% respectively, compared to those of the pure Al (105 ± 2 MPa, 116 ± 4 MPa and 13.6%). It can be noted that the ultimate tensile strength of the microwave-hot extruded Al–Si3N4 nanocomposites are clearly superior to that of conventional sintered AMMCs.29,30,32
The results presented in Table 1 show that the tensile strength of microwave-extruded Al–Si3N4 nanocomposites are considerably higher than those of stir cast + extruded Al–Si3N4 matrix composites reported so far.29 These results can be attributed to the fairly uniform distribution of reinforcement particles and good matrix-reinforcement interfacial integrity.
In order to meet the requirement for heat resistance materials, the mechanical properties of the Al–Si3N4 (0 to 1.5 vol%) nanocomposites at high temperatures (100 °C and 200 °C) were also investigated, as shown in Fig. 9(a) and (b).
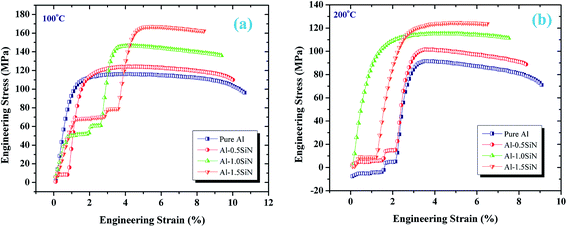 | ||
| Fig. 9 Representative tensile stress–strain curves of extruded Al–Si3N4 nanocomposites at different temperatures. | ||
It was already expected that the material will soften when tested at higher temperatures. For the Al–1.5 vol% Si3N4 nanocomposite, the ultimate tensile strength and yield strength decreased when the tensile tests were carried out at 100 and 200 °C. The softening of the matrix together with the grain growth along with increasing test temperature leads to less pronounced strain hardening behaviour in these composites.33 It was found that the UTS of the samples were markedly prominent for extruded Al–Si3N4 nanocomposites. At 200 °C, the UTS of Al–1.5 vol% Si3N4 nanocomposite is ∼124 ± 4 MPa. With increasing heating temperature, UTS of all samples decreases. The developed microwave-extruded Al–1.5 vol% Si3N4 nanocomposite possesses incredible properties especially at high temperatures. Based on the experimental data the authors achieved, there are mainly two reasons for the remarkable performance of the Al–Si3N4 nanocomposite at high temperatures: one is the high thermal stability of Si3N4 and the other one is related to the reasonably uniform spatial distribution of Si3N4 particles throughout the Al matrix.
Strengthening mechanism analysis
Several mechanisms and theories have been recommended to elucidate the strengthening of metal matrix composites. To understand the strengthening effects of ceramic reinforcement nanoparticles on the hardness, compression and tensile properties of composites such as UTS and YS, it is prudent to discuss the strengthening mechanism in details. In the present study strengthening occurs due to the following mechanism (i) active load transfer from the matrix to the reinforcement, (ii) Orowan strengthening, (iii) generation of internal thermal stresses because of the difference in the co-efficient of thermal expansion (CTE) between the reinforcement particles and matrix phase and (iv) effect of nano-sized reinforcement.The efficient load transfer (σload) between the ductile matrix and the hard-ceramic reinforcement particles occurs during tensile testing. Mainly when the interfacial contact between the matrix and the reinforcement is good enough and it is represented as follows:34–36
| σload = 0.5VfσYM | (2) |
The interaction between the dislocations and the reinforcement particles enhances the strength of the composite materials in agreement with the Orowan mechanism. Due to the existence of dispersed reinforcement particles in the matrix, dislocation loops are formed when dislocations interact with the reinforcing particles. σOrowan can be calculated as:37
 | (3) |
The variation in the CTE values of the metal matrix and the reinforcement particles produces thermally induced residual stresses and geometrically essential dislocations. The thermal stresses at the particles and matrix interface enhance the hardness and flow stresses in the material, making the plastic deformation more difficult. The mismatch strain effect due to the difference between the CTE values of particles and that of the matrix is given by:38
 | (4) |
When compared to the micron-sized ceramic reinforcements, the nano-sized ceramic reinforcements exhibit superior tensile strength and excellent ductility and that too in low volume fractions.39,40 Large reinforcement particles are commonly associated with cleavage and interfacial deboning resulting into the formation of pits or cavities.
Failure analysis
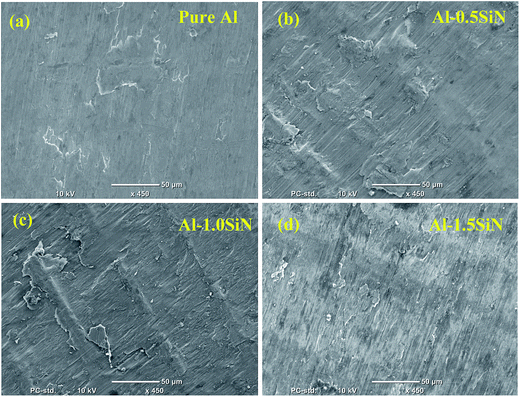
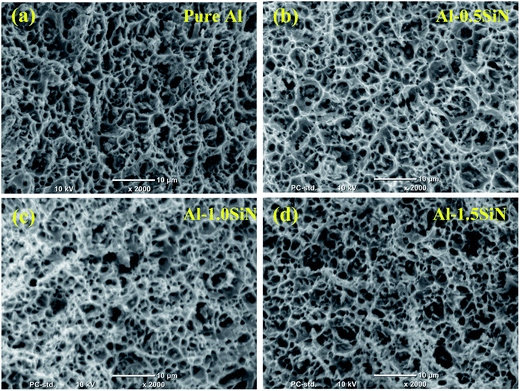
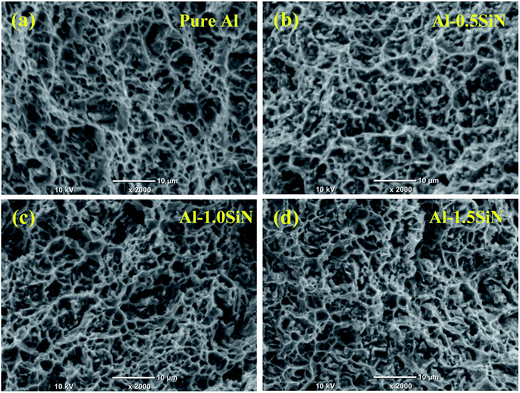
The fracture surfaces of compression and tensile tested samples were studied using SEM, in order to understand the type of fracture under different types of loading and at different temperatures.Fig. 10(a–d) is showing the fractured surfaces of pure Al and Al– Si3N4 composites under compressive loading. A typical shear mode fracture can be observed in these nanocomposites under compressive loading and the fractured samples show a crack at 45° to the test axis. It approves that the compressive deformation of the Al-composites is expressively indifferent. This is due to assorted deformation and work hardening behaviour.41 The plastic deformation in the composites was restricted due to the dispersion of second phases in the matrix.
The fracture observed in the composites depends on a variety of factors including the processing method, heat treatments cycles, the applied stresses, distribution and morphology of the reinforcing particles. Fractographs taken from the tensile fracture surfaces (at RT and 200 °C) of pure Al and Al–Si3N4 nanocomposite samples are shown in Fig. 11 and 12, respectively. The images show the features of a typical ductile fracture in pure Al and the Al–Si3N4 composites samples.
Coefficient of thermal expansion of Al–Si3N4 nanocomposites
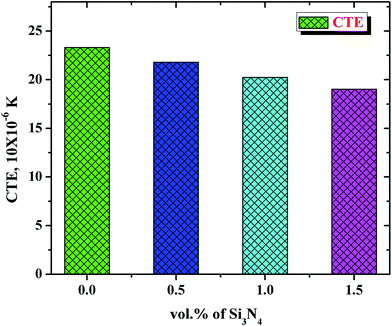
The CTE values of the synthesized pure Al and Al–Si3N4 nanocomposites are shown in Fig. 13. The CTE values for Al–0.5 vol% Si3N4 (21.8 μ K−1), Al–1.0 vol% Si3N4 (20.23 μ K−1) and Al–1.5 vol% Si3N4 (19.3 μ K−1) were found to be ∼6.5%, ∼13.2 and ∼17.2% lower than that of pure Al (23.31 μ K−1).As observed, the CTE value of pure aluminum follows a linear decreasing trend with the progressive addition of Si3N4 particles which is found to be in accordance with the theory that the thermal expansion of composites is governed by the competing interactions of expansion of Al matrix and the constraint of reinforcement particles through their interfaces.29 This decrease in the CTE values can be ascribed to the lower CTE value of silicon nitride (1.4–3.7 μ K−1)41 when compared to that of pure Al (24 μ K−1).42 Good interfacial integrity between the aluminium matrix and Si3N4 nanoparticulates and limited agglomeration of Si3N4 nanoparticulates in the developed nanocomposites. The results of CTE measurements suggest that the Si3N4 nanoparticulates contribute positively to the dimensional stability of pure Al.
4. Conclusions
Nano-sized Si3N4 particulate reinforced Al composites have been successfully synthesized by microwave sintering followed by hot extrusion. Microstructure of composites shows fairly uniform distribution of nanoparticles in the Al matrix. The Si3N4 addition leads to a linear increase in Young's modulus and hardness values of Al-matrix. Al–1.5 vol% Si3N4 composite exhibits the best compressive properties as the yield strength and UCS increases upto 142 ± 6 MPa and 412 ± 3 MPa, respectively. The yield strength and UTS under tensile loading also shows a major increment upto 165 ± 8 MPa and 191 ± 6 MPa, respectively where as the ductility showed a decreasing trend. The shear band and dimple formations were observed in Al–1.5 vol% Si3N4 nanocomposites under compression and tensile loading, respectively. Coefficient of thermal expansion values decreased with the increasing content of Si3N4 particles, indicating high dimensional stability of nanocomposites.Acknowledgements
This publication was made possible by NPRP Grant 7-159-2-076 from Qatar National Research Fund (a member of the Qatar Foundation). Statements made herein are solely the responsibility of the authors.References
- R. Ipek, J. Mater. Process. Technol., 2005, 162, 71–75 CrossRef.
- I. Topcu, H. O. Gulsoy, N. Kadioglu and A. N. Gulluoglu, J. Alloys Compd., 2009, 482, 516–521 CrossRef CAS.
- Z. Y. Ma, Y. L. Li, Y. Liang, F. Zheng, J. Bi and S. C. Tjong, Mater. Sci. Eng., A, 1996, 219, 229–231 CrossRef.
- Y. C. Kang and S. L. Chan, Mater. Chem. Phys., 2004, 85, 438–443 CrossRef CAS.
- S. F. Hassan and M. Gupta, J. Alloys Compd., 2007, 429, 176–183 CrossRef CAS.
- W. L. E. Wong and M. Gupta, Adv. Eng. Mater., 2006, 8, 735–740 CrossRef CAS.
- H. Ferkel and B. L. Mordike, Mater. Sci. Eng., A, 2001, 298, 193–199 CrossRef.
- H. R. Hafizopour, M. Sanjari and A. Simchi, Mater. Des., 2009, 30, 1518–1523 CrossRef.
- D. Ozyurek, S. Tekeli, A. Güral, A. Meyveci and M. Guru, Powder Metall. Met. Ceram., 2010, 49, 289–294 CrossRef.
- J. H. Ahn, Y. J. Kim and H. Chung, Rev. Adv. Mater. Sci., 2003, 18, 329–334 Search PubMed.
- Z. Y. Xiu, G. Q. Chen, G. H. Wu, W. S. Yang and M. Y. Liu, Nonferrous Met. Soc. China, 2011, 21, 285–289 CrossRef.
- S. Mohapatra, A. K. Chaubey, D. K. Mishra and S. K. Singh, J. Mater. Res. Technol., 2016, 5, 117–122 CrossRef CAS.
- F. Ubaid, M. Penchal Reddy, R. A. Shakoor, P. Gururaj, M. Vyasaraj, A. M. A. Mohamed and M. Gupta, Materials, 2017, 10, 621–633 CrossRef.
- Y. Ansary, M. Montazerian, H. Abdizadeh and H. R. Baharvandi, J. Alloys Compd., 2009, 484, 400–404 CrossRef.
- F. Ye, J. Y. Zhanf, L. M. Liu and H. J. Zhan, Mater. Sci. Eng., A, 2011, 528, 1421–1424 CrossRef.
- M. Penchal Reddy, F. Ubaid, R. A. Shakoor, P. Gururaj, M. Vyasaraj, A. M. A. Mohamed and M. Gupta, Mater. Sci. Eng., A, 2017, 696, 60–69 CrossRef.
- M. Penchal Reddy, F. Ubaid, A. Shakoor, A. M. A. Mohamed and W. Madhuri, J. Sci: Adv. Mater. Des., 2016, 1, 362–366 Search PubMed.
- M. Penchal Reddy, A. Shakoor, A. M. A. Mohamed and M. Gupta, Metals, 2016, 6, 143–162 CrossRef.
- A. Alizadeh, E. T. Nassaj and M. Hajizamani, J. Mater. Sci. Technol., 2011, 27, 1113–1119 CAS.
- V. K. Lindroos and M. J. Talvitie, J. Mater. Process. Technol., 1995, 53, 273–284 CrossRef.
- H. Mindivan, Mater. Lett., 2010, 64, 405–407 CrossRef CAS.
- S. L. Urtiga Filho, R. Rodriguez, J. C. Earthman and E. J. Lavernia, Mater. Sci. Forum, 2003, 416, 213–218 CrossRef.
- Y. C. Kang and S. L. Chan, Mater. Chem. Phys., 2004, 85, 438–443 CrossRef CAS.
- R. A. German, Sintering Theory and Practice, John Wiley & Sons Inc., New York, 1996 Search PubMed.
- D. E. Clark and W. H. Sutton, Annu. Rev. Mater. Sci., 1996, 26, 299–331 CrossRef CAS.
- D. Agrawal, J. Cheng and R. Roy, Am. Ceram. Soc. Spec. Publ., 2000, 273–284 CAS.
- G. Parande, V. Manakari, G. K. Meenashisundaram and M. Gupta, Int. J. Mater. Res., 2016, 107, 1091–1099 CrossRef CAS.
- S. Sankaranarayanan, V. H. Shankar, S. Jayalakshmi, N. Q. Bau and M. Gupta, J. Alloys Compd., 2015, 627, 192–199 CrossRef CAS.
- P. Sharma, S. Sharma and D. Khanduja, Journal of Asian Ceramic Societies, 2015, 3, 352–359 CrossRef.
- M. A. Moghaddas, S. Farshid and K. Bozorg, Mater. Sci. Eng., A, 2013, 559, 187–193 CrossRef CAS.
- S. Mula, J. Panigrahi, P. C. Kang and C. C. Koch, J. Alloys Compd., 2014, 588, 710–715 CrossRef CAS.
- Z. Y. Ma, Y. L. Li, Y. Liang, F. Zheng, J. Bi and S. C. Tjong, Mater. Sci. Eng., A, 1996, 219, 229–231 CrossRef.
- D. Kratschmer, E. Roos, X. Schuler and K. H. Herter, Int. J. Pressure Vessels Piping, 2012, 92, 1–10 CrossRef.
- Z. Zhang and D. L. Chen, Mater. Sci. Eng., A, 2008, 483, 148–152 CrossRef.
- Z. Zhang and D. L. Chen, Scr. Mater., 2006, 54, 1321–1326 CrossRef CAS.
- K. Habibnejad, R. Mahmudi and W. J. Poole, Mater. Sci. Eng., A, 2009, 519, 198–203 CrossRef.
- M. F. Ashby, Proc. Second bolton Landing conf. On oxide dispersion strengthening, Science Publishers Inc., New York, 1968 Search PubMed.
- W. L. E. Wong and M. Gupta, Technol., 2015, 3, 1–18 CrossRef PubMed.
- Y. Yang, J. Lan and X. Li, Mater. Sci. Eng., A, 2004, 380, 378–383 CrossRef.
- Y. C. Kang and S. L. I. Chan, Mater. Chem. Phys., 2004, 85, 438–443 CrossRef CAS.
- B. Anggara and S. B. Soegijono, KnE Engineering, 2016, 1–5 Search PubMed.
- K. Chu, C. C. Jia and W. S. Li, Mater. Sci. Technol., 2012, 28, 1397–1401 CrossRef CAS.
| This journal is © The Royal Society of Chemistry 2017 |


