 Open Access Article
Kinetics and gene diversity of denitrifying biocathode in biological electrochemical systems†
Yongjia Zhanga,
Weiwei Xua,
Yan Xiang a,
Beizhen Xieb,
Hong Liub,
Lina Wuc and
Dawei Liang
 *a
*a
aBeijing Key Laboratory of Bio-inspired Energy Materials and Devices, School of Space & Environment, Beihang University, Beijing 100191, PR China. E-mail: liangdw@buaa.edu.cn
bInstitution of Environmental Biology and Life Support Technology, School of Biological Science and Medical Engineering, Beihang University, Beijing 100191, PR China
cSchool of Environment and Energy Engineering, Beijing University of Civil Engineering and Architecture, Beijing 100044, PR China
First published on 10th May 2017
Abstract
Cathodic denitrification using a bioelectrochemical system removes nitrogen at a low C/N ratio, and also harvests energy as electricity. Denitrifying biocathodes were cultured using three electrode systems with nitrate (NO3−) and/or nitrite (NO2−) as electron acceptors. Results showed that denitrification of NOx− in biocathodes exhibit typical enzymatic reaction kinetics and denitrification rate follows the Monod equation, with rmax = 1.33 kg N m−3 d−1, Ks = 5.52 g L−1 for NO3− and rmax = 1.76 kg N m−3 d−1, Ks = 8.09 g L−1 for NO2−, respectively. Optimal cathodic efficiency was obtained at an initial substrate concentration of 0.5 g L−1. A high-throughput sequencing analysis of 16S rRNA gene showed high biodiversity in a denitrifying biocathode and nitrite contributed more to the formation of cathodic microbial community structure. Denitrification functional gene analysis revealed Pseudomonas are effective denitrifiers in a biocathode.
1. Introduction
Bioelectrochemical system (BES), a cutting-edge environmental biotechnology, is distinguished by its multiple uses including energy production, denitrification, and detoxification, and has increasingly been attracting attention in the last decade.1–6 Generally, anodic microbes oxidize organics in BES and release electrons to an anode. If there are nitrogen-containing electron acceptors such as nitrate (NO3−), nitrite (NO2−), and even nitrous oxide (N2O) presenting in the cathode, these substrates can be reduced to nitrogen by electro-active denitrifiers adhering on that cathode.7–10 Compared to traditional biological nutrient removal techniques, denitrifying BES (DN-BES) has obtained high nitrogen removal efficiency, even under a low C/N ratio.11 Since the first denitrifying microbial fuel cell (MFC) was constructed by Clauwaert et al.,12 configurations, operating parameters, and substrates of DN-BESs have been sufficiently studied. Theoretically, removal rates of substrates such as NOx− in bio-reactors are dependent on the type and loading of electron acceptors. However, it was observed that as long as NOx− loading was kept the same, similar removal rates and efficiencies were observed in BESs for different nitrogen sources.10 Therefore, denitrification kinetics of DN-BESs for different electron acceptors is needed in order to summarize influencing factors and provide prediction for nitrogen removal in DN-BESs regardless of the conditions used in different studies or reactors. In this study, effects of the type and initial concentration of NOx− on particular DN-BESs were investigated to determine their impact on denitrification rate, and to show similarities and differences for denitrification kinetics of nitrate and nitrite simulated by models.Cathodic efficiency, a ratio of electrons consumed and converted to N2 vs. total electrons donated from the electrode, is an important parameter which shows efficiency and completeness of denitrification with DN-BES. A high cathodic efficiency is normally desired, but may change with various conditions. Due to occurrence of denitrification intermediates, such as N2O, not all nitrogen-containing compounds are completely reduced to N2 in cathode chambers. Cathode potential, pH, and electron acceptor type have been reported to influence denitrification end-products.9,13,14 For example, a suitably low potential or high pH can suppress the yield of N2O.13,14 It is also worthy to investigate concentration effects of NOx− on cathodic efficiency in DN-BESs.
Previously, the 16S rRNA gene-based phylogenic information of microbial consortia for cathodic denitrification through sequencing analysis have been studied, and Bacteroidetes, Proteobacteria, Firmicutes, Chloroflexi, and Planctomycetes are reported as five typical dominant phyla for denitrifying biocathodes.15–18 Classes of Alphaproteobacteria, Anaerolineae, and Phycisphaerae may benefit the performance of current production and nitrate removal.18 Nevertheless, if only phylogenic information is used, then major functional denitrifiers in the microbial consortia of cathodic biofilms can't be specified. In the denitrification process, various denitrifying enzymes have been identified that catalyze the reduction processes of nitrogen compounds (e.g., Nar, Nap, Nir, Nor, Nos, etc., are responsible for different reduction pathways of NOx−). Among those, Nir is related to nitrite reduction while Nor and Nos are responsible for NO and N2O reductions, respectively. Their encoding genes, termed as denitrifying functional genes, have clear correspondences to these denitrifying enzymes. Through comparing diversities and abundances of denitrifying functional genes on a biocathode with different electron acceptors in practice, it is helpful to clarify contributions of different phylogeny to denitrification on biocathodes. In a previous study, relative abundances and absolute quantities of five denitrification genes (narG, napA, nirK, nirS, and nosZ) were detected at two working conditions with nitrate or nitrite, and valuable conclusions were demonstrated using comprehensive molecular biology tests. For example, nirS-containing denitrifiers are dominant at both conditions, and 90% of retrieved nosZ sequences group into an OTU with a high similarity to the Oligotropha carboxidovorans nosZ gene occurred.9 However, only classified functional genes in the family level were used without pointing out any significant genus on the denitrifying biocathodes. Thus, in this study, except for 16S rRNA gene sequencing analysis, the diversity of denitrifying functional genes (nirK, nirS, norB and nosZ) was investigated at the genus level to elucidate the influence of electron acceptors on the cathodic denitrifying community and reveal the key denitrifier in the denitrifying processes.
2. Experimental
2.1 Bioelectrochemical system set-up and operation
Three DN-BESs for simultaneous carbon and nitrogen removal (named R1, R2, and R3) were operated in the same reactors, except only with different cathodic N compounds such as NO3−, NO2− and their mixtures, respectively. Each reactor consisted of a two-compartment cell with a net cathodic compartment volume of 150 mL and an anodic compartment volume of 15 mL. Two carbon felts (16 cm2) connected with titanium wires were used as an anode and a cathode, respectively. A proton exchange membrane (Nafion 117, Dupont Co., USA) was used to separate the anode and cathode compartments. A standard calomel electrode (SCE, E = +0.2415 V vs. Standard Hydrogen Electrode; model: Rex 232, China) was placed in a saturated KCl solution, which was connected to the cathode chamber by a salt bridge during the experiments. The anode and cathode electrodes were connected to a battery tester (5 V 50 mA, Neware, China).During operation, the cathode chambers were fed with a medium containing 3.5 g L−1 NaHCO3, 0.6 g L−1 KCl, 0.2 g L−1 MgSO4·7H2O, 12.5 mL L−1 trace minerals, and 25 μL L−1 Vitamin solution. Then, 0.45 g L−1 NO3−–N, NO2−–N or their mixture (0.225 g L−1 NO3−–N +0.225 g L−1 NO2−–N) was fed into R1, R2, and R3 in a batch mode, respectively. Anode chambers were added with 0.1 M Na2SO4 solution. All solutions were completely replaced after each experiment. The reactors were sealed with silicone rubber to ensure strict anaerobic conditions. Before the experiments, the whole cathode chambers, including headspace and fluid, were purged with argon gas (purity > 99.9%) for 10 min. BESs were operated at room temperature.
Prior to culturing denitrifiers, all reactors were operated under abiotic conditions as controls. Later, cathode chambers of the BESs were inoculated with activated sludge collected from the Qinghe Wastewater Treatment plant (Beijing, China). Biofilm on the cathode formed under the supply of an electric current at 0.05 mA. When the cathodic potential rose above −0.2 V vs. SCE, then BES was changed to the potentiostatic mode (Ecathode = −0.2 V vs. SCE). After another 10 days of operation, consistencies in denitrification were observed and further experimental studies were carried out. Three replicate tests were performed with each condition during all experiments.
2.2 Chemical analysis
From the bioelectrochemical denitrification system, liquid samples were collected for NO3–N and NO2−–N every day and were immediately filtered using a syringe filter (0.22 μm). Samples were stored at 4 °C and analysed using an ion chromatograph (861-Basic IC, Mettler Toledo, Switzerland) as soon as possible.10Gas samples were collected before and after each batch of experiments. The partial volume of N2 in each sample was immediately analysed by a gas chromatograph (GC-2010C, Shimadzu, Japan) and the cathode chambers were purged with argon gas for 10 min before the next batch.
2.3 Kinetic model fitting
Substrate removal rates were fitted by using the Monod model, which previously has been used to describe kinetics of enzymatic reactions for substrate biodegradation.19–21 The model is as follows
 | (1) |
2.4 Cathodic efficiency calculation
In theory, nitrogen-containing substrates can be ultimately reduced to N2 gas in a cathode chamber in DN-BES.12| 2NO3− + 10e− + 12H+ → N2 + 6H2O |
| 2NO2− + 6e− + 8H+ → N2 + 4H2O |
The theoretical cathodic electron consumption Qth can be converted by N2 yield, and experimental cathodic electron consumptions Qexp were recorded in a battery testing system. Their ratios were calculated as cathodic efficiency η, based on the following equations
 | (2) |
 | (3) |
 | (4) |
![[thin space (1/6-em)]](https://www.rsc.org/images/entities/char_2009.gif) 485 C mol−1; Vm is molar volume, which is 24.5 L mol−1 under 25 °C and 101 kPa; Qexp (C) is the experimental electron consumption; I (A) is reaction current; and t (s) is reaction time.
485 C mol−1; Vm is molar volume, which is 24.5 L mol−1 under 25 °C and 101 kPa; Qexp (C) is the experimental electron consumption; I (A) is reaction current; and t (s) is reaction time.
2.5 Molecular biological analysis
To compare the diversities in bacterial communities and functional genes and their differences in each BES, cathode biofilm in three BESs were sampled and collected. For biofilm samples, the cathode sheets were cut into pieces and dispersed in 4 mL sterile PBS by ultrasound. Then, 2 mL mixed liquor was used to extract the biofilm community DNA with an UltraClean®Soil DNA Isolation Kit (MoBio Laboratories, San Diego, USA) according to the manufacturers' protocol. For high-throughput sequencing, bacterial 16S rRNA genes and four denitrification genes were amplified by using a set of specific primers, and these primers sequences are presented in Table S1.† For 16S rRNA gene amplification, each DNA sample was PCR amplified with primers targeting the hypervariable V1–V2 region of the 16S rRNA gene with a length of 460 bp. Each purified amplicon bearing an individual 10 nucleotide barcode was mixed together in equal amounts for high through-put sequencing with an Illumina HiSeq 2000 (illumine, USA). A library consisting of 180 bp DNA fragment sequences was constructed according to the manufacturer's instructions before DNA sequencing. The strategy “Index 101 PE” (Paired End sequencing, 101 bp reads, and 8 bp index sequence) was used for the Illumina sequencing. Similarly, extracted DNA samples were subjected to be PCR amplified using primer sets specific for the gene encoding for nitrite, nitric oxide, and nitrous oxide reductase; namely nirK, nirS, norB, and nosZ, respectively. The PCR amplifications for different denitrification functional genes were subjected to sequencing with the same strategy of 16S rRNA genes.The gene sequences obtained from high-throughput sequencing were sorted in a Mothur utility (http://www.mothur.org/) as described in a previous study.22 Taxonomic classification of the sequences was conducted using the RDP's Classifier. Diversity indices such as observed Operational Taxonomic Units (OTUs) richness and Shannon index were determined by the Mothur utility.
In order to study the diversity of functional genes involved in cathodic denitrification in DN-BESs, four databases containing sequences of nirK, nirS, norB, and nosZ deposited in the Functional Gene Pipeline (http://fungene.cme.msu.edu/) were downloaded. After removing redundancies, the local database contained 6947, 7615, 7891, and 4890 sequences for nirK, nirS, norB, and nosZ gene, respectively. BLASTn was used to align all the sequencing reads against the local database, and a read was identified as nirK, nirS, norB, and nosZ if the BLAST hit (E-value cutoff at 10−5) had a nucleotide sequence identity of above 90% over an alignment of at least 50 bp.
2.6 Nucleotide sequence accession number
The high-throughput sequencing datasets derived in this study have been uploaded to the NCBI Short Read Archive Database (accession number: SRP103393).3. Results and discussion
3.1 Biocathodic denitrification of nitrate and nitrite
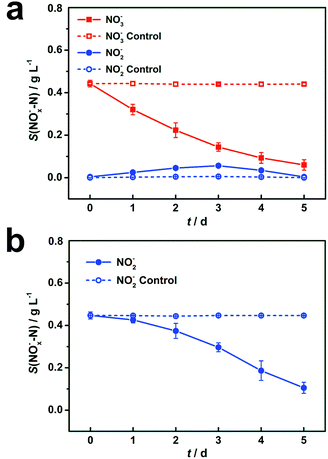
During the DN-BESs operation, 0.44 g L−1 of NO3−–N was reduced to 0.06 g L−1 in 5 days in R1, with a removal efficiency of 86.1% (Fig. 1a). In R2, the initial 0.45 g L−1 of NO2−–N was reduced to 0.10 g L−1 with a removal efficiency of 76.4% (Fig. 1b). In comparison, an abiotic cathode showed negligible nitrogen removal, with only 0.7% and 0.1% of nitrogen reduction, indicating that the abiotic denitrification in DN-BESs rarely occurs under the operational conditions.3.2 Kinetics of nitrogen compounds degradation
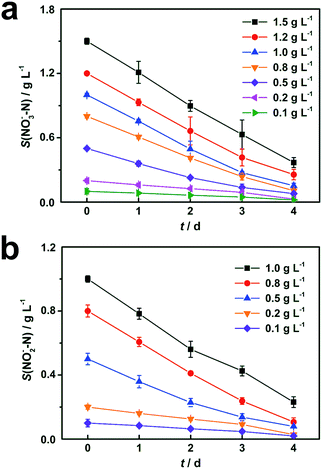
Results of cathodic nitrate reduction under different initial concentrations are shown in Fig. 2a. When the initial nitrate concentrations in the catholyte were in the range from 0.1 g L−1 to 1.5 g L−1, over 75% of nitrate removal efficiencies were obtained within 4 days of operation. Nitrite reduction in DN-BES (R2) also shows a similar trend as nitrate in the range from 0.1 g L−1 to 1.0 g L−1, as shown in Fig. 2b.In order to investigate the effect of initial substrate concentration on nitrogen removal rate in the BES, nitrogen removal rates were calculated from the curves in Fig. 2. The nitrogen removal rates increased with increased substrate concentration. Therefore, it is reasonable to use the Monod model to describe this denitrification process. Results from Fig. 3 demonstrate that the Monod model fits the experimental data quite well with high coefficients (R2) of 0.997 for nitrate and 0.999 for nitrite, respectively.
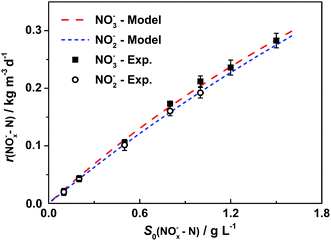 | ||
| Fig. 3 Monod model fitting for removal rates vs. initial substrate concentrations. Represented values are the means and standard deviations (n = 3) at each condition. Each point represents a nitrogen removal rate at the corresponding initial nitrogen concentration, which is calculated based on biocathodic denitrification tests in Fig. 2. Monod model is utilized for curve fitting of the experimental data, and is represented by the dashed lines. The X-axis, S0(NOx−–N), is the initial nitrate or nitrite concentration and the Y-axis, r(NOx−–N) is nitrogen removal rate, in form of nitrate (x = 3) or nitrite (x = 2) in cathodic chambers. | ||
For nitrate, the maximum removal rate rmax is 1.33 kg N m−3 d−1 and the half-saturation coefficient is Ks is 5.52 g L−1. Generally, Ks describes the affinity between an enzyme and its substrate. A high value of Ks implies that high substrate concentrations are favorable for the operation.23 The equation for nitrate removal in R1 is:
 | (5) |
Similar to nitrate removal, nitrite degradation shows rmax and Ks are 1.76 kg N m−3 d−1and 8.09 g L−1, respectively.
The equation for nitrite removal in R2 is:
 | (6) |
Comparing the nitrate and nitrite degradation processes in theory, both are reduced exclusively by denitrifying enzymes.24 Therefore, when fitted by the Monod model, the relationships between nitrogen removal rates and initial substrate concentrations show a good match. The key parameters rmax and Ks of two electron acceptors are in the same order of magnitude, indicating that the degrading capability and affinity to substrates of these two biocathodes are similar. And two monotone increasing degradation curves demonstrate that the degrading processes of two electron acceptors have not been inhibited by substrates or intermediates with this experimental condition. In summary, there are no significant differences between nitrate and nitrite degradation in DN-BESs, which supports previous results that the major influencing factor for nitrogen degradation in denitrification cathodes is the inflow substrate concentration but not the electron acceptor type.10
3.3 Cathodic efficiency of BESs with different substrates
Cathodic efficiencies vary with different initial nitrate or nitrite concentrations (Fig. 4). Results show there is an optimal cathodic efficiency for each nitrogen source. For both electron acceptors, optimal cathodic efficiencies were obtained at the initial concentration of 0.5 g L−1. Based on the kinetics model, a possible explanation is that denitrifying capabilities of the biocathodes increase with nitrogen concentration increases but the biocathodes lack enough enzymes to remove all the intermediates under high concentrations. Results also show that all the cathodic efficiencies for NO2− are higher than those for NO3−, which is probably because the reduction of nitrite to nitrogen undergoes fewer steps than nitrate.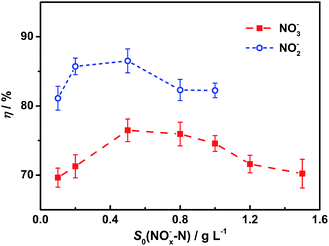 | ||
| Fig. 4 Cathodic efficiencies for nitrite and nitrate under different initial concentrations. Represented values are the means and standard deviations (n = 3) at each condition. Cathodic efficiencies are calculated based on the results of biocathodic denitrification tests with eqn (4). S0(NOx−–N) and η mean the initial nitrogen concentration in forms of nitrate (x = 3) or nitrite (x = 2) in cathodic chambers and the cathodic efficiency, respectively. | ||
3.4 Bacterial community structure of DN-BESs biocathode with different nitrogen sources
There is a great diversity of microbial population in the bio-community of DN-BES's biocathodes and cathodic electron acceptors and that directly impacts the diversity of biocathodes. Bio-diversity indexes were calculated to demonstrate relationships between cathodic bio-diversity and nitrogen resource type, as listed in Table 1. Results show the Shannon index of R3 (NO3− + NO2−) > R1 (NO3−) > R2 (NO2−), indicating that mixed nitrogen resources promote more denitrifiers than those for any single NO3− or NO2−.| Substrate | Ace | Chao1 | Shannon index | Simpson index |
|---|---|---|---|---|
| a Ace: the total number of OTUs estimated by infinite sampling. A higher number indicates higher richness. Chao1: the total number of OTUs estimated by infinite sampling. A higher number indicates higher richness. Shannon index: an index to characterize species diversity. A higher number represents more diversity. Simpson index: an index to characterize species diversity. A higher number represents less diversity.25 | ||||
| NO3− | 4346 | 3546 | 5.89 | 0.0082 |
| NO3− + NO2− | 5357 | 4411 | 6.02 | 0.0081 |
| NO2− | 2928 | 2465 | 5.46 | 0.0142 |
| Inoculum | 4493 | 3604 | 5.73 | 0.0091 |
In, this study, a total of 36![[thin space (1/6-em)]](https://www.rsc.org/images/entities/char_2009.gif) 281 16S rRNA gene sequences were first classified in the phylum level. Results in Fig. S1† show that the microbial community patterns in denitrifying cathodic biofilm are similar, and the dominant phyla are Proteobacteria and Bacteroidetes, which is consistent with previous research.15–18,26 Proteobacteria occupies about 40% of the total population in each of the biocathodes, with no significant differences among the three DN-BESs. Nevertheless, Bacteroidetes is enriched in the nitrite reduction reactor (R2), indicating that Bacteroidetes may favour nitrite as an electron acceptor. Similarly, when NO2− is the sole electron acceptor, Firmicutes in R2 is more than that in R1 (NO3−) and R3 (NO3− + NO2−). However, because Firmicutes is a typical group of anaerobic bacteria, which usually harvests energy heterotrophically,27 an autotrophic condition in a cathodic chamber may limit its activity. TM7, Nitrospira, and Actinobacteria were also observed in all the samples. Contrary to Bacteroidetes and Firmicutes, TM7 and Actinobacteria are enriched in R1 (NO3−) thus, they could play an increasing role in nitrate removal. Another common dominant phylum in DN-BES, Chloroflexi, did not accumulate in all of three reactors.
281 16S rRNA gene sequences were first classified in the phylum level. Results in Fig. S1† show that the microbial community patterns in denitrifying cathodic biofilm are similar, and the dominant phyla are Proteobacteria and Bacteroidetes, which is consistent with previous research.15–18,26 Proteobacteria occupies about 40% of the total population in each of the biocathodes, with no significant differences among the three DN-BESs. Nevertheless, Bacteroidetes is enriched in the nitrite reduction reactor (R2), indicating that Bacteroidetes may favour nitrite as an electron acceptor. Similarly, when NO2− is the sole electron acceptor, Firmicutes in R2 is more than that in R1 (NO3−) and R3 (NO3− + NO2−). However, because Firmicutes is a typical group of anaerobic bacteria, which usually harvests energy heterotrophically,27 an autotrophic condition in a cathodic chamber may limit its activity. TM7, Nitrospira, and Actinobacteria were also observed in all the samples. Contrary to Bacteroidetes and Firmicutes, TM7 and Actinobacteria are enriched in R1 (NO3−) thus, they could play an increasing role in nitrate removal. Another common dominant phylum in DN-BES, Chloroflexi, did not accumulate in all of three reactors.
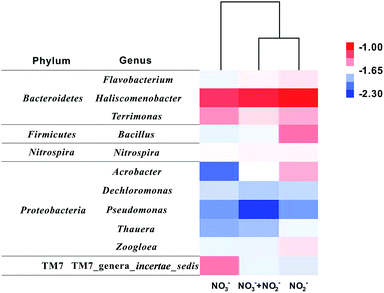
Furthermore, 16S rRNA gene sequences are clustered in the genus level (Fig. 5). Totally, 11 main genera (abundances were over 1% in at least one sample) were counted. More than half of these 11 dominant genera were enriched in R2 for bioelectrochemical NO2− reduction, but only three genera accumulated in R1 for NO3− reduction. Haliscomenobacter is the absolute dominant genus (>6%) in three samples. Besides, Bacillus, Acrobacter, and TM7 genera_incertae_sedis show obvious difference as well. The former two genera Bacillus and Acrobacter were dominant in R2, enriched for biocathodic NO2− reduction, while TM7_genera_incertae_sedis accumulated in R1, which may be specific for nitrate reduction. Results of the cluster analysis also show that the bacterial community structure of R2 (NO2−) and R3 (NO2− + NO3−) are more similar than that of R1 (NO3−), indicating nitrite has a stronger screening effect on the cathodic microbial communities shift in DN-BESs. However, the contribution of these dominant genera to different denitrification steps cannot be answered using only phylogenic information. Therefore, the diversity of denitrifying functional genes was further analysed to specify which genera were responsible for reductions of different nitrogen sources.
3.5 Denitrifying functional gene diversities in cathodic biofilms with different nitrogen sources
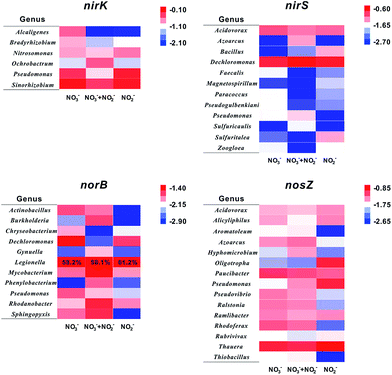
Generally, six representative genes (narG, napA, nirK, nirS, norB, and nosZ) were utilized to analyse denitrification species.9,28 Nevertheless, whether nitrate reductases are characteristic for the nitrate reducing process is still under debate.29 As mentioned above, it is speculated that nitrite controls the shift of denitrifiers on a biocathode. Thus, four functional genes relate to denitrification of NO2− and its intermediates (nirK, nirS, norB, and nosZ) were selected for a further analysis. The PCR products amplified with primers targeting denitrifying functional genes were assigned to host bacteria at the genus level.30 Considering the high genetic diversity, only gene abundance over 1% of total copies were counted and clustered. Statistic results are shown in Fig. 6 and S2.†The nirK gene is responsible for encoding copper-containing nitrite reductases (Cu-Nir) which reduce nitrite to NO and N2O.31,32 Sinorhizobium, Pseudomonas, and Nitromonas are three major nirK gene origins in these samples. Abundances of nirK gene of Sinorhizobium and Nitromonas exhibit no significant distinctions. However, the abundance of nirK gene hosted in Pseudomonas in R2 (22.3%) is more than that in the other two reactors (17.9% in R1 and 8.1% in R3), indicating that Pseudomonas favours nitrite. Interestingly, Pseudomonas is the only genus appearing in four denitrifying functional gene diversities, as shown in Fig. 6, which means that Pseudomonas has enzymes to reduce all intermediates in denitrification processes. Besides, it has been reported that there are membrane-bound nitrate reductases in Pseudomonas and its Nar gene has been separated and sequenced.33 So, it is no wonder that Pseudomonas is an important genus in DN-BESs and that it has capability to complete all the denitrification pathways. Contrary to Pseudomonas, Alcaligenes shows a negative correlation to nitrite concentration.
Compared to the nirK gene, nirS gene encodes cytochrome-containing nitrite reductases (cd1-Nir) which also reduce nitrite to NO and N2O.34 Because Cu-Nirs and cd1-Nirs cannot express in the same cell after all,29 the genera containing nirK and nirS genes, which are influenced by nitrite contribution, are totally different. Two dominant genera containing nirS genes are Dechloromonas (15.9–26.3%) and Acidovorax (6.4–9.2%). The abundances of Bacillus and Sulfurutalea nirS genes are mainly present in R2 (NO2−), demonstrating that these two genera apparently are influenced by nitrite, with over 4% of differences in abundances.
The norB gene is a nitric oxide reductases encoding gene. In this study, norB genes stemming from Legionella possess over 60% in each sample, although the abundance of Legionella is less than 1% in 16S rRNA analysis, demonstrating that this genus has an efficient NO reduction capability and plays an important role in NO reduction in DN-BESs.
It was reported that almost all the nirS-containing microbes also have nosZ, the nitrous oxide reductases encoding gene,35 which is consistent with results in this study. There are some denitrifiers, such as Acidovorax and Azoarcus, existing in both nirS and nosZ diversities. Another notable result is that nosZ genes from Oligotropha and Pseudomonas are enriched in the nitrite reactor (R2). A possible reason is N2O accumulation in R2, which was also demonstrated in previous studies that nitrous oxide (N2O) always accumulates in bio-cathodic chambers, especially in reactors with nitrite.9 It is speculated that increasing N2O in R2 promotes increases of Oligotropha and Pseudomonas nosZ genes and these two genera may have an adaptation to a higher N2O concentration compared with others. As mentioned above, it is worth noting that Pseudomonas has potential for efficient denitrification in DN-BESs.
In summary, compared to 16S rRNA analysis, denitrifying functional gene analysis showed more definite and valuable results. In DN-BES cathodes, different electron acceptors can screen out main denitrifiers. The abundances of nirK or nosZ genes in some specific genera have obvious affects on electron acceptor changes, indicating that these two kinds of denitrifying functional genes are useful for denitrifier detections in DN-BESs. Particularly, Pseudomonas is worth further studying due to its complete denitrifying enzyme chains and highly efficient capability.
4. Conclusions
Electron acceptor type has an impact on biodiversity of biocathodes in DN-BES and the substrate concentration directly influences cathodic kinetics. No matter nitrate (0.1–1.5 g L−1) or nitrite (0.1–1.0 g L−1), the Monod equation well describes the relationship between initial substrate concentration and removal rate in DN-BES without substrate inhibition. Similar kinetic parameter values fitted by the Monod model explain the similarity between nitrate and nitrite degradation in DN-BESs. Cathodic efficiency changes with the type of electron acceptors and their initial concentrations as well. Optimal cathodic efficiencies of two reactors were observed at 0.5 g NOx−–N L−1. Based on molecular biological analysis, a high biodiversity appears in the biocathode. Proteobacteria, Bacteroidetes, and Firmicutes are the dominant populations in cathodic biofilms and nitrite is a significant factor to shifts of microbial community structures in DN-BESs. Further, denitrification functional gene classification reveals that abundances of some effective denitrifiers containing nirK and nosZ genes, especially Pseudomonas, greatly affect the electron acceptor.Acknowledgements
This work was financially supported by grants from the Beijing Nova Program [Z131109000413008]; National Natural Science Foundation of China [No. 21373022, 21073010, 21003007 and U1137602]; and International Science & Technology Cooperation Program from the Ministry of Science and Technology of China [2015DFG52700].Notes and references
- K. Rabaey and R. A. Rozendal, Nat. Rev. Microbiol., 2010, 8, 706–716 CrossRef CAS PubMed.
- P. T. Kelly and Z. He, Bioresour. Technol., 2014, 153, 351–360 CrossRef CAS PubMed.
- Y. V. Nancharaiah, S. V. Mohan and P. N. L. Lens, Bioresour. Technol., 2016, 215, 173–185 CrossRef CAS PubMed.
- L. Lu and Z. Y. J. Ren, Bioresour. Technol., 2016, 215, 254–264 CrossRef CAS PubMed.
- P. Pandey, V. N. Shinde, R. L. Deopurkar, S. P. Kale, S. A. Patil and D. Pant, Appl. Energy, 2016, 168, 706–723 CrossRef CAS.
- N. Pous, C. Koch, A. Vila-Rovira, M. D. Balaguer, J. Colprim, J. Muhlenberg, S. Muller, F. Harnisch and S. Puig, RSC Adv., 2015, 5, 68326–68333 RSC.
- S. Puig, M. Serra, A. Vilar-Sanz, M. Cabre, L. Baneras, J. Colprim and M. D. Balaguer, Bioresour. Technol., 2011, 102, 4462–4467 CrossRef CAS PubMed.
- J. Desloover, S. Puig, B. Virdis, P. Clauwaert, P. Boeckx, W. Verstraete and N. Boon, Environ. Sci. Technol., 2011, 45, 10557–10566 CrossRef CAS PubMed.
- A. Vilar-Sanz, S. Puig, A. Garcia-Lledo, R. Trias, M. D. Balaguer, J. Colprim and L. Baneras, PLoS One, 2013, 8 CAS.
- S. Kondaveeti, S. H. Lee, H. D. Park and B. Min, Water Res., 2014, 51, 25–36 CrossRef CAS PubMed.
- F. Zhang and Z. He, Process Biochem., 2012, 47, 2146–2151 CrossRef CAS.
- P. Clauwaert, K. Rabaey, P. Aelterman, L. De Schamphelaire, T. H. Ham, P. Boeckx, N. Boon and W. Verstraete, Environ. Sci. Technol., 2007, 41, 3354–3360 CrossRef CAS PubMed.
- B. Virdis, K. Rabaey, Z. G. Yuan, R. A. Rozendal and J. Keller, Environ. Sci. Technol., 2009, 43, 5144–5149 CrossRef CAS PubMed.
- Y. Xiao, S. Wu, Z. H. Yang, Z. J. Wang, C. Z. Yan and F. Zhao, Chemosphere, 2013, 93, 1295–1300 CrossRef CAS PubMed.
- Z. He, J. J. Kan, Y. B. Wang, Y. L. Huang, F. Mansfeld and K. H. Nealson, Environ. Sci. Technol., 2009, 43, 3391–3397 CrossRef CAS PubMed.
- G. W. Chen, S. J. Choi, J. H. Cha, T. H. Lee and C. W. Kim, Korean J. Chem. Eng., 2010, 27, 1513–1520 CrossRef CAS.
- K. C. Wrighton, B. Virdis, P. Clauwaert, S. T. Read, R. A. Daly, N. Boon, Y. Piceno, G. L. Andersen, J. D. Coates and K. Rabaey, ISME J., 2010, 4, 1443–1455 CrossRef CAS PubMed.
- Y. Xiao, Y. Zheng, S. Wu, Z. H. Yang and F. Zhao, Microb. Ecol., 2015, 69, 492–499 CrossRef CAS PubMed.
- L. Foglar and F. Briski, Process Biochem., 2003, 39, 95–103 CrossRef CAS.
- J. R. Sonnad and C. T. Goudar, Math. Comput. Model., 2004, 40, 573–582 CrossRef.
- L. Foglar, F. Briski, L. Sipos and M. Vukovic, Bioresour. Technol., 2005, 96, 879–888 CrossRef CAS PubMed.
- T. Zhang, M. F. Shao and L. Ye, ISME J., 2012, 6, 1137–1147 CrossRef CAS PubMed.
- J. Q. Zhang, P. Zheng, M. Zhang, H. Chen, T. T. Chen, Z. F. Xie, J. Cai and G. Abbas, Bioresour. Technol., 2013, 149, 44–50 CrossRef CAS PubMed.
- J. O. Lundberg, M. T. Gladwin, A. Ahluwalia, N. Benjamin, N. S. Bryan, A. Butler, P. Cabrales, A. Fago, M. Feelisch, P. C. Ford, B. A. Freeman, M. Frenneaux, J. Friedman, M. Kelm, C. G. Kevil, D. B. Kim-Shapiro, A. V. Kozlov, J. R. Lancaster Jr, D. J. Lefer, K. McColl, K. McCurry, R. P. Patel, J. Petersson, T. Rassaf, V. P. Reutov, G. B. Richter-Addo, A. Schechter, S. Shiva, K. Tsuchiya, E. E. van Faassen, A. J. Webb, B. S. Zuckerbraun, J. L. Zweier and E. Weitzberg, Nat. Chem. Biol., 2009, 5, 865–869 CrossRef CAS PubMed.
- B. Z. Xie, B. J. Liu, Y. Yi, L. Yang, D. W. Liang, Y. Zhu and H. Liu, Bioresour. Technol., 2016, 207, 109–117 CrossRef CAS PubMed.
- S. H. Lee, H. J. Kang, Y. H. Lee, T. J. Lee, K. Han, Y. Choi and H. D. Park, J. Environ. Monit., 2012, 14, 1893–1905 RSC.
- H. D. Ariesyady, T. Ito and S. Okabe, Water Res., 2007, 41, 1554–1568 CrossRef CAS PubMed.
- D. Chen, K. Yang, L. Wei and H. Y. Wang, Bioresour. Technol., 2016, 218, 189–195 CrossRef CAS PubMed.
- L. Y. Guo, F. Shi and L. Y. Yang, Microbiology, 2011, 38, 583–590 CAS.
- Y. Miao, R. H. Liao, X. X. Zhang, B. Liu, Y. Li, B. Wu and A. M. Li, Chem. Eng. J., 2015, 277, 116–123 CrossRef CAS.
- P. Tavares, A. S. Pereira, J. J. G. Moura and I. Moura, J. Inorg. Biochem., 2006, 100, 2087–2100 CrossRef CAS PubMed.
- K. L. Casciotti and B. B. Ward, Appl. Environ. Microbiol., 2001, 67, 2213–2221 CrossRef CAS PubMed.
- L. Philippot, P. Mirleau, S. Mazurier, S. Siblot, A. Hartmann, P. Lemanceau and J. C. Germon, Biochim. Biophys. Acta, Gene Struct. Expression, 2001, 1517, 436–440 CrossRef CAS.
- N. Hasegawa, H. Arai and Y. Igarashi, Biochem. Biophys. Res. Commun., 2001, 288, 1223–1230 CrossRef CAS PubMed.
- C. M. Jones, B. Stres, M. Rosenquist and S. Hallin, Mol. Biol. Evol., 2008, 25, 1955–1966 CrossRef CAS PubMed.
Footnote |
| † Electronic supplementary information (ESI) available: Primers for high-throughput sequencing; relative abundances of dominant 16S rRNA gene in phylum level; relative abundances of four functional genes. See DOI: 10.1039/c7ra04070a |
| This journal is © The Royal Society of Chemistry 2017 |

