 Open Access Article
Controlled synthesis of Sn-based oxides via a hydrothermal method and their visible light photocatalytic performances†
Jinghui Wanga,
Hui Lia,
Sugang Meng a,
Xiangju Ye*b,
Xianliang Fu
 *a and
Shifu Chenab
aCollege of Chemistry and Material Science, Huaibei Normal University, Huaibei, Anhui 235000, China. E-mail: fuxiliang@gmail.com; Fax: +86-561-3090518; Tel: +86-561-3802235
bDepartment of Chemistry, Anhui Science and Technology University, Fengyang, Anhui 233100, China. E-mail: yexiangju555@126.com
First published on 22nd May 2017
Abstract
Controlled synthesis of Sn-based oxides with a different valence state is still a challenge. Here, we developed a facile hydrothermal method for selective preparation of SnO2, Sn2+ doped SnO2 (Sn2+–SnO2), and SnO/SnO2 composites, and SnO with SnCl2 as a precursor. The valence state of Sn was regulated successively from Sn4+ to Sn2+ through controlling the hydrothermal solution from an O2-rich to an O2-deficient atmosphere, which was achieved by adding H2O2 or urea into the solution. The structure, absorption, morphology, and the visible light photocatalytic performance of the products were investigated systematically. SnO2, Sn2+–SnO2, SnO/SnO2, and SnO could be prepared in a H2O2-contained, H2O, urea-contained, and N2 purged urea-contained solution, respectively. For Sn2+–SnO2, the doping amount of Sn2+ could be further tuned by varying the hydrothermal temperature, while for SnO/SnO2, the coupling amount of SnO could be controlled by the dosage of urea. Visible-light-induced photocatalytic degradation of methyl orange was achieved successfully on Sn2+–SnO2 and SnO/SnO2. However, further work is still required to improve the stability of the samples due to vulnerability of Sn2+.
1. Introduction
As a variable valence metal, Sn-based oxides can be in the form of univalent (SnO and SnO2) or heterovalent oxides (Sn2O3 and Sn3O4, formed by regulating Sn2+/Sn4+ ratio1). The univalent SnO and SnO2 have attracted considerable attention during the past years because of their excellent optical, electrical, and electrochemical properties.2–8 For SnO, it can be used as anode materials in Li-batteries,7 coating materials,9 and catalysts for cyclization of maleamic acid.9 Furthermore, as Sn2+ can be easily oxidized to Sn4+ through a heat treatment in air, it can be used as a sacrificial template to prepare SnO2, another versatile Sn oxide. Due to its high optical transparency in the visible range, the remarkable receptivity to variation of gas, the low resistivity, and the excellent chemical stability, SnO2 has been extensively used in transparent conductive electrodes,4 gas sensors,10,11 Li-batteries,5 sensitized solar cells,12 and photocatalysts.13–15 To optimize the SnO and SnO2 performances, various preparation methods including sol–gel, precipitation, hydrothermal, solvothermal, thermal evaporation, electrospinning, and laser ablation have been developed to manipulate their sizes, structures, and morphologes.8 Taking SnO2 as an example, the particle size can be reduced through a surfactant-assisted solvothermal16 or hydrothermal17,18 route, while as for the morphologies, 0 to 3 dimensional SnO2 nanostructures, such as nanoparticles, nanorods, nanowires, nanotube, nanosheets, and the 3D hierarchical architectures self-assembled from these low-dimensional nanostructures, have been subtly fabricated.8 Although the structure and the morphology of the Sn oxides can be readily controlled by using different preparation routes, there still is a lacks of a versatile fabrication route to control the component of the product, which is a key prerequisite for the applications. Most of the preparation methods are only suitable for the preparation of one of the Sn oxides.Semiconductor-based photocatalytic technology possesses a great potential in the environmental remediation for its “green”, high efficiency, and broad applicability.19,20 Photocatalytic degradation of pollutants on Sn oxides, especially SnO2, has been extensively investigated. Unfortunately, as a well-known n-type semiconductor, SnO2 can only be activated under UV irradiation due to the wide-band gap energy (3.5–3.8 eV).21–23 Furthermore, the activity is significantly restricted by the quick recombination of photo-induced charge carriers (e− and h+). Although the separation of e− and h+ can be improved by compositing SnO2 with TiO2,24,25 ZnO26,27 and Zn2SnO4,28,29 extending SnO2 absorption to visible light range which accounts for 43% of the solar spectrum is still required to maximize the utilization of sunlight. Doping (non)-metallic elements is an effective strategy to narrow the band gap. However, the sample thermal stability and the separation of e− and h+ are generally hampered by the doping with heterogeneous elements. These disadvantages can be avoided by a self-doping approach,30–33 which introduces no impurity elements into the sample. The validity of the self-doping has been confirmed on the Ti3+ doped TiO2 and some Sn2+ doped Sn ternary oxides (Sn2+–SnM2O6, M = Ta or Nb).34–36
Meanwhile, some other reports noted that SnO incorporated samples have a significant visible light activity in the degradation of organic pollutants.1,37–40 These works arouse our interest that the visible light photocatalytic performance of SnO2 may also can be promoted by doping with Sn2+ or incorporating with some Sn2+-contained species like SnO, Sn2O3 or Sn3O4. The visible light photocatalytic performances of some Sn2+-contained samples, such as SnO2−x,41 Sn3O4,42 SnO–TiO2,43 SnO/Sn3O4,1 and Sn3O4/TiO2,44 demonstrate the feasibility of the strategy.
However, it remains difficult to incorporate Sn2+ species into SnO2 as Sn2+ is easily oxidized to Sn4+. Controlling the Sn oxidation state is still a critical challenge. Recently, Fan's work41 indicates that Sn2+ self-doped SnO2 can be skilfully prepared by a synproportionation reaction by adding Sn powder to the reaction solution: Sn + Sn4+ → Sn2+, while another work indicated that SnO and SnO2 can be selectively prepared by controlling the solution pH.45 These methods are limited to the preparation of one or two kinds of the Sn oxides. As far as we know, a facile method to synthesize a series of Sn oxides in a controlled way is still highly desired.
Herein, we developed a simple hydrothermal method to selective prepare a series of Sn oxides. Including SnO2, Sn2+ doped SnO2 (Sn2+–SnO2), SnO/SnO2 composite, and SnO were successfully synthesized through controlling the solution composition. The visible light photocatalytic performance of the samples was then evaluated by the degradation of methyl orange (MO) solution.
2. Experiments
2.1 Chemicals and preparation of Sn oxides
Analytical grade SnCl2·2H2O, urea (CO(NH2)2), H2O2, and MO were purchased from Aladdin Reagent Co. Ltd, Shanghai, China and used as received.2.2 Characterization
X-ray diffraction patterns of the samples were recorded on a Brucker D8 Advance diffractometer. UV-visible diffuse reflection spectra (UV-vis DRS) were recorded on a Vis-NIR spectrophotometer (TU-1950, Persee) with BaSO4 as a reference. Simultaneous thermal gravimetric analysis (TGA) and differential thermal analysis (DTA) of the Sn2+–SnO2 prepared at different temperatures were performed on a Shimadzu DTG-60H TG/DTA thermal analyser. N2 adsorption–desorption isotherms were obtained at 77 K by using a Micromeritics ASAP 2020 surface area analyzer. The morphologies were examined by a scanning electron microscopy (SEM, JSM-6610LV, Hitachi) and a transmission electron microscopy (TEM, FEI Tecnai G2 F20 S-TWIN). X-ray photoelectron spectroscopy (XPS) analysis was conducted on an ESCALAB 250 photoelectron spectrometer (Thermo Fisher Scientific) using Al Kα X-ray beam (1486.6 eV).2.3 Photocatalytic decolorization of MO
Photocatalytic degradation of MO solution was carried out in a tubular reactor which was surrounded by a water cooling jacket. A 300 W Xe lamp (CEL-HXF300) was used as a light source with a UV cut off filter (λ > 400 nm). The picture of the reaction system can be found in Fig. S1 (see ESI†). In a typical experiment, 100 mg sample was dispersed in 100 mL 10 ppm MO. The suspension was then stirred for 30 min in the dark to reach an adsorption–desorption equilibrium. During irradiation, the solution temperature was controlled at 20 °C by a Julabo F12 cooling bath (Julabo Labortechnik, Germany). 3.8 mL suspension was withdrawn through a pipette every 10 min. The residual MO in the supernatant was monitored by a spectrophotometer (TU-1950, Persee).2.4 Measurements of the photocurrent and the formation of hydroxyl radicals (˙OH)
The photocurrent test was conducted on a CHI 660E electrochemical workstation (Chenhua, Shanghai) in a conventional three-electrode cell with Pt wire as the counter electrode, Ag/AgCl electrode as the reference electrode, and the samples as the working electrode. The working electrode was fabricated by drop casting the sample powder dispersed water onto a FTO glass substrate (0.6 × 0.6 cm) followed by drying the electrode at room temperature. 0.2 M Na2SO4 aqueous solution was used as the electrolyte.The formations of ˙OH in the photocatalytic process were determined by photoluminescence (PL) technique with terephthalic acid (TA) as a probe molecule. The procedure was similar to the degradation of MO except that the solution was replaced by 100 mL 5 × 10⁻⁴ M TA and 2 × 10⁻³ M NaOH mixed solution. The fluorescence signal of TAOH adduct was measured by a fluorescence spectrophotometer (JASCO FP-6500).
3. Results and discussion
3.1 Characterization of Sn2+–SnO2 and SnO2
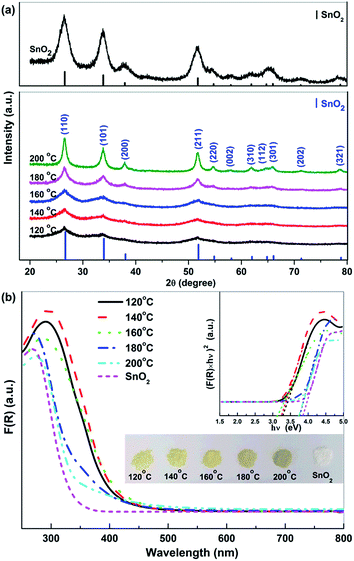
Fig. 1a shows the XRD patterns of Sn2+–SnO2 prepared at different hydrothermal temperature. The diffraction peaks can be assigned to tetragonal SnO2 (JCPDS No. 77-447). The broad peaks at 2θ ca. 27, 34, and 52° can be ascribed to the reflections of the (110), (101), and (211) planes of SnO2.46 The intensity of these peaks improves gradually with the hydrothermal temperature, indicating that the crystallization of SnO2 is favoured by an elevated temperature. The top of Fig. 1a shows the XRD pattern of the prepared SnO2. The diffraction peak can be assigned to tetragonal SnO2 and are more pronounced and sharpened than the sample prepared in pure H2O. This result suggests that, besides the conversion of Sn2+ to Sn4+, the crystallization of SnO2 was also promoted by the addition of H2O2. Similar function of H2O2 has been reported.47,48Fig. 1b shows the UV-vis DRS spectra of the Sn2+–SnO2. An absorption threshold at ca. 500 nm can be observed and the absorption edge shows a blue-shift with the hydrothermal temperature. A change of the samples color from pale yellow to slight brown then can be observed (see the inset of Fig. 1b). Although the samples show the same tetragonal structure as that of pristine SnO2, their colour is quite darker than SnO2, indicating the doping of Sn2+.11 As shown in the inset of Fig. 1b, Tauc plot approach49 was used to determine Sn2+–SnO2 band gap energy (Eg). The results (summarized in Table 1) indicate that, for the samples prepared below 160 °C, the Eg is only ca. 3.10 eV. Further enhancing the hydrothermal temperature to 200 °C, the samples Eg are close to 3.60 eV. The Eg of the prepared SnO2 is 3.73 eV and it is consistent well with the reported value.41,50–53 This result clearly indicates that the absorption of SnO2 could be extended to the visible light region by doping with Sn2+.11,41 As Sn2+ tends to be oxidized to Sn4+ at an elevated temperature, the increase of Eg with hydrothermal temperature should be caused by the reduction of Sn2+ doping content.
| Reaction condition | Product | Eg (eV) | BET area (m2 g−1) | |
|---|---|---|---|---|
| Temp. (°C) (without urea) | 120 | Sn2+–SnO2 | 3.20 | 100.1 |
| 140 | 3.13 | — | ||
| 160 | 3.10 | 116.4 | ||
| 180 | 3.59 | — | ||
| 200 | 3.60 | 99.9 | ||
| Urea (g) (temp. 160 °C) | 0 | Sn2+–SnO2 | 3.14 | 116.4 |
| 0.5 | SnO/SnO2 | 3.41 | — | |
| 1.0 | 3.34 | 79.2 | ||
| 2.0 | 3.04 | — | ||
| 3.0 | 3.08 | 77.1 | ||
| 3 g urea + 1 mL H2O2, 160 °C | SnO2 | 3.73 | 173.3 | |
| 3 g urea + N2 purged, 160 °C | SnO | 2.71 | 5.2 | |
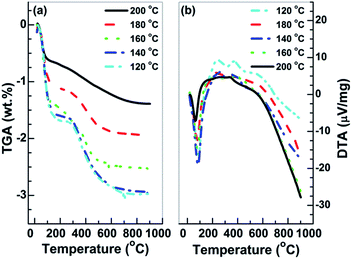
SnO2·H2O shows a similar diffraction pattern to the tetragonal SnO2.50 TGA and DTA analyses of the prepared Sn2+–SnO2 were carried out to further corroborate the identification. As shown in Fig. 2a, an initial mass loss of 1.0% can be observed below 120 °C. It can be attributed to the dehydration of the adsorbed water, which leads to the endothermic peak in Fig. 2b. A second mass loss ca. 1.0% is occurred around 400 °C due to the volatilization of the contaminated Cl−. After that, the TGA curves have no change. The result rules out the possibility that the products are SnO2·H2O as its theoretical weight loss is larger than 10%. It also rules out the presence of SnO component in the samples, which shows a weight increases around 570 °C54 due to the oxidation of Sn2+ to Sn4+. Thus, based on the results shown in Fig. 1 and 2, it can be deduced that the samples prepared at different temperatures in H2O are Sn2+–SnO2.
Fig. 3 shows the SEM images of the prepared Sn2+–SnO2. The samples prepared below 200 °C (Fig. 3a–d) are mainly composed of rods with a length of about 15 μm and a diameter of about 3 μm. With enhancing the preparation temperature, the surface of the rods becomes coarse and some small particles are present, suggesting the decomposition of the rods. When the temperature reaches 200 °C, no any rods can be observed (Fig. 3e). Pristine SnO2 prepared in the H2O2-contained solution (Fig. 3f) shows a similar morphology feature as the sample prepared at 200 °C.
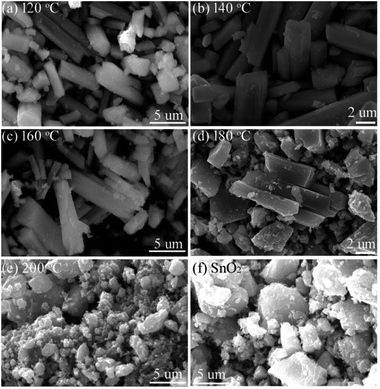 | ||
| Fig. 3 SEM images of the samples prepared at different temperatures (a) 120, (b) 140, (c) 160, (d) 180, (e) 200 °C, and (f) SnO2 prepared at 160 °C in H2O2-contained solution. | ||
3.2 Characterization of SnO/SnO2 and SnO
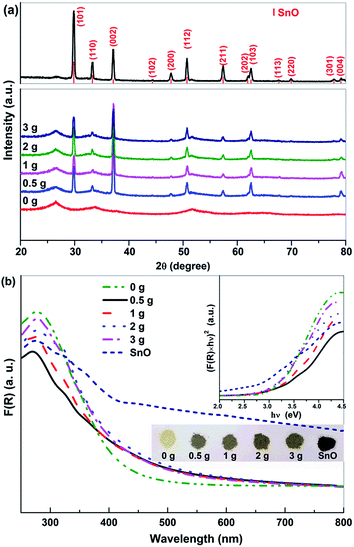
Fig. 4a shows the XRD patterns of the SnO/SnO2 prepared in different urea-contained solutions. When no urea was added, the resulted sample was Sn2+–SnO2 as shown by Fig. 1. For the samples prepared in urea-contained solution, two sets of diffraction peaks originated from tetragonal SnO2 (JCPDS No. 77-447) and SnO (JCPDS No. 78-1913) can be observed, confirming the formation of SnO/SnO2 composite. As shown in the top of Fig. 4a, the diffraction pattern of the sample prepared in N2 purged solution can be assigned to SnO, along with two very small diffraction peaks of SnO2 (110) and (211).Fig. 4b shows the UV-vis DRS of the prepared SnO–SnO2 and SnO. The composite show an apparent visible light absorption and the thresholds extend to ca. 700 nm. With an increase of urea dosage, the absorption coefficient of the resulted SnO–SnO2 is improved and the sample colour changes from slight brown to dark brown as shown in the inset of Fig. 4b. The absorption of SnO/SnO2 is gradually extended to the visible range with an increase of urea dosage. SnO shows the highest visible light absorption coefficient due to its black colour and the Eg is 2.71 eV, agreeing well with the reported result.1 The Eg of SnO/SnO2 samples were estimated by Tauc plots (the inset of Fig. 4b) and the results are summarized in Table 1.
Fig. 5 shows the SEM images of the prepared SnO/SnO2. Resembling the sample prepared in water (without urea, Fig. 5a), rod-like samples (Fig. 5b–e) with a length of about 15 μm and a diameter of about 3 μm were also obtained in the urea-contained solution. However, a decomposition of the rods can be observed with an increase of urea dosage and the surface becomes rough (Fig. 5b–e). Some small particles then appear and distribute on the rods surface. As shown in Fig. 5f, the morphology of the prepared SnO is quite different to SnO/SnO2 composites. The sample is composed of many tightly aggregated strips.
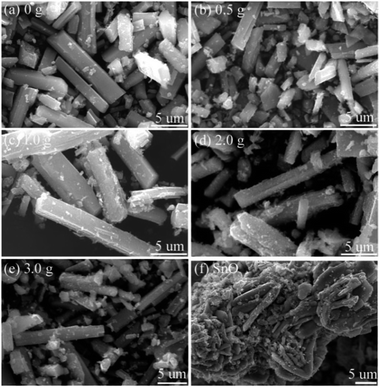 | ||
| Fig. 5 SEM images of the samples prepared in different urea-contained solutions (a) 0, (b) 0.5, (c) 1.0, (d) 2.0, (e) 3.0 g, and (f) the prepared SnO. | ||
The morphology feature of the SnO/SnO2 was further characterized by TEM using the sample prepared in 3 g urea-contained solution as a representative. As shown in Fig. 6a and b, some nanosheets and small rods with a diameter of ca. 10 nm and a length of ca. 300 nm (indicated by the arrows in Fig. 6b) can be observed. The small rods are covered by the nanosheets. The SAED pattern in Fig. 6c indicates the polycrystalline nature of the nanosheets. The diffraction rings from the inner to outward can be indexed to the (110), (101), (200), and (211) planes of SnO2, respectively. Two sets of lattice space with d values of 0.26 and 0.33 nm can be found in the HRTEM images (Fig. 6d and e), which corresponds to the (101) and (110) planes of tetragonal SnO2. The results suggest that the sheet-like particles are SnO2. As for the small rods, the HRTEM image (Fig. 6f) demonstrates that the d value of the lattice space is 0.29 nm, which corresponds to the (101) plane of SnO.43 Thus, the small rods are SnO. Similar structure of SnO has been reported in SnO/SnO2 composite.40
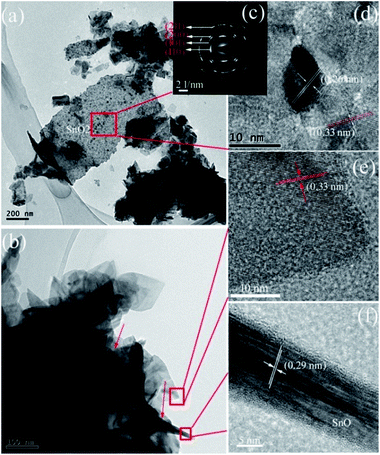 | ||
| Fig. 6 (a and b) TEM, (c) SAED, and (d–f) HRTEM images of the prepared SnO–SnO2 in 3 g urea-contained solution. | ||
Some of the prepared samples including SnO2, Sn2+–SnO2, SnO/SnO2 and SnO were analyzed by XPS to study the chemical states of Sn and O. The survey spectra (Fig. S2-a†) clearly indicate that, besides the adventitious C, the samples are composed of Sn and O. The double peaks located at the binding energy of 486.7 and 495.2 eV with a spin–orbit splitting energy of 8.5 eV can be ascribed to the Sn 3d5/2 and Sn 3d3/2, respectively. As shown in Fig. 7, except for SnO2, the Sn 3d5/2 peak can be deconvoluted into two peaks centered at 486.4 and 486.8 eV, which can be assigned to Sn2+ and Sn4+, respectively.55 The lack of a prominent binding energy shift of Sn 3d for different oxidation states can be attributed to the Madelung effects.56 No Sn2+ signal can be detected in SnO2 (Fig. 7a) suggesting that the oxidation of Sn2+ to Sn4+ can be effectively achieved by adding H2O2 into the solution. However, as shown in Fig. 7b, if no H2O2 was added, although most of Sn2+ was oxidized to Sn4+ by the dissolved O2, about 9.3% Sn2+ (based on the ratio of the Sn2+ and Sn4+ peak areas) was reserved due to the depletion of dissolved O2. This Sn2+ can be incorporated into SnO2 lattice as a self-doping element. When urea was added, the Sn2+ content was substantially improved to ca. 25.1%. The decomposition of urea at 160 °C provides an anaerobic environment to preserve more Sn2+ component, which is survived in a form of SnO as indicated by the XRD results (Fig. 4a). The signal of Sn4+ still can be found on the prepared SnO in Fig. 7d and its percentage is determined to be ca. 24.8%. Considering that XPS is a surface characterization technique and only trace amount of SnO2 was observed in the XRD pattern (Fig. 4a), this SnO2 should be on SnO surface and is formed by the oxidation of Sn2+ in an ambient environment.55,57 The bulk of the sample should still be SnO. Fig. S2-b† shows the high resolution of O 1s spectrum. All the samples exhibit a broad and asymmetric O 1s peak which can be resolved into two peaks, one centered at 530.0 eV and the other at 531.7 eV. The peaks can be assigned to the crystal lattice oxygen in SnO or SnO2 (ref. 47) and the adsorbed O2 or surface –OH group.38
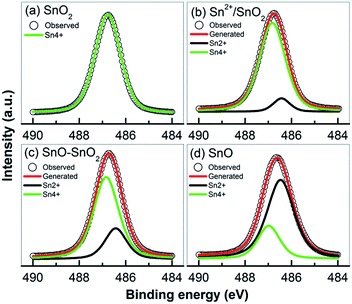 | ||
| Fig. 7 High resolution XPS of Sn 3d5/2 peak taken form (a) SnO2, (b) Sn2+–SnO2 (prepared at 160 °C), (c) SnO/SnO2 (prepared in 3 g urea added solution), and (d) SnO. | ||
The above results indicate that the composition of the product is determined by the atmosphere of the hydrothermal solution, which is achieved by controlling the solution composition. Sn2+ can be oxidized to Sn4+ along with its hydrolysis in H2O. The dissolved O2 serves as the oxidant.11,41 Due to the limitation of O2 content, some Sn2+ can survive as a self-doping monomer in the product, leading to the formation of Sn2+–SnO2. This Sn2+ residue can be eliminated by adding H2O2 into the solution. Then pristine SnO2 can be produced. But when urea was added, the decomposition of urea at 160 °C (ref. 58) could lead to a mixture atmosphere of O2 and CO2. Some part of Sn2+ precursor then was oxidized to SnO2, while the other was converted to SnO under the protection of CO2, resulting in a SnO/SnO2 composite. In this urea-contained solution, if the dissolved O2 was removed by purging with N2 before the hydrothermal treatment, SnO then can be produced. The traces of SnO2 in SnO as shown in Fig. 4 may be caused by the oxidization of SnO, which occurs during the collection or storage of SnO. The selective preparation of these Sn oxides is briefly described in Scheme 1.
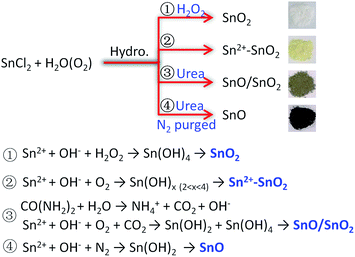 | ||
| Scheme 1 Briefly diagram the conversion of SnCl2 to the desired Sn oxides by controlling the hydrothermal solution composition. | ||
3.3 Photocatalytic activity
The visible light photocatalytic performances of the prepared samples were examined by the degradation of MO. Fig. S3 and S4† show the time-dependent decolorization of MO over the prepared samples. As shown in Fig. S5,† the azo bond (N![[double bond, length as m-dash]](https://www.rsc.org/images/entities/char_e001.gif) N) and the two benzene rings in MO give for the maximum absorption band at 465 nm (B1) and the small one at 270 nm (B2), respectively.59 In the presence of Sn2+–SnO2 and SnO/SnO2, a decrease of B1 with irradiation time can be observed in Fig. S3 and S4,† suggesting the destruction of the conjugated structure of MO. After irradiation for ca. 60 min, a complete decolorization of MO can be realized over these samples except for Sn2+–SnO2 prepared at 200 °C (Fig. S3-e†) and the solutions become colourless (as shown in the inset of Fig. S4-d†). However, the absorption of B2 still can be observed and is even improved with irradiation time. The increase of B2 suggests that these samples have low activity to cleave the highly stable aromatic rings. The accumulation of the fragments formed from the destruction of the chromophore bond accounts for the increase of B2. MO cannot be decolorized by the prepared SnO2 (Fig. S3-f†) as it cannot be activated by visible light. This result eliminates the possibility that the decolorization of MO is caused by a photosensitized oxidative process.60 Blank tests indicate that MO cannot be decomposed without the photocatalyst or the irradiation (Fig. S3-g and h†). Although SnO shows the highest visible light absorption coefficient, only 10% MO was decolorized after irradiation for 50 min. This may be caused by the fact that the ˙OH which accounts for the decolorization of MO cannot be effectively produced on SnO (see below) and the BET surface area is as low as 5.2 m2 g−1 (Table 1).
N) and the two benzene rings in MO give for the maximum absorption band at 465 nm (B1) and the small one at 270 nm (B2), respectively.59 In the presence of Sn2+–SnO2 and SnO/SnO2, a decrease of B1 with irradiation time can be observed in Fig. S3 and S4,† suggesting the destruction of the conjugated structure of MO. After irradiation for ca. 60 min, a complete decolorization of MO can be realized over these samples except for Sn2+–SnO2 prepared at 200 °C (Fig. S3-e†) and the solutions become colourless (as shown in the inset of Fig. S4-d†). However, the absorption of B2 still can be observed and is even improved with irradiation time. The increase of B2 suggests that these samples have low activity to cleave the highly stable aromatic rings. The accumulation of the fragments formed from the destruction of the chromophore bond accounts for the increase of B2. MO cannot be decolorized by the prepared SnO2 (Fig. S3-f†) as it cannot be activated by visible light. This result eliminates the possibility that the decolorization of MO is caused by a photosensitized oxidative process.60 Blank tests indicate that MO cannot be decomposed without the photocatalyst or the irradiation (Fig. S3-g and h†). Although SnO shows the highest visible light absorption coefficient, only 10% MO was decolorized after irradiation for 50 min. This may be caused by the fact that the ˙OH which accounts for the decolorization of MO cannot be effectively produced on SnO (see below) and the BET surface area is as low as 5.2 m2 g−1 (Table 1).
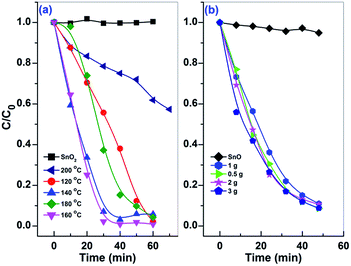
The temporal change of MO concentration was measured by the absorbance of B1 to compare the photocatalytic performance of the prepared samples. As shown in Fig. 8, the activity of Sn2+–SnO2 is slightly improved by enhancing the preparation temperature from 120 to 160 °C, then drops sharply with further increasing the temperature to 200 °C. Only 43% MO was decolorized after irradiation for 70 min on the sample prepared at 200 °C. The sample prepared at 160 °C shows the highest activity and the complete decolorization of MO can be achieved within 30 min. As the BET surface area of Sn2+–SnO2 samples is around 100 m2 g−1 (Table 1), the activity reduction of the samples prepared at high temperature should be caused by the decrease of Sn2+ doping amount. As for the prepared SnO/SnO2, the activity seems less impacted by the urea amount, as well as the BET surface area (ca. 78 m2 g−1, Table 1). Their activities are comparable to each other.
The photocatalytic stability of Sn2+–SnO2 and SnO/SnO2 was investigated by reusing the photocatalysts. Unfortunately, as shown in Fig. 9, a deactivation of the samples can be observed. The activity can sustain for 3 runs on Sn2+–SnO2, while on SnO/SnO2, it can only sustain for 1 run. Considering that the visible light photocatalytic activity is originated from Sn2+ species and the oxidation potential of Sn2+ to Sn4+ is only 0.15 V (vs. SHE),11,41 the deactivation of the samples is caused by the oxidation of Sn2+ to Sn4+ during the reaction.
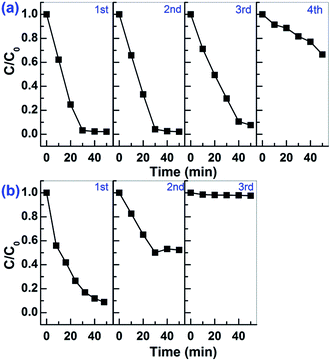 | ||
| Fig. 9 Cycling tests for the photocatalytic decolorization of MO on (a) Sn2+–SnO2 prepared at 160 °C and (b) SnO–SnO2 prepared in 3 g urea added solution. | ||
3.4 Proposed reaction mechanism
The photocurrents of the prepared Sn2+–SnO2, SnO/SnO2, SnO, and SnO2 were measured under visible light irradiation to investigate the generation and the separation of the photo-induced charge carriers. As shown in Fig. 10, only Sn2+–SnO2 and SnO/SnO2 show apparent reversible photocurrent responses with light on and off. The result confirms that a visible light response can be involved by doping SnO2 with Sn2+ or coupling it with SnO. Surprisingly, although SnO/SnO2 shows a comparable photocatalytic activity to Sn2+–SnO2, the photocurrent density of SnO/SnO2 is substantially lower than the latter. A decay of the photocurrent with irradiation time can be observed on both of the samples, further suggesting their instability. Although SnO shows a visible light absorption, the photocurrent is negligible. It seems that the photo-induced charge carriers are consumed by SnO itself, rather than migrating to the surface to form a current. This may be the reason why SnO shows quite low performance for the decolorization of MO (Fig. 8b) and the activity of SnO/SnO2 can only sustain for one run (Fig. 9b). The photocurrent of SnO2 is negligible as it cannot be activated under visible light.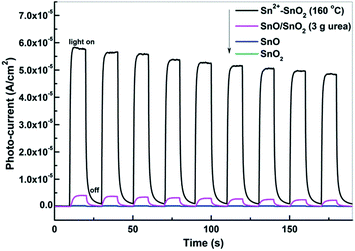 | ||
| Fig. 10 Photocurrent responses of Sn2+–SnO2 prepared at 160 °C, SnO/SnO2 prepared in 3 g urea added solution, SnO, and SnO2 under visible light irradiation (λ > 400 nm). | ||
The photocurrent results suggest that the charge carriers can be generated on Sn2+–SnO2 and SnO/SnO2 under visible light irradiation. These charge carriers can further react with the adsorbed –OH, H2O, and O2 to form the active radicals. ˙OH is one of the key active species for the degradation of pollutants. According to the band structures of SnO/SnO2 and Sn2+–SnO2 (Fig. S6†), ˙OH can be induced by the photogenerated h+ in these samples as the standard reduction potential of ˙OH/–OH is 1.99 V. ˙OH formed on these samples was trapped by TA. As shown in Fig. S7,† the characterized fluorescence peak of TAOH at 425 nm can be observed on the prepared Sn2+–SnO2 (Fig. S7a–e†) and SnO/SnO2 (Fig. S7g–k†) and the signal increases gradually with irradiation time. It suggests that the prepared Sn2+ incorporated SnO2 samples have the capability to form ˙OH under the visible light irradiation. For SnO, the formation of TAOH is far slower than the Sn2+ incorporated SnO2 samples and ceased after irradiation for ca. 25 min. Other control tests indicated that the formation of ˙OH on SnO2 is negligible and cannot be perceived for the tests without a photocatalyst or illumination (Fig. S7m–o†). The formation efficiency of ˙OH on the prepared Sn2+–SnO2 and SnO/SnO2 samples is generally in agreement with their photocatalytic performances shown in Fig. 8. This relevance suggests that at least ˙OH accounts for the degradation of MO. The visible-light-induced e− and h+ are aroused by the doping of Sn2+ (ref. 41) or the coupling of SnO component38,40,61 (the electronic contributions from 5s orbitals of Sn2+). These charge carriers can be trapped by O2, H2O, or adsorbed –OH to generate ˙OH or other oxidative species, which eventually lead to the decomposition of MO. Besides, Sn2+ also can be oxidized to Sn4+ by these oxidative species, leading to the deactivation of Sn2+–SnO2 and SnO/SnO2 (Fig. 9).
4. Conclusions
We have developed a simple and effective hydrothermal method to selective preparation of SnO2, Sn2+–SnO2, SnO/SnO2, and SnO with SnCl2 as precursor. Through adding H2O2 or urea, the solution can be tuned from an O2-rich to O2 deficient atmosphere, which facilitates the transformation of Sn2+ to SnO2 and the preservation of Sn2+ (in a form of doping Sn2+ or SnO component), respectively. The absorption of SnO2 can be successfully extended to the visible light region after self-doping with Sn2+ or coupling with SnO, which endows a visible light photocatalytic activity for MO degradation. Unfortunately, due to the oxidation of Sn2+ to Sn4+, the activities of the samples are quite unstable. Further work is still required to improve their photo-stability. Nonetheless, we believe that this work provides a simple method to selective preparation of different Sn-based oxides, which is essential for their applications, such as the detection of NO and NO2 based on SnO or SnO2.61 The work also provides a useful concept that is, through controlling the atmosphere of the solution, the oxidation state of metal oxides can be readily tuned by a hydrothermal method.Acknowledgements
This work was financially supported by National Natural Science Foundation of China (Grant No. 21473066, 21603002, and 51472005), Natural Science Foundation of Anhui Province (Grant No. 1608085QB37).Notes and references
- W. Xia, H. Wang, X. Zeng, J. Han, J. Zhu, M. Zhou and S. Wu, CrystEngComm, 2014, 16, 6841–6847 RSC.
- E. Comini, Anal. Chim. Acta, 2006, 568, 28–40 CrossRef CAS PubMed.
- H. B. Wu, J. S. Chen, H. H. Hng and X. W. Lou, Nanoscale, 2012, 4, 2526–2542 RSC.
- K. Ellmer, Nat. Photonics, 2012, 6, 809–817 CrossRef CAS.
- J. S. Chen and X. W. Lou, Small, 2013, 9, 1877–1893 CrossRef CAS PubMed.
- M. Batzill and U. Diebold, Prog. Surf. Sci., 2005, 79, 47–154 CrossRef CAS.
- Y. Idota, T. Kubota, A. Matsufuji, Y. Maekawa and T. Miyasaka, Science, 1997, 276, 1395–1397 CrossRef CAS.
- H. Wang and A. L. Rogach, Chem. Mater., 2014, 26, 123–133 CrossRef CAS.
- Z. Han, N. Guo, F. Li, W. Zhang, H. Zhao and Y. Qian, Mater. Lett., 2001, 48, 99–103 CrossRef CAS.
- S. Mathur, R. Ganesan, I. Grobelsek, H. Shen, T. Ruegamer and S. Barth, Adv. Eng. Mater., 2007, 9, 658–663 CrossRef CAS.
- H. Wang, K. Dou, W. Y. Teoh, Y. Zhan, T. F. Hung, F. Zhang, J. Xu, R. Zhang and A. L. Rogach, Adv. Funct. Mater., 2013, 4847–4853, DOI:10.1002/adfm.201300303.
- Z. Li, Y. Zhou, T. Yu, J. Liu and Z. Zou, CrystEngComm, 2012, 14, 6462–6468 RSC.
- A. Kar, S. Sain, S. Kundu, A. Bhattacharyya, S. Kumar Pradhan and A. Patra, ChemPhysChem, 2015, 16, 1017–1025 CrossRef CAS PubMed.
- A. K. Sinha, M. Pradhan, S. Sarkar and T. Pal, Environ. Sci. Technol., 2013, 47, 2339–2345 CrossRef CAS PubMed.
- Z. D. Li, Y. Zhou, J. C. Song, T. Yu, J. G. Liu and Z. G. Zou, J. Mater. Chem. A, 2013, 1, 524–531 CAS.
- D. Chu, J. Mo, Q. Peng, Y. Zhang, Y. Wei, Z. Zhuang and Y. Li, Chemcatchem, 2011, 3, 371–377 CrossRef CAS.
- M. Wang, Y. Gao, L. Dai, C. Cao and X. Guo, J. Solid State Chem., 2012, 189, 49–56 CrossRef CAS.
- S. Wu, H. Cao, S. Yin, X. Liu and X. Zhang, J. Phys. Chem. C, 2009, 113, 17893–17898 CAS.
- H. Chen, C. E. Nanayakkara and V. H. Grassian, Chem. Rev., 2012, 112, 5919–5948 CrossRef CAS PubMed.
- M. R. Hoffmann, S. T. Martin, W. Y. Choi and D. W. Bahnemann, Chem. Rev., 1995, 95, 69–96 CrossRef CAS.
- Y. C. Zhang, L. Yao, G. S. Zhang, D. D. Dionysiou, J. Li and X. H. Du, Appl. Catal., B, 2014, 144, 730–738 CrossRef CAS.
- Y. C. Zhang, Z. N. Du, K. W. Li, M. Zhang and D. D. Dionysiou, ACS Appl. Mater. Interfaces, 2011, 3, 1528–1537 CAS.
- Y. Zhao, Y. Zhang, J. Li and Y. Chen, Sep. Purif. Technol., 2014, 129, 90–95 CrossRef CAS.
- K. Vinodgopal and P. V. Kamat, Environ. Sci. Technol., 1995, 29, 841–845 CrossRef CAS PubMed.
- N. Chadwick, S. Sathasivam, A. Kafizas, S. M. Bawaked, A. Y. Obaid, S. Al-Thabaiti, S. N. Basahel, I. P. Parkin and C. J. Carmalt, J. Mater. Chem. A, 2014, 2, 5108–5116 CAS.
- L. Zheng, Y. Zheng, C. Chen, Y. Zhan, X. Lin, Q. Zheng, K. Wei and J. Zhu, Inorg. Chem., 2009, 48, 1819–1825 CrossRef CAS PubMed.
- W. Cun, X. M. Wang, B. Q. Xu, J. C. Zhao, B. X. Mai, P. Peng, G. Y. Sheng and H. M. Fu, J. Photochem. Photobiol., A, 2004, 168, 47–52 CrossRef.
- J. Wang, H. Li, S. Meng, L. Zhang, X. Fu and S. Chen, Appl. Catal., B, 2017, 200, 19–30 CrossRef CAS.
- H. Ullah, A. Khatoon and Z. Akhtar, Mater. Res. Express, 2014, 1, 045001 CrossRef.
- D. Qi, L. Lu, Z. Xi, L. Wang and J. Zhang, Appl. Catal., B, 2014, 160–161, 621–628 CrossRef CAS.
- I. S. Chae, M. Koyano, K. Oyaizu and H. Nishide, J. Mater. Chem. A, 2013, 1, 1326–1333 CAS.
- A. Wahl and J. Augustynski, J. Phys. Chem. B, 1998, 102, 7820–7828 CrossRef CAS.
- J. Jiang, L. Z. Zhang, H. Li, W. W. He and J. J. Yin, Nanoscale, 2013, 5, 10573–10581 RSC.
- Y. Hosogi, Y. Shimodaira, H. Kato, H. Kobayashi and A. Kudo, Chem. Mater., 2008, 20, 1299–1307 CrossRef CAS.
- A. Naldoni, M. Allieta, S. Santangelo, M. Marelli, F. Fabbri, S. Cappelli, C. L. Bianchi, R. Psaro and V. Dal Santo, J. Am. Chem. Soc., 2012, 134, 7600–7603 CrossRef CAS PubMed.
- T. Xia and X. B. Chen, J. Mater. Chem. A, 2013, 1, 2983–2989 CAS.
- A. Iwaszuk and M. Nolan, J. Mater. Chem. A, 2013, 1, 6670–6677 CAS.
- A. K. Sinha, P. K. Manna, M. Pradhan, C. Mondal, S. M. Yusuf and T. Pal, RSC Adv., 2014, 4, 208–211 RSC.
- K. Santhi, C. Rani and S. Karuppuchamy, J. Alloys Compd., 2016, 662, 102–107 CrossRef CAS.
- A. Roy, S. Arbuj, Y. Waghadkar, M. Shinde, G. Umarji, S. Rane, K. Patil, S. Gosavi and R. Chauhan, J. Solid State Electrochem., 2016, 1–9, DOI:10.1007/s10008-016-3328-y.
- C. M. Fan, Y. Peng, Q. Zhu, L. Lin, R. X. Wang and A. W. Xu, J. Phys. Chem. C, 2013, 117, 24157–24166 CAS.
- Y. He, D. Li, J. Chen, Y. Shao, J. Xian, X. Zheng and P. Wang, RSC Adv., 2014, 4, 1266–1269 RSC.
- Q. Yan, J. Wang, X. Han and Z. Liu, J. Mater. Res., 2013, 28, 1862–1869 CrossRef CAS.
- G. Chen, S. Ji, Y. Sang, S. Chang, Y. Wang, P. Hao, J. Claverie, H. Liu and G. Yu, Nanoscale, 2015, 7, 3117–3125 RSC.
- H. Uchiyama, H. Ohgi and H. Imai, Cryst. Growth Des., 2006, 6, 2186–2190 CAS.
- J. R. Sambrano, L. A. Vasconcellos, J. B. L. Martins, M. R. C. Santos, E. Longo and A. Beltran, J. Mol. Struct.: THEOCHEM, 2003, 629, 307–314 CrossRef CAS.
- J. Mazloom, F. E. Ghodsi and H. Golmojdeh, J. Alloys Compd., 2015, 639, 393–399 CrossRef CAS.
- X. Fu, D. Y. C. Leung and S. Chen, CrystEngComm, 2014, 16, 616–626 RSC.
- J. Tauc, R. Grigorovici and A. Vancu, Phys. Status Solidi, 1966, 15, 627–637 CrossRef CAS.
- T. Arai and S. Adachi, ECS J. Solid State Sci. Technol., 2012, 1, R15–R21 CrossRef CAS.
- Z. Khodami and A. Nezamzadeh-Ejhieh, J. Mol. Catal. A: Chem., 2015, 409, 59–68 CrossRef CAS.
- H. Chen, L. Ding, W. Sun, Q. Jiang, J. Hu and J. Li, RSC Adv., 2015, 5, 56401–56409 RSC.
- L. Zhang, H. Zhang, H. Huang, Y. Liu and Z. Kang, New J. Chem., 2012, 36, 1541–1544 RSC.
- G. Sun, N. Wu, Y. Li, J. Cao, F. Qi, H. Bala and Z. Zhang, Mater. Lett., 2013, 98, 234–237 CrossRef CAS.
- G. Zhou, X. Wu, L. Liu, X. Zhu, X. Zhu, Y. Hao and P. K. Chu, Appl. Surf. Sci., 2015, 349, 798–804 CrossRef CAS.
- V. B. R. Boppana and R. F. Lobo, J. Catal., 2011, 281, 156–168 CrossRef CAS.
- H.-R. Kim, K.-I. Choi, J.-H. Lee and S. A. Akbar, Sens. Actuators, B, 2009, 136, 138–143 CrossRef CAS.
- W. K. Choi, H. Sung, K. H. Kim, J. S. Cho, S. C. Choi, H. J. Jung, S. K. Koh, C. M. Lee and K. Jeong, J. Mater. Sci. Lett., 1997, 16, 1551–1554 CrossRef CAS.
- T. Tasaki, T. Wada, K. Fujimoto, S. Kai, K. Ohe, T. Oshima, Y. Baba and M. Kukizaki, J. Hazard. Mater., 2009, 162, 1103–1110 CrossRef CAS PubMed.
- T. X. Wu, G. M. Liu, J. C. Zhao, H. Hidaka and N. Serpone, J. Phys. Chem. B, 1998, 102, 5845–5851 CrossRef CAS.
- L. Li, C. Zhang and W. Chen, Nanoscale, 2015, 7, 12133–12142 RSC.
Footnote |
| † Electronic supplementary information (ESI) available: Degradation reaction system for MO, XPS spectrum of the prepared samples, time dependent UV-vis absorption spectrum of MO solution, chemical structure of MO, schematic band structures of the prepared samples, time dependent fluorescence spectra of the formed TAOH. See DOI: 10.1039/c7ra04041e |
| This journal is © The Royal Society of Chemistry 2017 |

