 Open Access Article
Oxygen-vacancy-promoted catalytic wet air oxidation of phenol from MnOx–CeO2†
Changjian Maa,
Yaoyao Wena,
Qingqing Yuea,
Anqi Lia,
Jile Fua,
Nouwei Zhang*a,
Hengjun Gaib,
Jinbao Zhenga and
Bing H. Chen *a
*a
aDepartment of Chemical and Biochemical Engineering, National Engineering Laboratory for Green Chemical Productions of Alcohols-Ethers-Esters, College of Chemistry and Chemical Engineering, Xiamen University, Xiamen 361005, PR China. E-mail: zhnw@xmu.edu.cn; chenbh@xmu.edu.cn
bQingdao University of Science and Technology, Qingdao 266042, Shandong, China
First published on 22nd May 2017
Abstract
Catalytic oxidation can be effectively promoted by the presence of oxygen vacancies on the catalyst surface. In this study, the effect of oxygen vacancies on the catalytic wet air oxidation (CWAO) of phenol was investigated with CeO2 and MnOx–CeO2 as catalysts. CeO2 and MnOx–CeO2 catalysts with different amounts of oxygen vacancies were obtained via hydrothermal methods and applied for the CWAO of phenol. It was found that CeO2 and MnOx–CeO2 nanorods were much more active than the cubic nanorods. The physicochemical properties of the samples were characterized by TEM, XRD, BET, XPS, and H2-TPR techniques. The results revealed that the presence of oxygen vacancies in CeO2 and MnOx–CeO2 catalysts could increase the oxidizing ability of the catalysts surface. The addition of Mn could greatly improve the adsorption ability of CeO2 and more efficiently oxidize phenol and its intermediates. The synergy between Mn and Ce could further improve the catalyst redox properties and produce a larger amount of active oxygen species, which is the reason why MnOx–CeO2 nanorods are the most active catalysts among the catalysts investigated in this study.
1 Introduction
Phenol and its derivatives can be found as by-products from a variety of sources such as chemical, petrochemical, pharmaceutical and coal chemical industries.1,2 Since phenol is highly toxic to aquatic life, it would result in a severe impact on water resources if phenol-contaminated streams are discharged without treatment.3 Biotreatment is often applied in water treatment; however, phenol can inhibit the activity of microbes, causing biotreatment to be impractical for phenolic wastewater.4 Catalytic wet air oxidation (CWAO) has been shown to be an effective and environmentally friendly way to remove refractory organic compounds, such as dyes, phenol, and succinic acid as normally no additions other than oxygen/air are needed for the process.5–7 Under an oxygen or air atmosphere at relatively elevated temperatures and pressures, refractory organic compounds can be completely oxidized into CO2 and H2O or partially converted to other less toxic compounds by proper catalysts.8,9 Clearly, developing a suitable catalyst essential for CWAO processes.Among the various catalysts investigated for the CWAO of phenol in the reported literature, the cerium-incorporated manganese oxide composite (MnOx–CeO2) catalyst has been identified as one of the most promising catalysts.10 It was reported that MnOx–CeO2 is an effective catalyst for the CWAO of ammonia, poly(ethylene)glycol, acetic acid, pyridine, etc.11,12 Arena reported a new “redox-precipitation” route to synthesis the MnOx–CeO2 catalyst resulting in improved catalytic activity.13 It was also reported that formic and acetic acids are the common intermediates during the CWAO of phenol, and that the adsorption of formic and acetic acids was driven by electrostatic interactions with the MnOx–CeO2 surface.14,15 The surface reaction between the adsorbed intermediates and the activated oxygen species is the rate-determining step.16 Furthermore, it was reported that the interaction between Mn and Ce is beneficial for the CWAO of ammonia,11 where a physical mixture of Mn2O3 and CeO2 was far less active than that of Mn/Ce catalysts. The above information shows the merits of MnOx–CeO2 catalysts in the field of CWAO; however, less attention has been paid to the physicochemical properties of MnOx–CeO2 catalysts, such as the effect of oxygen vacancies on the CWAO of phenol.
Our previous study showed that O2 activation ability can directly affect the performance of CO oxidation.17 The activation of oxygen can form superoxo (O2−) and/or peroxo (O22−) species, which are more oxidative than molecular oxygen (O2). Active oxygen species can be formed on the surface of ceria in propane oxidation passing via a Mars and van Krevelen mechanism.18 Molecular oxygen prefers to fill the ceria oxygen vacancies to produce activated oxygen species.19 High oxygen vacancy concentrations can also assist the cycle transition between Ce3+ and Ce4+ ions (Ce3+ ↔ Ce4+), which is the key for many catalytic activities.
There are several ways to create oxygen vacancies. In the literature, both ceria (110) and (100) surfaces have been reported as having superior oxygen storage ability than the (111) surface.20 However, the ceria (100) surface contains less oxygen vacancies than the (110) surface.21 This property of the ceria (110) surface causes the improved catalytic activity for CO oxidation and soot combustion.22,23 Doping various metals into ceria is another way to create oxygen vacancies. As Mn and Ce have a tendency to form solid solutions,24,25 doping Mn into the ceria lattice can greatly increase oxygen mobility and also help to produce oxygen vacancies on a catalyst's surface.26 When the atomic ratio of Mn![[thin space (1/6-em)]](https://www.rsc.org/images/entities/char_2009.gif) :
:![[thin space (1/6-em)]](https://www.rsc.org/images/entities/char_2009.gif) Ce is less than 1, all the MnOx–CeO2 catalysts possess the fluorite cubic structures of CeO2.27 Thus, doping 50% Mn atoms into CeO2 is expected to produce the maximum amount of oxygen vacancies.
Ce is less than 1, all the MnOx–CeO2 catalysts possess the fluorite cubic structures of CeO2.27 Thus, doping 50% Mn atoms into CeO2 is expected to produce the maximum amount of oxygen vacancies.
In order to study the effect of oxygen vacancies on the CWAO of phenol, we synthesized CeO2 nanorods and nanocubes using hydrothermal methods. To further confirm the effect of oxygen vacancies on the CWAO of phenol, 50% Mn in a molar ratio was doped into CeO2 nanorods and nanocubes to form MnOx–CeO2 nanorods and nanocubes. Characterizations, including XRD, H2 temperature-programmed reduction (H2-TPR), XPS, and TEM, were performed to link the physicochemical properties and catalytic performance. The results revealed that the oxygen-vacancy-related properties as well as the synergy between Mn and Ce are the key for the high activities in the CWAO of phenol.
2 Experimental
2.1 Preparation of the catalyst
2.1.2.1 Synthesis of CeO2 nanorods and nanocubes. CeO2 nanorods and nanocubes were prepared through a method similar to that reported in the literature.28 To obtain CeO2 nanorods, 1.736 g of Ce(NO3)3·6H2O was dissolved in 10 mL of deionized water and stirred for 10 min. In a separate container, 19.2 g of NaOH was dissolved in 70 mL of deionized water, and stirred until the solution turned into a transparent color. The above two solutions were mixed and stirred for 30 min. Then, the mixed solution was transferred into a 100 mL Teflon-lined stainless autoclave and heated up to 100 °C for 24 h. After the solution was cooled to room temperature, the precipitates were separated by filtration and washed with deionized water several times. The obtained precipitates were dried at 60 °C overnight, and then calcined at 400 °C for 4 h. The procedure for the synthesis of CeO2 nanocubes was exactly the same as for CeO2 nanorods, except the hydrothermal condition was at 180 °C for 24 h.
2.1.2.2 Synthesis of MnOx–CeO2 nanorods and nanocubes. MnOx–CeO2 nanorods and nanocubes were synthesized through a modified method reported in the literature.24,25 To obtain MnOx–CeO2 nanorods, 0.3957 g (50 mol% of Mn with respect to Ce) of MnCl2·4H2O and 0.868 g of Ce(NO3)3·6H2O were dissolved into 5 mL and 10 mL of deionized water, respectively. Then the two solutions were mixed and stirred for 10 min. In another container, 14 g of NaOH was dissolved into 35 mL of deionized water. Then, the NaOH solution was mixed with the metal precursor solution. After stirring for 30 min, the slurry was transferred into a 100 mL Teflon-lined stainless autoclave and heated up to 120 °C for 24 h. Upon leaving the solution to cool down to room temperature, the precipitates were separated by filtration and washed by deionized water several times. The precipitates were then dried at 60 °C overnight and calcined at 400 °C for 4 h. MnOx–CeO2 nanocubes were synthesized using the same procedures as for the MnOx–CeO2 nanorods, except the hydrothermal condition was at 180 °C for 24 h.
2.1.2.3 Synthesis of MnO2 catalysts. MnO2 catalysts were prepared by a modified method according to the literature reported by Zhu et al.29 In a typical experiment, 1.00 g of KMnO4 and 0.50 g of 50 wt% Mn(NO3)2 solution were added into 64 mL of deionized water. After stirring for 10 min, the mixed solution was transferred into a 100 mL Teflon-lined stainless autoclave and kept at 160 °C for 12 h. After the solution was cooled to room temperature, the precipitates were washed and dried at 100 °C for 12 h.
2.1.2.4 Synthesis of Mn3O4 catalysts. Mn3O4 catalysts were synthesized by adding 3.22 g of 50 wt% Mn(NO3)2 solution and 1.78 g of MnCl2·4H2O into 10 mL of deionized water. In another container, 100 mL of 3 M NaOH solution was prepared, and then mixed with the metal precursor solution. After stirring for 1 h, the precipitates were washed using deionized water and dried at 100 °C for 12 h.
2.2 Catalyst characterization
X-ray diffraction (XRD) patterns for the cerium-based catalysts were collected on a Rigaku X-ray diffractometer and Cu Kα radiation (35 kV and 20 mA) was used as the X-ray source. The samples were scanned in the range of 10° to 80° at a scanning rate of 10° min−1. X-ray photoelectron spectra (XPS) were obtained from the PHI Quantum 2000 Scanning ESCA Microprobe and the monochromatic Al Kα radiation (1846.6 eV) was used as the X-ray source. The binding energies of all the spectra were calibrated with the reference to the C 1s peak at 284.6 eV. N2 adsorption–desorption isotherms were performed at 77 K using a Micromeritics ASAP 2020 instrument. All the samples (300 mg) were degassed at 200 °C for 2 h in vacuum before the measurements started. The specific surface areas were calculated by the Brunauer–Emmett–Teller (BET) method. Hydrogen temperature-programmed reduction (H2-TPR) was recorded using a thermal conductivity detector (TCD). Typically, 80 mg of sample was pretreated in pure argon (Ar) at 200 °C for 2 h with a flow rate of 40 mL min−1. After the temperature was cooled down to 50 °C, the gas was switched to 5% H2/Ar with a flow rate of 40 mL min−1. The temperature was then raised to 850 °C at a ramp of 10 °C min−1. Transmission electron microscopy (TEM) was performed on the Tecnai F30 with an acceleration voltage of 300 kV. The specimen was prepared by dispersing the sample in ethanol solution and sonicating for 20 min. The dispersed sample was dripped on a carbon-coated copper grid and dried at room temperature. The catalyst composition was determined by inductively coupled plasma mass spectrometry (ICP-MS).2.3 Catalytic activity measurements
The CWAO process was operated in a 100 mL temperature-programmed autoclave reactor with a magnetic-driven stirring mixer. A typical experiment was carried out as follows: 70 mL of phenol solution (1000 ppm) and 0.28 g of catalyst (4 g L−1) were added into the reactor, and the reactor was purged using N2 to remove the gaseous oxygen. The reactor was allowed to heat to the required temperature (100–180 °C) and the first sample was taken to evaluate the amount of phenol adsorbed. The desired amount of air (0.5–3.5 MPa) was then charged into the reactor, meanwhile, the time counting started. Samples were withdrawn periodically to monitor the progress of the reaction. The stirring speed was kept at 800 rotation per minute (rpm) at all times. The collected samples were filtered and the phenol concentrations were analyzed by Agilent 1100 high performance liquid chromatography (HPLC) instrument using a Dionex C18 column. The wavelength of the UV detector was set to 254 nm. Acetonitrile and 0.2 wt% acetic acid solution were used as the mobile phases with a total flow rate of 1 mL min−1. The reaction evolutions of phenol's intermediates were also analyzed by HPLC according to the methods reported by Yang.9 Total organic carbon (TOC) was measured by a Shimadzu TOC-L analyzer.3 Results and discussion
3.1 Structural characterization
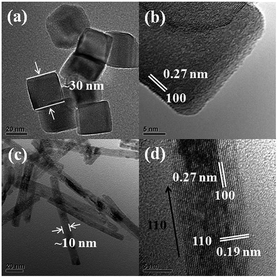
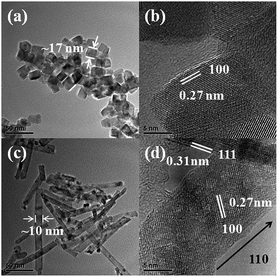
The TEM images of CeO2 nanomaterials are displayed in Fig. 1. The crystal size for CeO2 nanocubes and nanorods are 30 and 10 nm in diameter, respectively. The exposed surfaces for CeO2 nanorods are the (110) and (100) surfaces, rather than the (100) surface for CeO2 nanocubes. A clearer CeO2 nanorods (110) surface image is also provided in Fig. S1.† It is obvious that CeO2 nanorods have more “dark spots” and the surface seems “rougher” than that of the CeO2 nanocubes. A similar phenomenon was also reported by Li, and it can be explained that the rougher surface of CeO2 nanorods is due to the formed oxygen vacancy clusters.19 Thus, it could be expected that CeO2 nanorods contain more oxygen vacancies than CeO2 nanocubes. The TEM results also indicate that the ceria (110) surface has a tendency to form more oxygen vacancies than the (100) surface, which is consistent with previous studies.20,21The TEM images of MnOx–CeO2 nanocubes and nanorods are shown in Fig. 2. The average diameter of the MnOx–CeO2 nanocubes is about 17 nm, and the exposed surface is confirmed to be the (100) surface, where the inter-planar space is 0.27 nm. Fig. 2(c) and (d) are the typical images of MnOx–CeO2 nanorods, which have an average diameter of 10 nm. The predominant facets for the MnOx–CeO2 nanorods are the (111) and (100) surfaces. The surface of MnOx–CeO2 nanorods was also found to be “rougher” than the surface of MnOx–CeO2 nanocubes, which implies that MnOx–CeO2 nanorods have more surface reconstructions and oxygen vacancies. The existence of oxygen vacancy clusters can promote the transition from Ce4+ to Ce3+, which generates more active oxygen species.30 This property of CeO2 and MnOx–CeO2 nanorods is expected to play an important role in the CWAO of phenol.
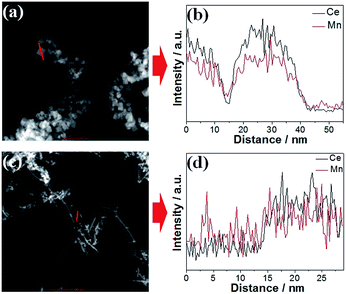
In order to confirm the chemical compositions of the MnOx–CeO2 catalysts, line-scan analysis was conducted (Fig. 3). For both MnOx–CeO2 nanocubes and nanorods, Mn and Ce follow the same pattern, which suggests that they may have formed solid solutions. ICP-MS analysis was performed to further verify the elemental compositions of the MnOx–CeO2 nanocubes and nanorods. The results show that both MnOx–CeO2 nanocubes and nanorods contain 48 mol% of Mn. Therefore, it was proven that MnOx–CeO2 nanocubes and nanorods have similar chemical compositions.
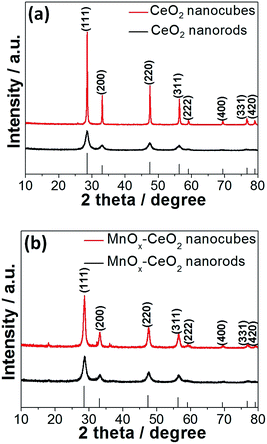
The XRD patterns of CeO2 and the MnOx–CeO2 nanomaterials are presented in Fig. 4. All the catalysts have the fluorite cubic structures of CeO2 (PDF # 34-0394), in spite of there being some minor peaks of Mn3O4 (PDF # 18-0803) found for the MnOx–CeO2 nanocubes. This indicates that less Mn has doped into the ceria lattice for MnOx–CeO2 nanocubes. To clarify this phenomenon, magnified (111) diffraction peaks of MnOx–CeO2 nanomaterials with reference to CeO2 nanorods are illustrated in Fig. 5.
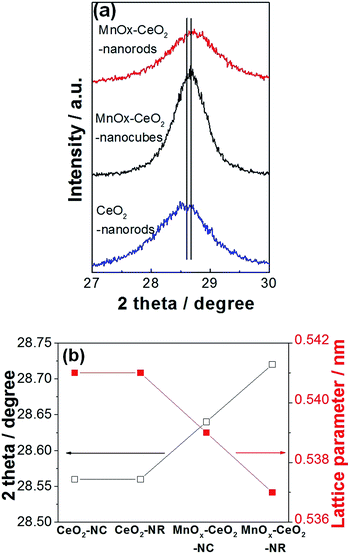 | ||
| Fig. 5 Magnified (111) diffraction peaks (a) and the effect of Mn doping on cerium lattice parameters (b). | ||
It was found that the diffraction peak for MnOx–CeO2 nanorods had shifted to a higher Bragg angle compared with MnOx–CeO2 nanocubes. The Bragg diffraction of each (111) peak was recorded, and each corresponding lattice parameter ɑ was calculated (Fig. 5(b)). Indeed, the lattice parameter of the MnOx–CeO2 nanorods shrunk from 0.541 nm to 0.537 nm, whereas MnOx–CeO2 nanocubes only decreased to 0.539 nm. This further justifies that MnOx–CeO2 nanorods have formed a more homogeneous solid solution. Furthermore, the ionic radii of Mn ions were reported as follows: Mn4+: 0.053 nm, Mn3+: 0.065 nm, Mn2+: 0.083 nm.26 The ionic radii of cerium ions were: Ce4+: 0.097 nm, Ce3+: 0.114 nm. Thus, if more Mn is doped into Ce for the MnOx–CeO2 nanorods, the average ionic radius is expected to be smaller than that of MnOx–CeO2 nanocubes, which might cause a decrease in the lattice parameters.
Moreover, Fig. 4 also illustrates that CeO2 and MnOx–CeO2 nanocubes have greater intensity than the corresponding nanorods. This reveals that CeO2 and MnOx–CeO2 nanorods have a higher degree of lattice defects than the corresponding cubic morphology.8,28 This is consistent with the TEM results discussed earlier. The diffraction peaks of CeO2 and MnOx–CeO2 nanorods are also relatively broader compared to the CeO2 and MnOx–CeO2 nanocubes, suggesting that CeO2 and MnOx–CeO2 nanorods have a smaller crystal size and would result in a higher specific surface area. This was further confirmed by the BET measurements, which show that the BET areas of CeO2 and MnOx–CeO2 nanorods were 91.5 and 76.7 m2 g−1, respectively. The BET areas of CeO2 and MnOx–CeO2 nanocubes were 15.4 and 39.2 m2 g−1, respectively. From the data shown above, it is apparent that the specific surface area was affected by the catalyst particle size. Generally, the smaller the particle size is, the larger BET surface area the catalyst possesses. As shown in Fig. 1 and 2, the particle size is increased in the following order: CeO2 nanorods (10 nm) ≈ MnOx–CeO2 nanorods (10 nm) < MnOx–CeO2 nanocubes (17 nm) < CeO2 nanocubes (30 nm). Therefore, the specific surface area is negatively related to the particle size: CeO2 nanorods (91.5 m2 g−1) > MnOx–CeO2 nanorods (76.7 m2 g−1) > MnOx–CeO2 nanocubes (39.2 m2 g−1) > CeO2 nanocubes (15.4 m2 g−1). Furthermore, as shown in Fig. 4, CeO2 nanorods exhibited weaker XRD patterns than MnOx–CeO2 nanorods. This indicated that CeO2 nanorods possessed poorer crystallinity and a smaller crystal size, although similar diameters were observed by TEM over the two catalysts. The poorer crystallinity and smaller crystal size enabled CeO2 nanorods to have a larger BET surface area than MnOx–CeO2 nanorods.
3.2 Valence state and redox properties
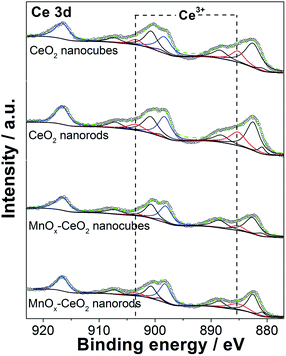
The XPS spectrum of Ce 3d is displayed in Fig. 6. Typically, 10 peaks were deconvoluted into pairs of spin orbit doublets. Two peaks at 916.6 and 898.2 eV are attributed to the 3d3/2, which correspond to the Ce4+ states. Two peaks at 903.4 and 885.2 eV are assigned to the 3d5/2, which are the Ce3+ states. The other six peaks at 900.7, 882.5, 907.3, 888.5, 899.2, and 880.9 eV are the satellite peaks due to the “shake down” type processes.31 These results agree with what we found in the literature.32 The relative portion of Ce3+ and Ce4+ valence states are summarized in Table 1. It was found that CeO2 nanorods have 6% more Ce3+ ions than CeO2 nanocubes, whereas MnOx–CeO2 nanorods contain 11% more Ce3+ ions than MnOx–CeO2 nanocubes. The oxygen vacancy concentration is positively related to the concentration of Ce3+ ions, because oxygen vacancies can reduce the thermodynamic barrier for the transition from Ce4+ to Ce3+.30 Thus, the XPS results are consistent with the XRD and TEM results, which helps to explain why CeO2 and MnOx–CeO2 nanorods have rougher surfaces.| Catalyst label | Ce3+ (%) | Mn4+ (%) | Mn3+ (%) | Mn2+ (%) | Oactive (%) |
|---|---|---|---|---|---|
| CeO2 nanocubes | 32 | — | — | — | 16 |
| CeO2 nanorods | 38 | — | — | — | 20 |
| MnCeOx nanocubes | 19 | 14 | 36 | 50 | 18 |
| MnCeOx nanorods | 30 | 23 | 62 | 15 | 26 |
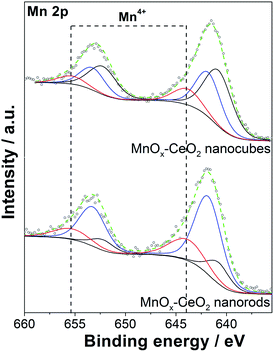
The Mn 2p spectra of the MnOx–CeO2 catalysts are shown in Fig. 7. The three peaks of Mn 2p3/2 are located at 640.8, 641.8, and 643.9 eV, corresponding to Mn2+, Mn3+, and Mn4+, respectively.33–35 The Mn 2p1/2 peak is centered at 653.3 eV, with a splitting energy of 11.45, based on the Mn 2p3/2. By estimating the area of each Mn species, Table 1 shows that MnOx–CeO2 nanorods contain a larger portion of higher valence Mn species, whereas the corresponding Mn4+, Mn3+, and Mn2+ ion abundances are 23%, 62%, and 15%, respectively. Conversely, MnOx–CeO2 nanocubes prefer lower valence Mn species, and the corresponding portions of Mn4+, Mn3+, and Mn2+ are 14%, 36%, and 50%, respectively.
It was also found that the Ce3+ concentration was suppressed when Mn was added. This effect was also reported by Larachi, where the addition of Mn caused an increase in surface Ce4+ concentration.36 This phenomenon can be explained by the fact that electrons are transferred from Ce to Mn, which can decrease the concentration of Ce3+ and increase the concentration of Mn2+ or Mn3+. Compared to MnOx–CeO2 nanorods, the Ce3+ concentration of MnOx–CeO2 nanocubes was suppressed to a higher extent, and a much greater fraction of Mn2+ was observed. This also suggests that more electrons are transferred from Ce to Mn for MnOx–CeO2 nanocubes.
Noted that the Mn3+/Mn2+ that are incorporated into the CeO2 lattice sites also contribute to the oxygen vacancies formation. MnOx–CeO2 nanocubes contained more Mn2+ species, but showed lower oxygen vacancies concentration than MnOx–CeO2 nanorods. Two possible reasons were responsible for the lower concentration of oxygen vacancies over MnOx–CeO2 nanocubes. First, some part of the Mn was not incorporated into the CeO2 lattice for the MnOx–CeO2 nanocubes. Mn3O4 was detected by XRD, as shown in Fig. 4(b). It is well known that Mn3O4 is composed of both Mn3+ and Mn2+.37,38 Some Mn3+/Mn2+ species come from the phase-segregated Mn3O4. These lower valence Mn species must not contribute to the formation of oxygen vacancies, since they were not in the CeO2 lattice. Second, when Mn is doped into CeO2, electrons were transferred from Ce to Mn and the Ce3+ fraction was decreased from 32% to 19%. Some oxygen vacancies over Mn3+/Mn2+ were produced at the expense of those over Ce3+ sites. Therefore, although a higher concentration of low valence Mn species was detected by XPS, the MnOx–CeO2 nanocubes still exhibited a lower concentration of oxygen vacancies. In the case of MnOx–CeO2 nanorods, electron transfer between Mn and Ce was also observed. However, the electron transfer was less significant than that over MnOx–CeO2 nanocubes. After the addition of Mn, the Ce3+ fraction was still up to 30%. Additionally, most of Mn was incorporated into the CeO2 lattice for the MnOx–CeO2 nanorods, as proved by the XRD results. Thus, Mn3+/Mn2+ might have contributed to the formation of oxygen vacancies for the MnOx–CeO2 nanorods.
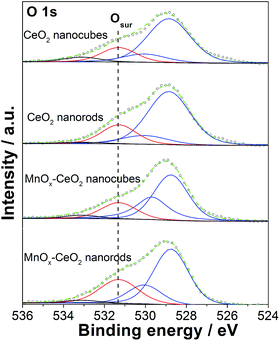
Fig. 8 shows the O 1s spectra for the CeO2 and MnOx–CeO2 nanomaterials. The peaks appearing at 528.9 and 530 eV are the lattice oxygen of the CeO2 and MnOx–CeO2 catalysts.39 The peak at 531.4 eV is the adsorbed active oxygen species, the peroxo species (O22−), and the superoxo species (O2−).40 The remaining peak at 533 eV is attributed to the adsorbed surface hydroxyl and water species. For the CeO2 catalysts, CeO2 nanorods possess 20% surface active oxygen, where CeO2 nanocubes have 16%. It is reported that oxygen vacancies can promote the formation of Ce3+, and that Ce3+ can induce the formation of active oxygen species.41 Thus, the cause of the higher active oxygen percentage for CeO2 nanorods might be due to the oxygen vacancies formed on the CeO2 nanorods surface. A similar trend was also observed for the MnOx–CeO2 catalysts, where MnOx–CeO2 nanorods contained 8% more active surface oxygen than MnOx–CeO2 nanocubes. It is also reported that active oxygen species can be created at the interface between the CeO2 lattice and MnOx.26 It is reasonable that more active oxygen species are found in MnOx–CeO2 nanorods, due to the synergy of Mn/Ce (more –MnO–Ce– bonds) and the higher Ce3+ concentration.
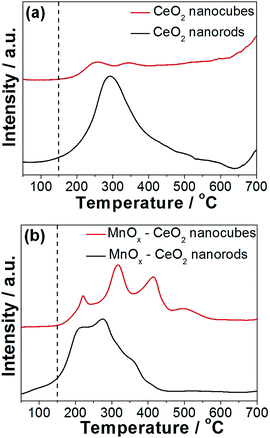
The redox properties of the CeO2 and MnOx–CeO2 catalysts were studied by H2-TPR experiments, and the results are displayed in Fig. 9. It is widely accepted that the low temperature reduction peak of CeO2 nanomaterials relates to the removal of surface capping oxygens, while the high temperature reduction peak is related to the bulk oxygen.42,43 It was observed that CeO2 nanorods are able to remove surface oxygen at 100 °C, while CeO2 nanocubes start to reduce at 150 °C. This indicates that CeO2 nanorods have more reducible surface Ce4+ ions compared with that of CeO2 nanocubes, which is attributed to the oxygen vacancies formed on the CeO2 nanorods surface, because oxygen vacancies can boost the transition from Ce4+ to Ce3+.
Doping Mn into the Ce lattice can improve the reducibility of the catalyst surface,27 which can clearly be observed in Fig. 9(b). The reduction peak of MnOx–CeO2 nanorods starts at 50 °C, while MnOx–CeO2 nanocubes start to reduce at 150 °C. Four reduction peaks were obtained for each MnOx–CeO2 catalyst. For MnOx–CeO2 nanorods, the peak at 200 °C is attributed to the reduction of MnO2 to Mn2O3. The second peak at 272 °C is assigned to the reduction of Mn2O3 to Mn3O4. The third peak at 360 °C is the mixed reduction of Mn3O4 to MnO and surface Ce4+ to Ce3+, while the high temperature reduction peak at 410 °C is the reduction of the bulk Ce4+ to Ce3+.35,44
The reduction peaks for MnOx–CeO2 nanocubes followed a similar pattern as that of the MnOx–CeO2 nanorods. It was found that MnO2 was first reduced to Mn2O3 at 220 °C, and then Mn2O3 was reduced to Mn3O4 at 315 °C. The third peak at 415 °C is due to the reduction of Mn3O4 to MnO. The reduction of surface Ce4+ was shifted to a high temperature around 500 °C due to the lower concentration of Ce3+ and the electron transfer from Ce to Mn. Compared to the reduction peaks of MnOx–CeO2 nanorods, all of the reduction peaks for MnOx–CeO2 nanocubes have shifted to higher temperatures. This is reasonable since more Mn has entered the Ce lattice for MnOx–CeO2 nanorods, which causes the formation of –Mn–O–Ce– bonds. It was reported that –Mn–O–Ce– bonds is more reducible than –Ce–O– or –Mn–O– bonds.26 The presence of –Mn–O–Ce– bonds effectively lowered the overall reduction temperature for MnOx–CeO2 nanorods.
It is interesting that MnOx–CeO2 nanorods also possess more compacted reduction peaks than MnOx–CeO2 nanocubes. This might be due to the greater abundance of Mn4+ and Mn3+ of MnOx–CeO2 nanorods, because higher oxidation states of Mn are easier to be reduced. Another possible explanation is that oxygen vacancies in MnOx–CeO2 nanorods could also promote the transition of Mn from 4 + to lower valence states, since it is able to lower the thermodynamic barrier for Ce4+ → Ce3+.
3.3 Catalytic wet air oxidation of phenol
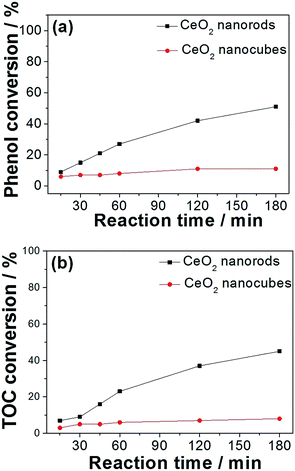
The catalytic performance of various oxides were investigated and the results are displayed in Table 2. It was found that cerium and manganese monoxides (Fig. S2†) exhibit much lower activities for the CWAO of phenol than the MnOx–CeO2 catalysts, which proves the effectiveness of Mn/Ce oxide composites. In order to study the effect of oxygen vacancies on the CWAO of phenol, CeO2 nanorods and nanocubes were carefully investigated. The adsorption experiments showed that CeO2 nanorods could absorb 5% of phenol, whereas CeO2 nanocubes could only absorb 1%. Fig. 10 illustrates the reaction profiles of phenol and TOC conversions for CeO2 nanomaterials at 140 °C and 2 MPa air. It was found that CeO2 nanocubes were almost inert toward the CWAO of phenol, whereas phenol and total organic carbon (TOC) conversions were 11% and 8%, respectively. Conversely, CeO2 nanorods were more active than CeO2 nanocubes, whereas 51% of phenol conversion and 45% of TOC removal were achieved.| Catalyst label | Phenol conversion (%) | TOC conversion (%) |
|---|---|---|
| CeO2 nanocubes | 8 | 6 |
| CeO2 nanorods | 27 | 23 |
| MnO2 | 79 | 67 |
| Mn3O4 | 70 | 62 |
| MnCeOx nanocubes | 100 | 97 |
| MnCeOx nanorods | 100 | 98 |
Compared to CeO2 nanomaterials, MnOx–CeO2 catalysts give very rapid phenol oxidation. MnOx–CeO2 nanorods could completely convert phenol and remove 98% of TOC within 30 min, at 140 °C and 2 MPa air (Fig. 11). The comparable activity for MnOx–CeO2 nanocubes could only be achieved after 60 min. Furthermore, the adsorption experiment showed that MnOx–CeO2 nanorods could absorb 15% of phenol, whereas MnOx–CeO2 nanocubes only absorbed 7%. It was seen that the addition of Mn could enhance the adsorption ability of CeO2 nanorods by more than 3 times. This is important, since adsorption is the primary step for the CWAO of phenol. Moreover, it was reported that high oxidation states of manganese oxide can also behave as active centers for phenol oxidation.36 Thus, it could be postulated that the addition of Mn helped to adsorb phenol and its intermediates, then Mn4+ was reduced and the adsorbed organic compounds were oxidized.
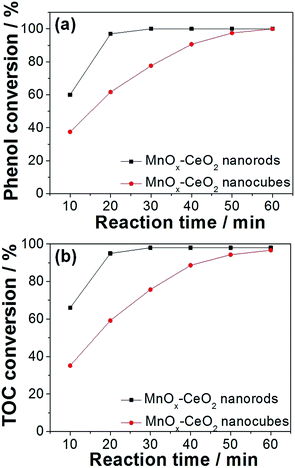 | ||
| Fig. 11 Phenol (a) and TOC (b) conversions on MnOx–CeO2 nanorods and nanocubes. Concentration of phenol: 1000 ppm; catalyst loading: 4 g L−1; temperature: 140 °C; pressure: 2 MPa air. | ||
Tests on the evolution of the small-molecule intermediates for MnOx–CeO2 catalysts were conducted, and the results are shown in Fig. 12. There are 4 major small-molecule intermediates: formic acid, acetic acid, oxalic acid, and hydroquinone. Other intermediates, including polymeric products, are also reported in the literature,45 and can be calculated by subtracting the concentration of the remaining TOC and small-molecule intermediates. The initial TOC value for phenolic solution was about 850 ppm. For MnOx–CeO2 nanorods, the TOC conversion was 98%, and the remaining TOC was calculated to be 17 ppm. The total organic carbon concentration of formic acid, acetic acid, oxalic acid, and hydroquinone was also converted, and turned out to be 15 ppm. Thus, it implies that the small-molecule intermediates are responsible for 88% of the remaining TOC for MnOx–CeO2 nanorods. On the other hand, the small-molecule intermediates are only responsible for 32% of the remaining TOC for MnOx–CeO2 nanocubes. This means MnOx–CeO2 nanocubes have converted more phenol into large-molecule intermediates. In other words, MnOx–CeO2 nanocubes are less oxidative than MnOx–CeO2 nanorods.
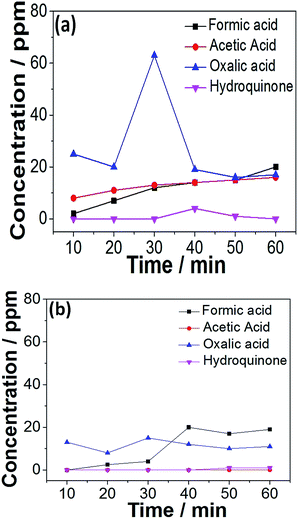 | ||
| Fig. 12 Evolution of the small-molecule intermediates in the CWAO of phenol over MnOx–CeO2 nanorods (a) and nanocubes (b). | ||
The MnOx–CeO2 catalysts were also examined by comparing their catalytic activities at various temperatures (Fig. S3†). The results show that the catalytic activity of MnOx–CeO2 nanorods and nanocubes are both positively related to the reaction temperature. MnOx–CeO2 nanorods and nanocubes exhibit similar catalytic activity at 100 and 180 °C. However, MnOx–CeO2 nanorods become much more active than MnOx–CeO2 nanocubes at 140 °C. This can be due to the high reducibility of MnOx–CeO2 nanorods surface, which play a more important role at moderate temperature.
In order to study the effect of oxygen partial pressure in the CWAO of phenol on MnOx–CeO2 nanorods and nanocubes, different pressures were investigated (Fig. S4†) for reaction. The temperature was kept at 140 °C and the catalytic activity was measured after 30 min reaction. When the total air pressure was set to 0.5 MPa, MnOx–CeO2 nanorods could convert 83% of phenol and 71% of TOC, whereas MnOx–CeO2 nanocubes could only convert 64% of phenol and 62% of TOC. When the pressure was increased, both the MnOx–CeO2 nanorods and nanocubes exhibited higher phenol and TOC conversions. MnOx–CeO2 nanorods could completely remove phenol when the total pressure was greater than 2 MPa air. On the other hand, MnOx–CeO2 nanocubes could only achieve 95.7% phenol conversion at 3.5 MPa air. These phenomena emphasize the importance of the oxygen partial pressure to the performance of MnOx–CeO2 catalyst materials.
For the CWAO of phenol, the oxidizing ability of the catalyst plays a decisive role in the whole CWAO process. The TEM and XPS results indicated that the two nanorods catalysts presented a higher amount of oxygen vacancies, while the H2-TPR results suggested that both nanorod catalysts possessed higher reducibility. Generally, the lower temperature at which the reduction peak appears, the higher the oxidizing ability the catalyst possesses. Clearly, increasing the oxygen vacancies concentration can promote the oxidizing ability and thus enhance the catalytic performance for the CWAO of phenol.
4 Conclusions
CeO2 and MnOx–CeO2 nanomaterials were synthesized and used for the CWAO of phenol, whereby both CeO2 and MnOx–CeO2 nanorods displayed superior catalytic activity than the cubic counterparts. The characterizations revealed that the catalytic activity can benefit from the presence of oxygen vacancies, which improves the reducibility of the catalyst surface and boosts the productivity of active oxygen species. The incorporation of Mn into the CeO2 lattice can increase the phenol adsorption ability and further promote the oxidizing ability of the catalyst. Overall, this study illustrates the importance of oxygen vacancies in cerium catalysts for the CWAO of phenol, which might provide clues for a later study on other catalysts in this field.Acknowledgements
The authors would like to thank the financial supports from the National Key Technology Support Program of China (No. 2014BAC10B01). Prof Dr Gai would like to thank the support from key scientific and technological project of China's Shanxi Province (No. MH2014-10). The support by the Natural Science Foundation of China (21336009 and 21673187) and the Natural Science Foundation of Fujian Province of China (No. 2015J05031) is also acknowledged.References
- S. Yang, W. Zhu, J. Wang and Z. Chen, J. Hazard. Mater., 2008, 153, 1248–1253 CrossRef CAS PubMed.
- I. P. Chen, S. S. Lin, C. H. Wang, L. Chang and J. S. Chang, Appl. Catal., B, 2004, 50, 49–58 CrossRef CAS.
- C. B. Maugans and A. Akgerman, Water Res., 1997, 31, 3116–3124 CrossRef CAS.
- R. L. Autenrieth, J. S. Bonner, A. Akgerman, M. Okaygun and E. M. McCreary, J. Hazard. Mater., 1991, 28, 29–53 CrossRef CAS.
- W. Li, S. Zhao, B. Qi, Y. Du, X. Wang and M. Huo, Appl. Catal., B, 2009, 92, 333–340 CrossRef CAS.
- A. B. Ayusheev, O. P. Taran, I. A. Seryak, O. Y. Podyacheva, C. Descorme, M. Besson, L. S. Kibis, A. I. Boronin, A. I. Romanenko and Z. R. Ismagilov, Appl. Catal., B, 2014, 146, 177–185 CrossRef CAS.
- S. Yang, M. Besson and C. Descorme, Appl. Catal., B, 2015, 165, 1–9 CrossRef CAS.
- S. S. Lin, C. L. Chen, D. J. Chang and C. C. Chen, Water Res., 2002, 36, 3009–3014 CrossRef CAS PubMed.
- S. Yang, Y. Cui, Y. Sun and H. Yang, J. Hazard. Mater., 2014, 280, 55–62 CrossRef CAS PubMed.
- S. Hamoudi, F. Larachi and A. Sayari, J. Catal., 1998, 177, 247–258 CrossRef.
- S. Imamura, A. Doi and S. Ishida, Ind. Eng. Chem. Prod. Res. Dev., 1985, 24, 75–80 CrossRef CAS.
- S. Imamura, M. Nakamura, N. Kawabata, J. Yoshida and S. Ishida, Ind. Eng. Chem. Prod. Res. Dev., 1986, 25, 34–37 CrossRef CAS.
- F. Arena, G. Trunfio, J. Negro and L. Spadaro, Appl. Catal., B, 2008, 85, 40–47 CrossRef CAS.
- S. X. Yang, X. G. Wang, H. W. Yang, Y. Sun and Y. X. Liu, J. Hazard. Mater., 2012, 233, 18–24 CrossRef PubMed.
- F. Arena, C. Italiano, G. Drago Ferrante, G. Trunfio and L. Spadaro, Appl. Catal., B, 2014, 144, 292–299 CrossRef CAS.
- F. Arena, J. Negro, A. Parmaliana, L. Spadaro and G. Trunfio, Ind. Eng. Chem. Res., 2007, 46, 6724–6731 CrossRef CAS.
- H. Zhang, X. Liu, N. Zhang, J. Zheng, Y. Zheng, Y. Li, C.-J. Zhong and B. H. Chen, Appl. Catal., B, 2016, 180, 237–245 CrossRef CAS.
- A. C. Gluhoi, N. Bogdanchikova and B. E. Nieuwenhuys, J. Catal., 2005, 229, 154–162 CrossRef CAS.
- X. Liu, K. Zhou, L. Wang, B. Wang and Y. Li, J. Am. Chem. Soc., 2009, 131, 3140–3141 CrossRef CAS PubMed.
- Y. Y. Lin, Z. L. Wu, J. G. Wen, K. R. Poeppelmeier and L. D. Marks, Nano Lett., 2014, 14, 191–196 CrossRef CAS PubMed.
- S. Agarwal, L. Lefferts and B. L. Mojet, ChemCatChem, 2012, 5, 479–489 CrossRef.
- F. Lin, D. Hoang, C.-K. Tsung, W. Huang, S.-Y. Lo, J. Wood, H. Wang, J. Tang and P. Yang, Nano Res., 2011, 4, 61–71 CrossRef CAS.
- E. Aneggi, D. Wiater, C. de Leitenburg, J. Llorca and A. Trovarelli, ACS Catal., 2014, 4, 172–181 CrossRef CAS.
- X. Xing, Y. Cai, N. Chen, Y. Li, D. Deng and Y. Wang, Ceram. Int., 2015, 41, 4675–4682 CrossRef CAS.
- H. Li, G. Qi, Tana, X. Zhang, W. Li and W. Shen, Catal. Sci. Technol., 2011, 1, 1677 CAS.
- P. Zhang, H. Lu, Y. Zhou, L. Zhang, Z. Wu, S. Yang, H. Shi, Q. Zhu, Y. Chen and S. Dai, Nat. Commun., 2015, 6, 8448–8458 CrossRef PubMed.
- W. Cen, Y. Liu, Z. Wu, H. Wang and X. Weng, Phys. Chem. Chem. Phys., 2012, 14, 5769–5777 RSC.
- S. P. Wang, L. F. Zhao, W. Wang, Y. J. Zhao, G. L. Zhang, X. B. Ma and J. L. Gong, Nanoscale, 2013, 5, 5582–5588 RSC.
- S. Liang, F. Teng, G. Bulgan, R. Zong and Y. Zhu, J. Phys. Chem. C, 2008, 112, 5307–5315 CAS.
- G. Hua, L. Zhang, G. Fei and M. Fang, J. Mater. Chem., 2012, 22, 6851–6855 RSC.
- E. Bêche, P. Charvin, D. Perarnau, S. Abanades and G. Flamant, Surf. Interface Anal., 2008, 40, 264–267 CrossRef.
- K. Niesz and D. E. Morse, Nano Today, 2010, 5, 99–105 CrossRef CAS.
- S. Hamoudi, F. ç. Larachi, A. Adnot and A. Sayari, J. Catal., 1999, 185, 333–344 CrossRef CAS.
- D. Delimaris and T. Ioannides, Appl. Catal., B, 2008, 84, 303–312 CrossRef CAS.
- P. Zhao, C. Wang, F. He and S. Liu, RSC Adv., 2014, 4, 45665–45672 RSC.
- H. Chen, A. Sayari, A. Adnot and F. ç. Larachi, Appl. Catal., B, 2001, 32, 195–204 CrossRef CAS.
- Z.-Y. Fei, B. Sun, L. Zhao, W.-J. Ji and C.-T. Au, Chem.–Eur. J., 2013, 19, 6480–6487 CrossRef CAS PubMed.
- G. Wang, B. B. Huang, Z. Z. Lou, Z. Y. Wang, X. Y. Qin, X. Y. Zhang and Y. Dai, Appl. Catal., B, 2016, 180, 6–12 CrossRef CAS.
- W. Deng, Q. Dai, Y. Lao, B. Shi and X. Wang, Appl. Catal., B, 2016, 181, 848–861 CrossRef CAS.
- H. Yao and Y. Y. Yao, J. Catal., 1984, 86, 254–265 CrossRef CAS.
- A. Trovarelli, Catal. Rev., 1996, 38, 439–520 CAS.
- S. Zhang, X.-S. Li, B. Chen, X. Zhu, C. Shi and A.-M. Zhu, ACS Catal., 2014, 4, 3481–3489 CrossRef CAS.
- R. Zhang, K. Lu, L. Zong, S. Tong, X. Wang and G. Feng, Appl. Surf. Sci., 2017, 416, 183–190 CrossRef CAS.
- X. Tang, Y. Li, X. Huang, Y. Xu, H. Zhu, J. Wang and W. Shen, Appl. Catal., B, 2006, 62, 265–273 CrossRef CAS.
- S. Nousir, S. Keav, J. Barbier Jr, M. Bensitel, R. Brahmi and D. Duprez, Appl. Catal., B, 2008, 84, 723–731 CrossRef CAS.
Footnote |
| † Electronic supplementary information (ESI) available: HRTEM images of CeO2 110 surface, XRD patterns of MnOx catalysts; phenol and TOC conversions on MnOx–CeO2 nanorods and nanocubes at various temperatures; phenol and TOC conversions on MnOx–CeO2 nanorods and nanocubes at various pressures. See DOI: 10.1039/c7ra04037g |
| This journal is © The Royal Society of Chemistry 2017 |

