
 Open Access Article
 This Open Access Article is licensed under a Creative Commons Attribution-Non Commercial 3.0 Unported Licence
Modified carbon felt made using CexA1−xO2 composites as a cathode in electro-Fenton system to degrade ciprofloxacin†
Yi Li *a,
Jingjing Hana,
Xueyue Mib,
Xinqiang Mic,
Yanan Lia,
Suge Zhanga and
Sihui Zhanb
*a,
Jingjing Hana,
Xueyue Mib,
Xinqiang Mic,
Yanan Lia,
Suge Zhanga and
Sihui Zhanb
aTianjin Key Laboratory of Molecular Optoelectronic Sciences, Department of Chemistry, School of Science, Tianjin University & Collaborative Innovation Center of Chemical Science and Engineering (Tianjin), Tianjin 300072, China. E-mail: liyi@tju.edu.cn
bCollege of Environmental Science and Engineering, Nankai University, Tianjin 300071, China
cBefar Group Corporation, Binzhou 256601, China
First published on 22nd May 2017
Abstract
Carbon felt (CF) was modified by CexA1−xO2 (A = Zr, Cu and Ni) and the role of these CexA1−xO2/CF (A = Zr, Cu and Ni) cathode materials in the oxidative degradation of antibiotic ciprofloxacin (CIP) was investigated in the electro-Fenton system. SEM, BET, TEM, XPS, TOC, HPLC-MS, CV and EIS were used to understand the characteristics of these cathode materials. The CIP degradation efficiency of the CexA1−xO2/CF (A = Zr, Cu and Ni) cathode was better than that of pure CF, and 2.0 wt% Ce0.75Zr0.25O2/CF was the most effective cathode material for degradation of CIP. It reached 100% degradation efficiency of CIP after 1 h and almost total mineralization (97.45%) after 6 h, owing to synergistic effects from the predominant role of homogeneous ˙OH produced electrocatalytically through the Fenton reaction of Fe2+ and H2O2 and heterogeneous ˙OH produced via the Fenton-like reaction of Ce3+ and H2O2 and the electrocatalytic activity of Ce0.75Zr0.25O2 composite and the strong electrosorption of carbon felt. A possible path of CIP degradation was proposed in the paper.
1 Introduction
In the last few years, environmental pollution has been paid much attention in the world, and the treatment of antibiotic wastewater is one of the major problems.1–3 Ciprofloxacin (CIP) is a fluoroquinolone antibiotic and its concentration has been detected up to 31 mg L−1 in waste effluents from pharmaceutical manufacturers.4,5 And ciprofloxacin is more difficult for microorganisms to degrade and cannot be effectively removed by conventional water treatment process.6 Therefore, it is important to find an effective method for removing ciprofloxacin from the environment.Advanced oxidation processes (AOPs)7–11 are based on in situ production of hydroxyl radicals (˙OH). As the second strongest oxidant after fluorine,12,13 ˙OH is able to non-selectively react with persistent organic pollutants (POPs) and degrade them into CO2, H2O and inorganic ions. Among AOPs, electrochemical advanced oxidation processes (EAOPs) have received much attention because of their efficiency in the destruction of toxic and/or bio-refractory organic pollutants, environmental friendliness and computability and widespread applications.14–17 Recently, the most common EAOP based on Fenton chemistry is the electro-Fenton (EF) process.18,19 An efficient cathode material is crucial to the EF system. At present, it has been reported that the cathode materials with excellent performance are gas diffusion electrode,20–22 graphite electrode23 and three-dimensional porous electrode.24 The biggest advantage of the three-dimensional porous electrode is the larger specific surface area, which greatly increases the electrode reaction area, and thus increases the reaction rate. Carbon felt (CF), a kind of three-dimensional porous electrode, is often used as electrode material in the EF process25 and all-vanadium redox flow battery26 because of their low cost, high stability, high conductivity, corrosion resistance, and high surface area. So we choose carbon felt as the supporting material to load CexA1−xO2 composites (A = transition metals) by using as cathode to degrade ciprofloxacin by the electro-Fenton process.
Over the past decades, cerium dioxide (CeO2) has received extensive attention, which possesses considerable oxygen storage capacity owing to the redox cycling between Ce3+ and Ce4+. However, pure CeO2 shows poor stability and is prone to sintering at high temperature which leads to reducing the catalytic activity.27 In order to further improve the performance of oxygen storage, oxygen release and thermal stability, we modified pure CeO2. When the transition metal ions are doped into CeO2 producing CexA1−xO2 (A = transition metals) composites, the cerium ion will be replaced by the transition metal ions which results in producing some lattice defects. This makes the migration channel of oxygen ions in the crystal lattice become relatively large, which can effectively reduce the diffusion resistance of oxygen in the crystal lattice and improve the ability of oxygen activity. And the conversion between different valence states of the transition metal ions is helpful to form oxygen vacancies. Thus the electro-catalytic activity of CeO2 is improved. CexA1−xO2 composites can be used for the treatment of automobile tail gas,28 the transformation of vanadium lithium battery29 and the degradation of antibiotics of carbon or graphite felt loaded iron oxide as cathode by EF system.30–32 However, it is not common that CexA1−xO2/CF composites are used as cathode to degrade antibiotics in the EF process.
In this paper, CexA1−xO2/CF (A = Zr, Cu and Ni) composites were obtained by impregnating the CF into CexA1−xO2 solid solution and then dried and calcined. And the carbon felt modified by CexA1−xO2 (A = Zr, Cu and Ni) composites was used as cathode to degrade CIP in EF system, respectively. Compared to the pure CeO2, CexA1−xO2/CF (A = Zr, Cu and Ni) composites have many superior aspects: (1) Ce0.75Zr0.25O2, Ce0.90Cu0.10O2 and Ce0.85Ni0.15O2 catalysts have more oxygen vacancies and higher oxygen storage capacity (OSC). (2) The electrocatalytic activities of Ce0.75Zr0.25O2, Ce0.90Cu0.10O2 and Ce0.85Ni0.15O2 composites are stronger than that of pure CeO2. (3) CF has strong electrosorption behavior. Above synergies gained the efficient degradation of CIP. And intermediates of CIP degradation were identified by using HPLC-MS analysis to propose a reasonable mineralization pathway.
2 Experimental
2.1 Chemicals
All chemicals are analytical grade and used without further purification. Ciprofloxacin, C17H18FN3O3 (≥98% purity), was purchased from Alfa Aesar, UK. Na2SO4, FeSO4·7H2O, Ce(NO3)3·6H2O, Zr(NO3)4·5H2O, Cu(NO3)2·3H2O and Ni(NO3)2·6H2O were purchased from Shanghai Aladdin Industrial Co. Methanol and phosphoric acid used in preparation of HPLC eluents were obtained from Sigma-Aldrich.2.2 Preparation of the CexA1−xO2/CF (A = Zr, Cu and Ni) composite electrodes
The CexA1−xO2/CF composites were prepared by impregnating the CF into CexA1−xO2 solid solution and then dried and calcined.33 Before the experiment, the CF should be treated with acid to enhance its wettability and eliminate impurities.34 The tri-dimensional carbon-felt (6 cm × 3 cm each side, 0.5 cm in width-Carbone Lorraine) was soaked in 10% H2O2 at 90 °C for 3 h and then marinated in 10% HCl at 90 °C for 1 h. At last, it was rinsed with distilled water and dried at 60 °C for overnight. CF was immersed into Ce(NO3)3·6H2O and Zr(NO3)4·5H2O solutions (quality ratio of 3![[thin space (1/6-em)]](https://www.rsc.org/images/entities/char_2009.gif) :1) accompanied by addition of NH3·H2O diluted solutions until the pH was 10 and the solutions went through ultrasound for half an hour. Subsequently, the sample was dried at 70 °C for 12 h and then heated to 500 °C for 5 h under a flow of N2. When the quantity of CF was 1 g, 24 mg Ce(NO3)3·6H2O and 8 mg Zr(NO3)4·5H2O was dissolved in 20 mL deionized water to prepare a 2.0 wt% precursor solution. In order to get the best load capacity, 1.0, 1.5, 2.5, and 3.0 wt% of Ce0.75Zr0.25O2 composites loaded on CF were investigated, respectively. According to the above description, the Ce0.75Zr0.25O2/CF composite electrodes were synthesized. Preparation of the Ce0.90Cu0.10O2/CF composite electrodes and the Ce0.85Ni0.15O2/CF composite electrodes employed the same method. However, the load capacity on CF was 1.0, 1.5, 2.0, 2.5, and 3.0 wt% of Ce0.90Cu0.10O2 composite, respectively. The load capacity of Ce0.85Ni0.15O2 composite on CF was 0.14, 0.30, 0.45 and 0.60 wt%, respectively. CF without modification by CexA1−xO2 was also heated to 500 °C for 5 h for comparison.
:1) accompanied by addition of NH3·H2O diluted solutions until the pH was 10 and the solutions went through ultrasound for half an hour. Subsequently, the sample was dried at 70 °C for 12 h and then heated to 500 °C for 5 h under a flow of N2. When the quantity of CF was 1 g, 24 mg Ce(NO3)3·6H2O and 8 mg Zr(NO3)4·5H2O was dissolved in 20 mL deionized water to prepare a 2.0 wt% precursor solution. In order to get the best load capacity, 1.0, 1.5, 2.5, and 3.0 wt% of Ce0.75Zr0.25O2 composites loaded on CF were investigated, respectively. According to the above description, the Ce0.75Zr0.25O2/CF composite electrodes were synthesized. Preparation of the Ce0.90Cu0.10O2/CF composite electrodes and the Ce0.85Ni0.15O2/CF composite electrodes employed the same method. However, the load capacity on CF was 1.0, 1.5, 2.0, 2.5, and 3.0 wt% of Ce0.90Cu0.10O2 composite, respectively. The load capacity of Ce0.85Ni0.15O2 composite on CF was 0.14, 0.30, 0.45 and 0.60 wt%, respectively. CF without modification by CexA1−xO2 was also heated to 500 °C for 5 h for comparison.
2.3 Electrolytic system
The EF degradation of CIP was conducted in a cylindrical glass cell of 250 mL capacity at room temperature (23 ± 2 °C) and pH = 3.0. The aqueous solution was 50 mg L−1 CIP solution and contained 0.1 mmol L−1 Fe2+ and 0.05 mol L−1 Na2SO4 solution. The solution was continuously saturated by bubbling compressed O2 at the rate of 100 mL min−1. The distance between the Pt plate (1 cm × 0.5 cm) as anode and CexA1−xO2/CF composites as cathode was 1.0 cm. There was a magnetic mixer to ensure the uniformity of the electrolysis during the EF process.2.4 Analytical procedures
Electrochemical activities of CexA1−xO2/CF composite electrodes were evaluated by using cyclic voltammetry (CV) and electrochemical impedance spectroscopy (EIS) in a traditional three-electrode cell. CexA1−xO2/CF composites were the working electrodes. Pt plate and saturated calomel electrode (SCE) were used as the counter electrode and the reference electrode, respectively.The concentration of CIP at a certain time was detected by reversed-phase high performance liquid chromatography (HPLC) using a Merck Lachrom liquid chromatograph equipped with a L-7100 pump, fitted with a Purospher RP-18, 5 μm, 25 cm × 4.6 mm (i.d.) column at 40 °C, and coupled with a L-7455 photodiode array detector selected at optimum wavelengths of 250 nm. The mobile phase was a methanol/0.06 mmol L−1 H3PO4 55:65 (v/v). A flow rate was 0.8 mL min−1. Samples of 20 μL were injected into the HPLC and the measurements were controlled through EZ-Chrom Elite 3.1 software.
The formed intermediates of CIP degradation to get a reasonable mechanism were identified by the high performance liquid chromatography-mass spectrometry (HPLC-MS, Waters XEVO TQS analyzer) connected with ESI source. The Waters Acquity UPLC BEH C18 column (2.1 mm × 1.8 mm, 1.7 μm) was employed. The temperature of the column was 40 °C. A gradient elution was applied using the mobile phase formed by 0.5% methane acid aqueous solution and acetonitrile (80%:20%) at the flow rate of 0.5 mL min−1, 10 min run. The injection volume was 20 μL and UV detector was set up at 276 nm. ESI source conditions were as follows: capillary voltage, sample cone voltage and extraction cone voltage were 2000, 45 and 4 V, respectively; the source block and desolvation temperatures were 100 and 250 °C, respectively and the desolvation and nebulizer gas (N2) flow rate was 600 L h−1. Total compounds mass spectra were obtained in the positive ion mode between m/z 100 and 400.
Scanning electron microscopy (SEM) images and mapping analysis were carried out on SU8010 field emission to obtain the microstructures and the composition of CexA1−xO2/CF composite electrodes. Transmission Electron Microscope (TEM) characterized the morphology and structure of the product. The nitrogen adsorption–desorption isotherm was measured at 77 K using the surface area and pore-size analyzer (Quantachrome Autosorb iQ-MP). The total surface area was calculated from the Brunauer–Emmett–Teller (BET) method and the pore size distribution data was calculated using the density functional theory (DFT) method based on the adsorption and desorption data. X-ray Photoelectron Spectroscopy (XPS) was used ESCA X PHI-1600 ray photoelectron spectroscopy of the United States PE company to obtain the data of the binding energies of Ce 3d, Zr 3d, Cu 2p, Ni 2p, C 1s and O 1s, and 284.6 eV was the referencing of C 1s peak. The removal of the total organic carbon (TOC, TOC-VCPH, Japan) can assess the mineralization degree of treated solutions.
3 Results and discussion
3.1 Characterizations of the CexA1−xO2/CF composite electrodes
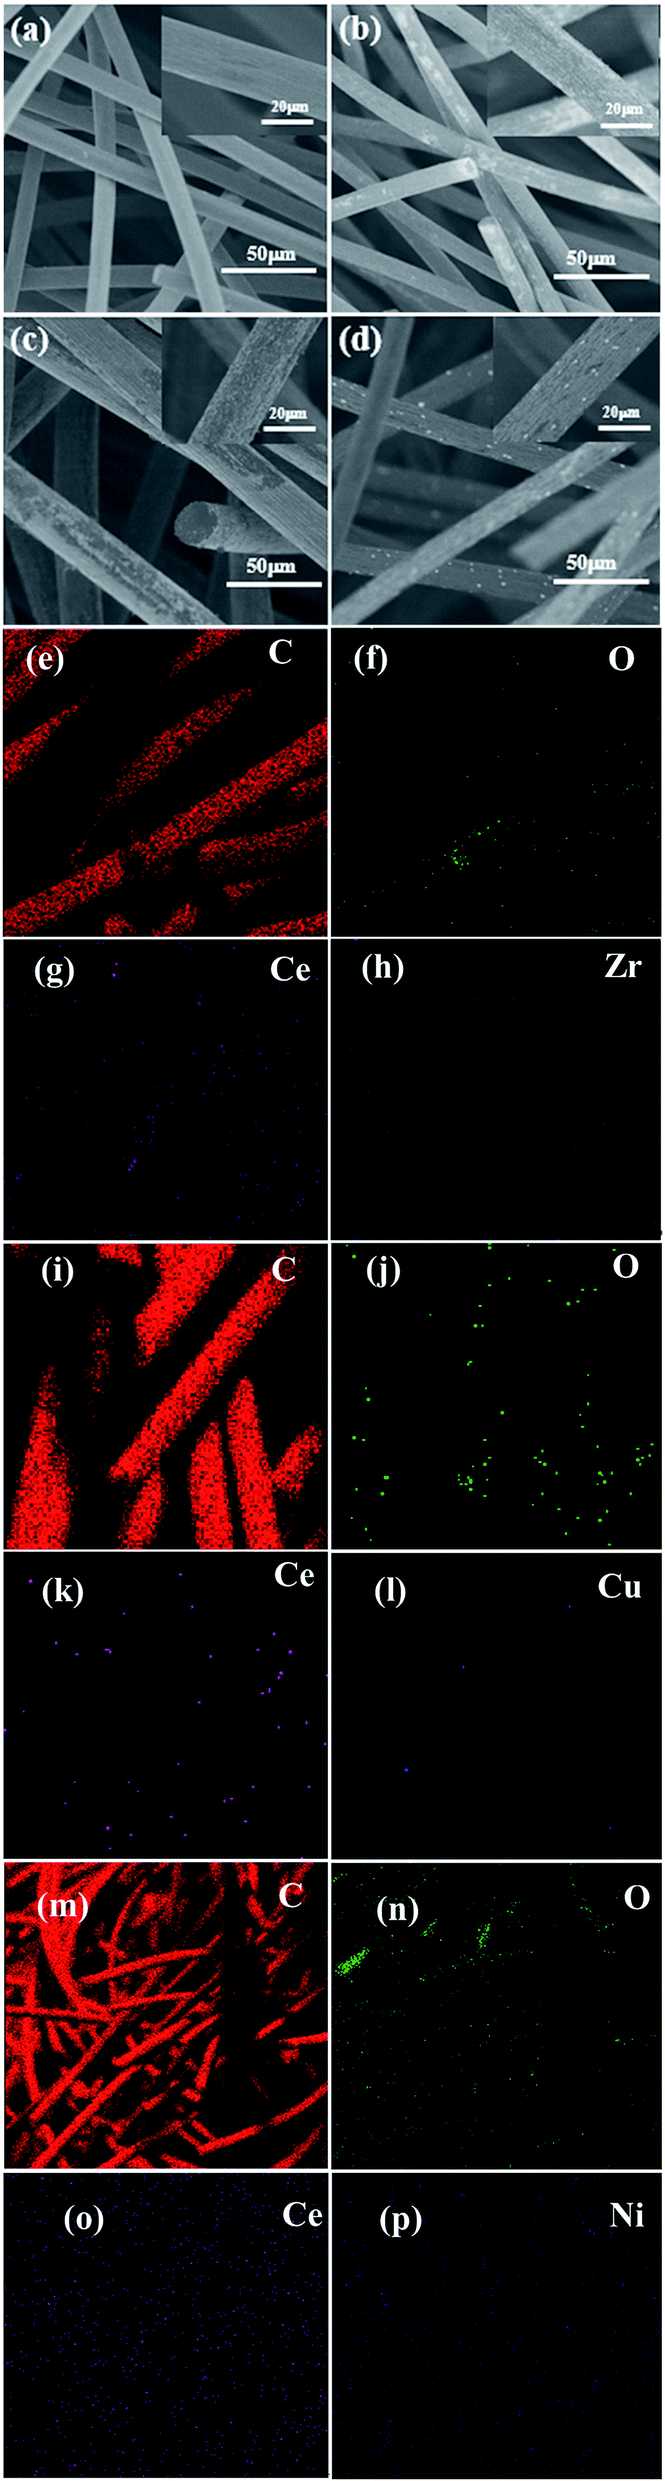 | ||
| Fig. 1 SEM images at different magnifications and mapping analysis of CF (a), 2.0 wt% Ce0.75Zr0.25O2/CF (b, e, f, g, h), 2.5 wt% Ce0.90Cu0.10O2/CF (c, i, j, k, l), 0.45 wt% Ce0.85Ni0.15O2/CF (d, m, n, o, p). | ||
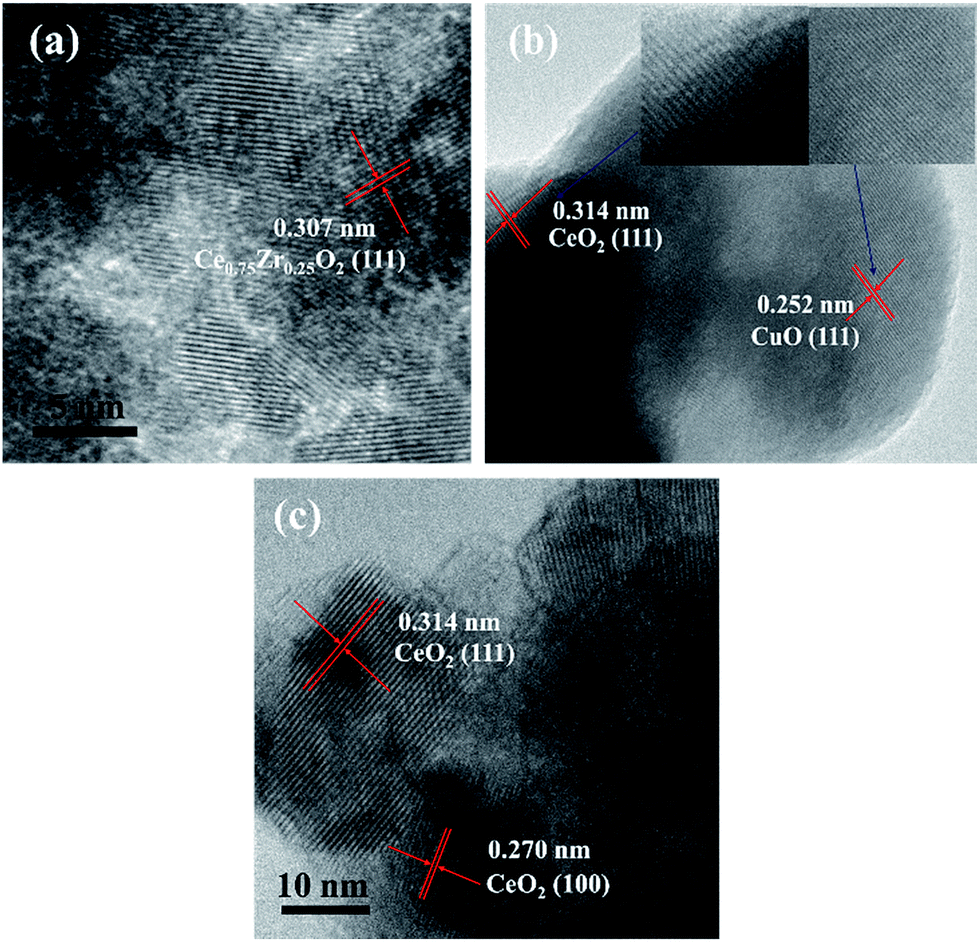 | ||
| Fig. 2 HR-TEM images of 2.0 wt% Ce0.75Zr0.25O2/CF composite (a), 2.5 wt% Ce0.90Cu0.10O2/CF composite (b) and 0.45 wt% Ce0.85Ni0.15O2/CF composite (c). | ||
![[double bond, length as m-dash]](https://www.rsc.org/images/entities/char_e001.gif) O groups (287.0 eV). And we find that there is an irregular peak in 282.0 eV corresponding to C–O–C groups.39 This may be due to the introduction of functional groups in the treatment of CF.
O groups (287.0 eV). And we find that there is an irregular peak in 282.0 eV corresponding to C–O–C groups.39 This may be due to the introduction of functional groups in the treatment of CF.
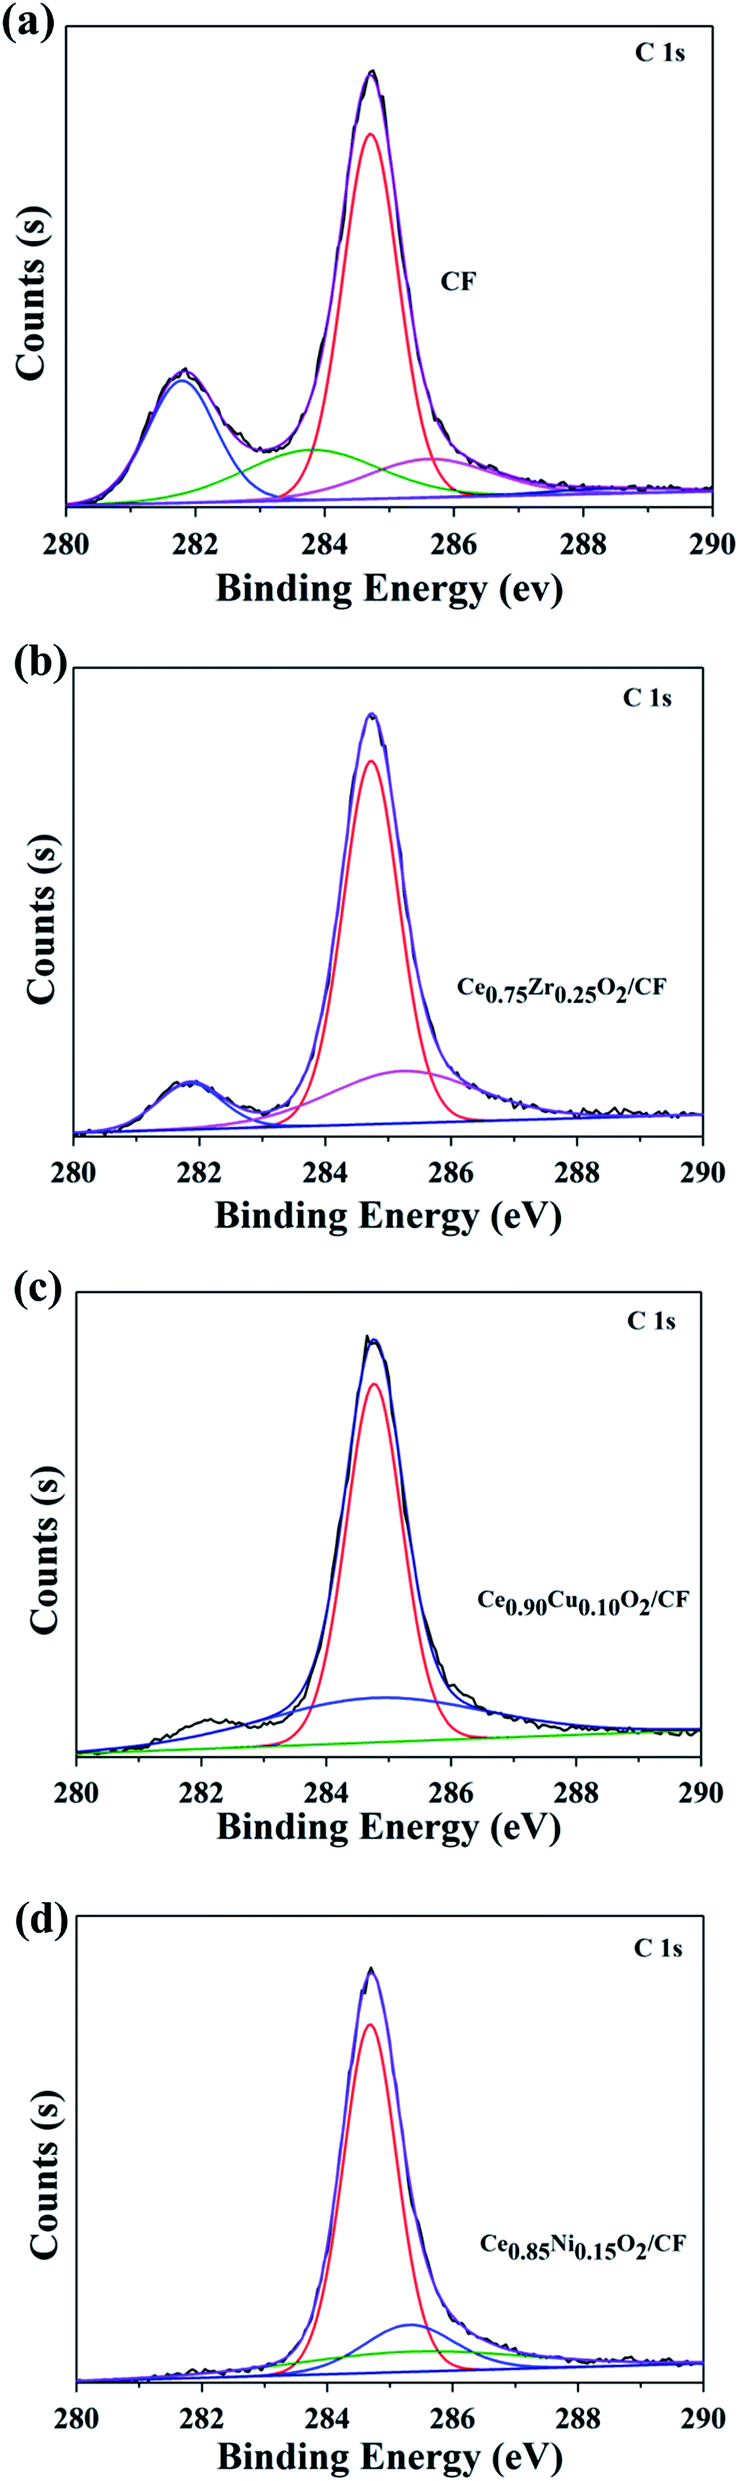 | ||
| Fig. 3 C 1s spectra of CF (a), 2.0 wt% Ce0.75Zr0.25O2/CF composite (b), 2.5 wt% Ce0.90Cu0.10O2/CF composite (c) and 0.45 wt% Ce0.85Ni0.15O2/CF composite (d). | ||
The XPS spectra of O 1s for electrode composites are given in Fig. 4. The O 1s XPS spectra are scientifically resolved into two XPS peaks centered at binding energies of 529.8 and 532.0 eV. The main peak at 532.0 eV has been assigned for O22− and O− ion deficiencies in the subsurface layer of metal oxides due to the formation of Ce0.75Zr0.25O2 solid solution, Ce0.90Cu0.10O2 solid solution and Ce0.85Ni0.15O2 solid solution.40–42 From Fig. 4, we also can see that the other peak at 529.8 eV has been assigned to the lattice oxygen in Ce0.75Zr0.25O2, Ce0.90Cu0.10O2 and Ce0.85Ni0.15O2 (O2− species). As shown in Table 1, the surface adsorption oxygen contents of Ce0.75Zr0.25O2, Ce0.90Cu0.10O2 and Ce0.85Ni0.15O2 are 17.64%, 41.50% and 35.80%, respectively. And the surface lattice oxygen contents of Ce0.75Zr0.25O2, Ce0.90Cu0.10O2 and Ce0.85Ni0.15O2 are 82.36%, 58.50% and 64.20%, respectively. However, when the CexA1−xO2 composite is loaded on the CF, the surface adsorption oxygen contents of Ce0.75Zr0.25O2/CF, Ce0.90Cu0.10O2/CF and Ce0.85Ni0.15O2/CF are 78.33%, 72.50% and 73.52%, respectively. And the surface lattice oxygen contents of Ce0.75Zr0.25O2/CF, Ce0.90Cu0.10O2/CF and Ce0.85Ni0.15O2/CF are 21.67%, 27.50% and 26.48%, respectively. It is obvious that the surface adsorption oxygen contents of CexA1−xO2/CF composite is more than that of CexA1−xO2 composite. We can also see that Ce0.90Cu0.10O2/CF and Ce0.85Ni0.15O2/CF have similar adsorption oxygen and lattice oxygen contents. However, Ce0.75Zr0.25O2/CF has higher adsorption oxygen content than that of other materials. The generation of rich adsorption oxygen can be mainly attributed to the formation of oxygen vacancies resulting from ZrO2 cooperation into the CeO2 lattice, which can provide superior conditions for the adsorption and activation of oxygen molecules and promote the formation of adsorption oxygen species on the surface of Ce0.75Zr0.25O2 catalysts. The results of O 1s XPS analysis indicate that the existence of a large amount of adsorption oxygen on the catalyst surface can produce abundant active oxygen species that contributes to the high activity of the catalysts.
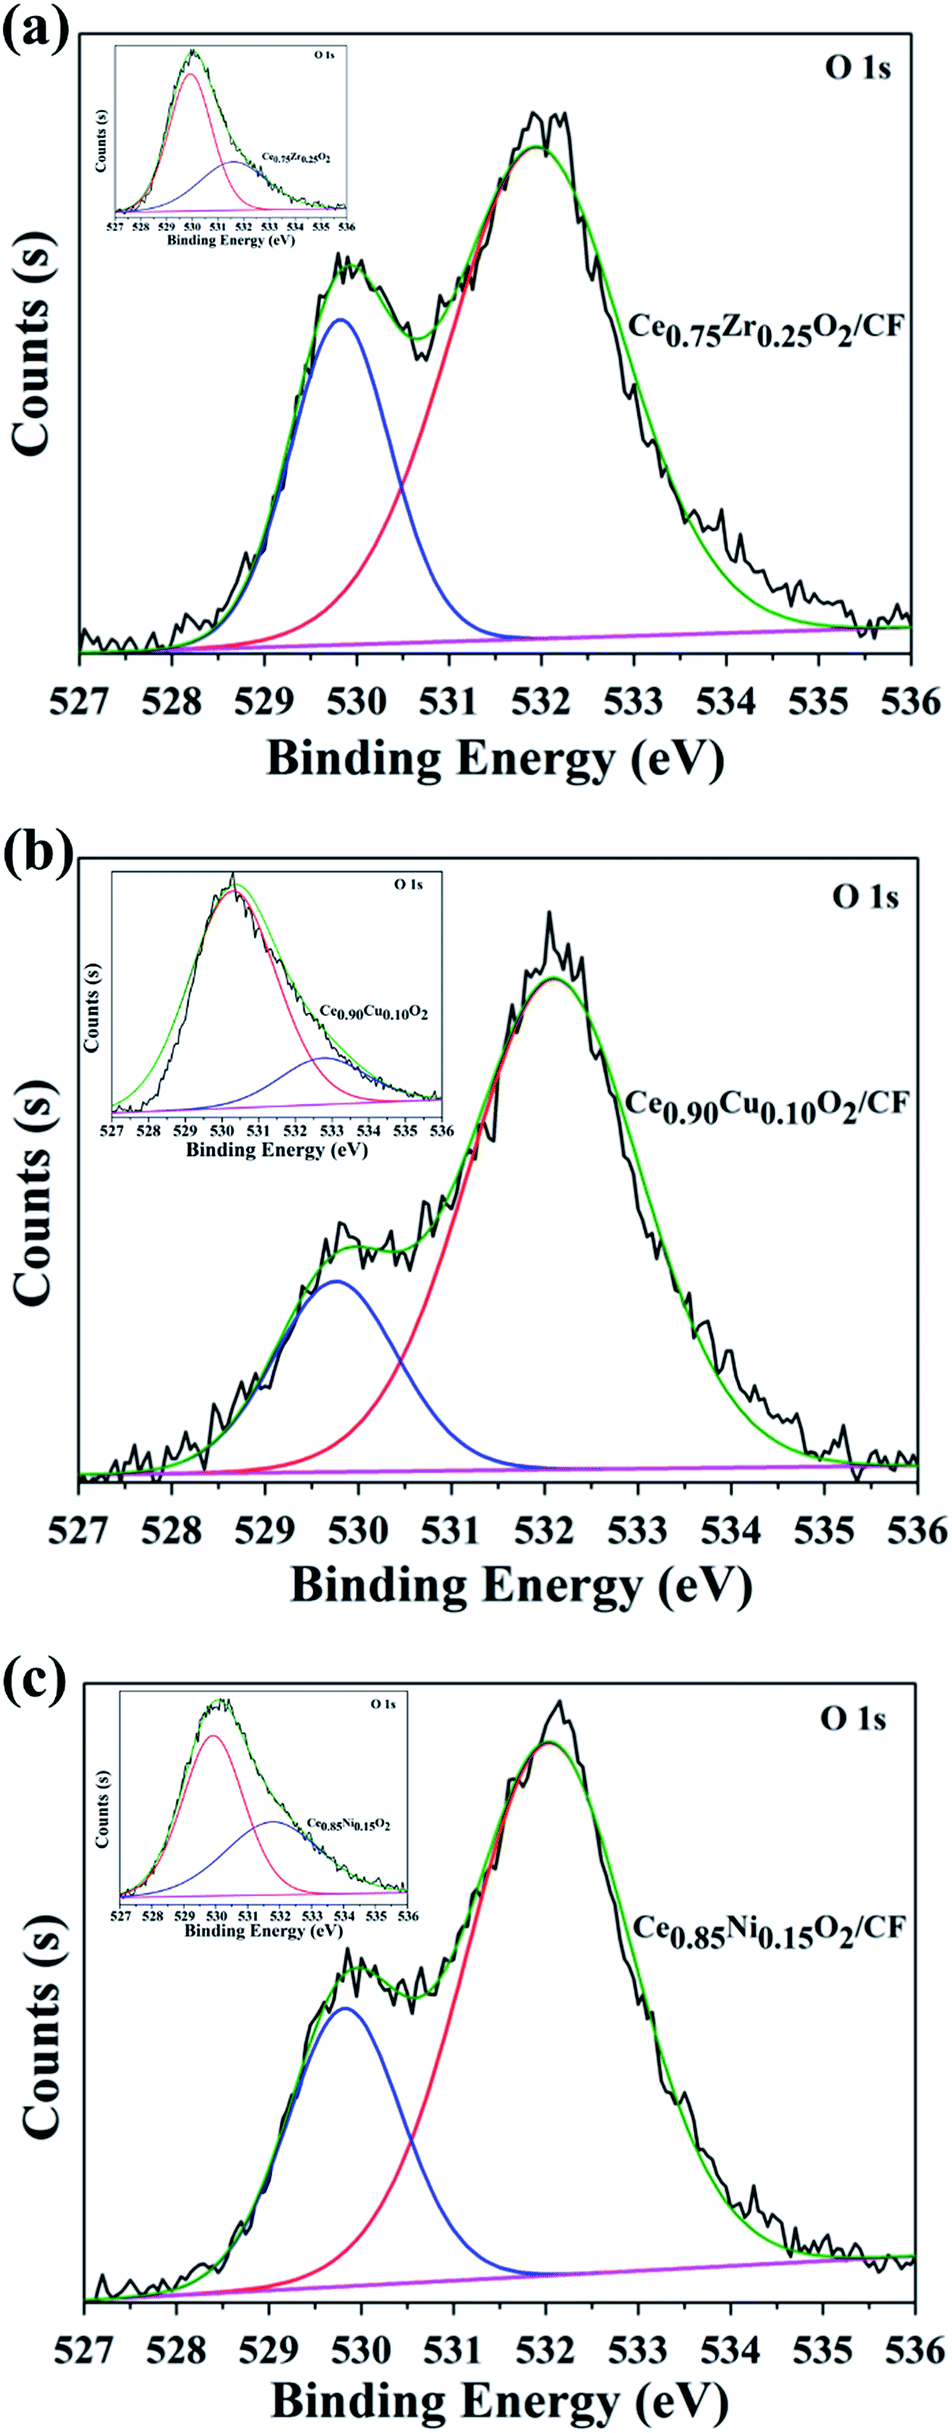 | ||
| Fig. 4 O 1s spectra of 2.0 wt% Ce0.75Zr0.25O2/CF composite (a), 2.5 wt% Ce0.90Cu0.10O2/CF composite (b) and 0.45 wt% Ce0.85Ni0.15O2/CF composite (c), the inserts in (a), (b) and (c) are O 1s spectra of Ce0.75Zr0.25O2 composite, Ce0.90Cu0.10O2 composite and Ce0.85Ni0.15O2 composite, respectively. | ||
| Cathode material | Oads | OLatt |
|---|---|---|
| Ce0.75Zr0.25O2 | 17.64% | 82.36% |
| Ce0.90Cu0.10O2 | 41.50% | 58.50% |
| Ce0.85Ni0.15O2 | 35.80% | 64.20% |
| Ce0.75Zr0.25O2/CF | 78.33% | 21.67% |
| Ce0.90Cu0.10O2/CF | 72.50% | 27.50% |
| Ce0.85Ni0.15O2/CF | 73.52% | 26.48% |
Fig. 5 shows XPS spectra of Ce 3d, Zr 3d, Cu 2p and Ni 2p for CexA1−xO2/CF (A = Zr, Cu and Ni) composites, respectively. Fig. 5a corresponds to Ce 3d XPS spectra of the prepared samples at 875–925 eV. The Ce 3d XPS spectra exhibits eight obvious XPS peaks at binding energies of about 882.4, 884.3, 887.7, 898.6, 901.5, 903.4, 905.8, and 916.8 eV. The four main 3d5/2 features at 882.4, 884.3, 887.7, and 898.6 eV correspond to V, V1, V2 and V3 components, while the 3d3/2 features at 901.3, 903.4, 905.8, and 916.8 eV correspond to U, U1, U2 and U3 components, respectively.43 The presence of the fingerprint U3 satellite peak at about 916.8 eV confirms the Ce4+ oxidation state. The appearance of characteristic bands of Ce3+ labeled V1 at 884.3 eV and U1 at 903.5 eV suggests that both oxidation states Ce4+ and Ce3+ co-exist on the surfaces of CexA1−xO2/CF composites. As shown in Fig. 5b, the two peaks approximately at 182.5 eV and 184.9 eV correspond to the Zr 3d5/2 and 3d3/2 spin–orbit states, respectively.44 Fig. 5c presents the Cu 2p XPS spectra of Ce0.90Cu0.10O2/CF composite. Three prominent XPS peaks can be observed at binding energies of 934.3, 941.5 and 954.5 eV, respectively. The XPS peaks centered at 934.3 and 954.5 eV correspond to Cu 2p3/2 and Cu 2p1/2, respectively. The peak at 941.5 is satellites arising from Cu 2p1/2. The satellite centered at about 939–944 eV and at a high Cu 2p3/2 binding Cu2+ content on the surface of the catalysts.45 Fig. 5d shows Ni 2p3/2 for the Ce0.85Ni0.15O2/CF composite. The main peak centered at 855.6 eV assigns to Ni2+ species. In addition, a broad peak at 861.8 eV is assigned as the shake-up satellite peak of Ni2+ (NiO) and Ni3+ (Ni2O3).46
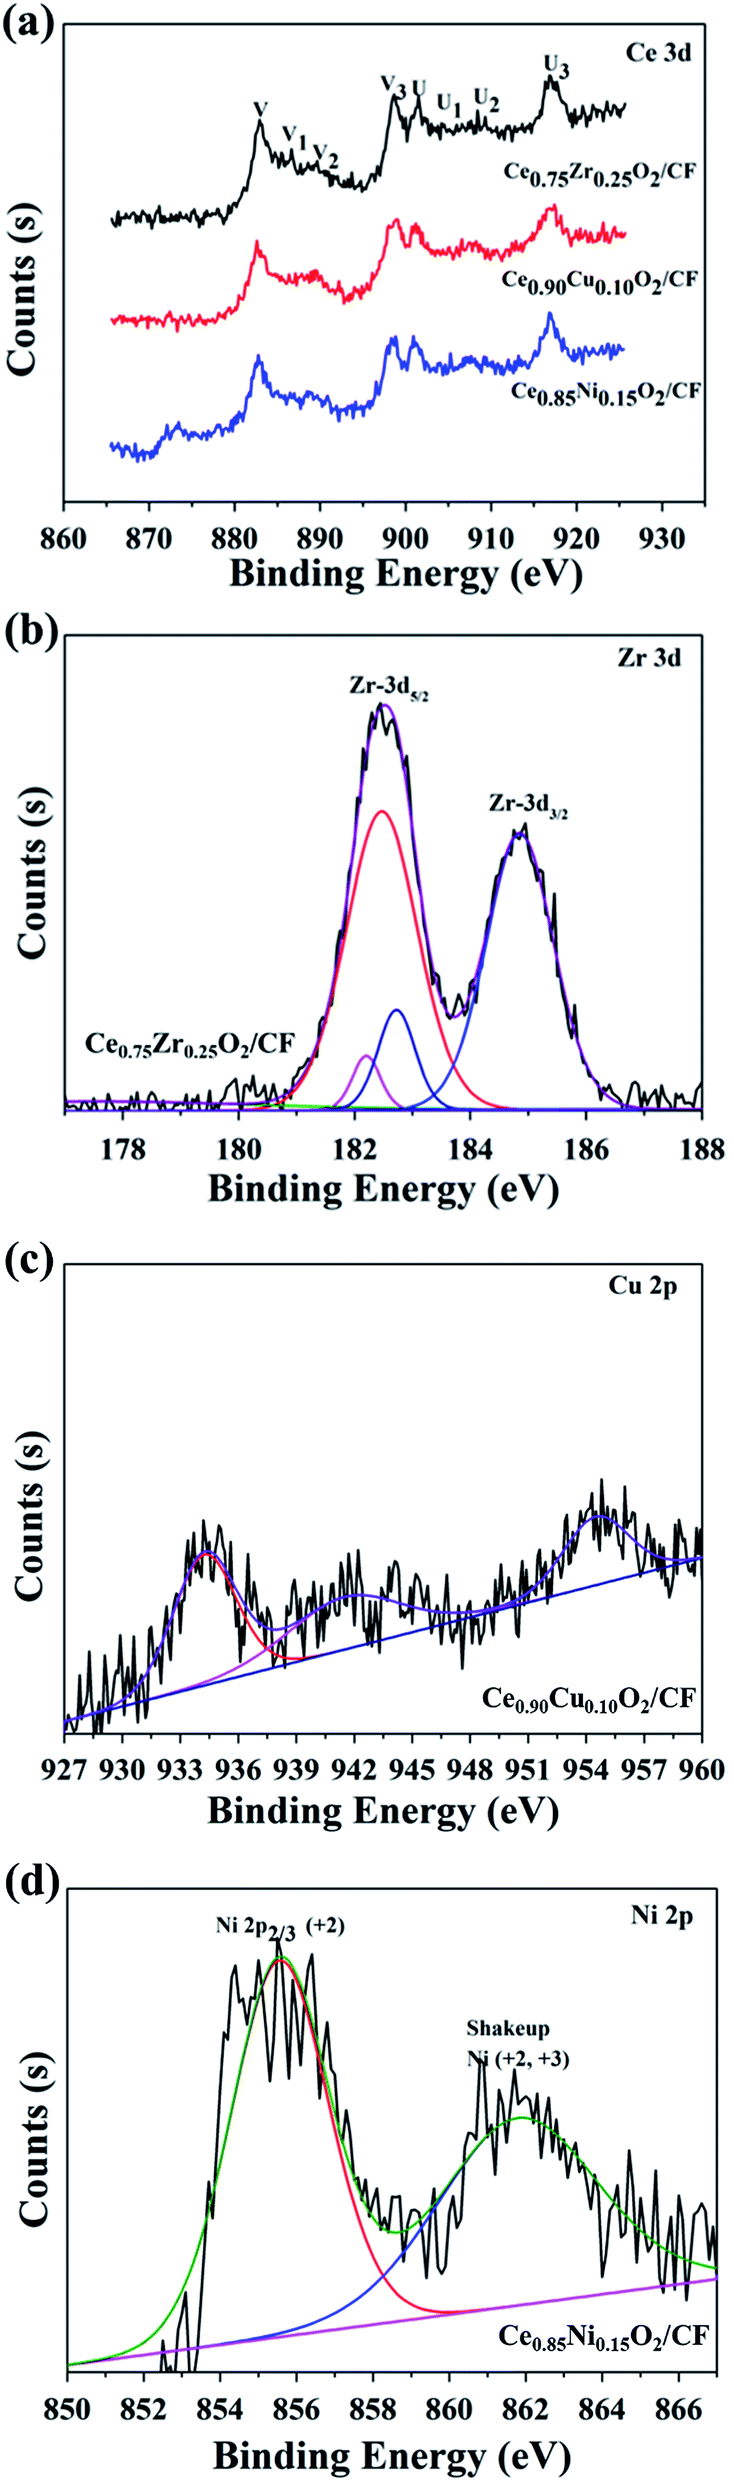 | ||
| Fig. 5 XPS spectra of Ce 3d for CexA1−xO2/CF (A = Zr, Cu and Ni) composites (a), Zr 3d for 2.0 wt% Ce0.75Zr0.25O2/CF composite (b), Cu 2p for 2.5 wt% Ce0.90Cu0.10O2/CF composite (c) and Ni 2p for 0.45 wt% Ce0.85Ni0.15O2/CF composite (d). | ||
To further identify the accurate element composition, the XPS wide scan spectra in the binding energy range of 0–1200 eV was performed on CF, 2.0 wt% Ce0.75Zr0.25O2/CF composite, 2.5 wt% Ce0.90Cu0.10O2/CF composite and 0.45 wt% Ce0.85Ni0.15O2/CF composite as shown in Fig. S1.† As shown in Fig. S1,† it can be found that Ce0.75Zr0.25O2, Ce0.90Cu0.10O2 and Ce0.85Ni0.15O2 nanoparticles successfully loaded on CF, respectively. And the atomic oxygen content on the surface increases with CexA1−xO2 (A = Zr, Cu and Ni) composite load on CF (from 8.24% for CF to 13.49%, 12.71% and 13.15% for Ce0.75Zr0.25O2/CF, Ce0.90Cu0.10O2/CF and Ce0.85Ni0.15O2/CF composite). Moreover, it revealed that the doping of Zr, Cu and Ni elements can improve the catalytic properties of CeO2.
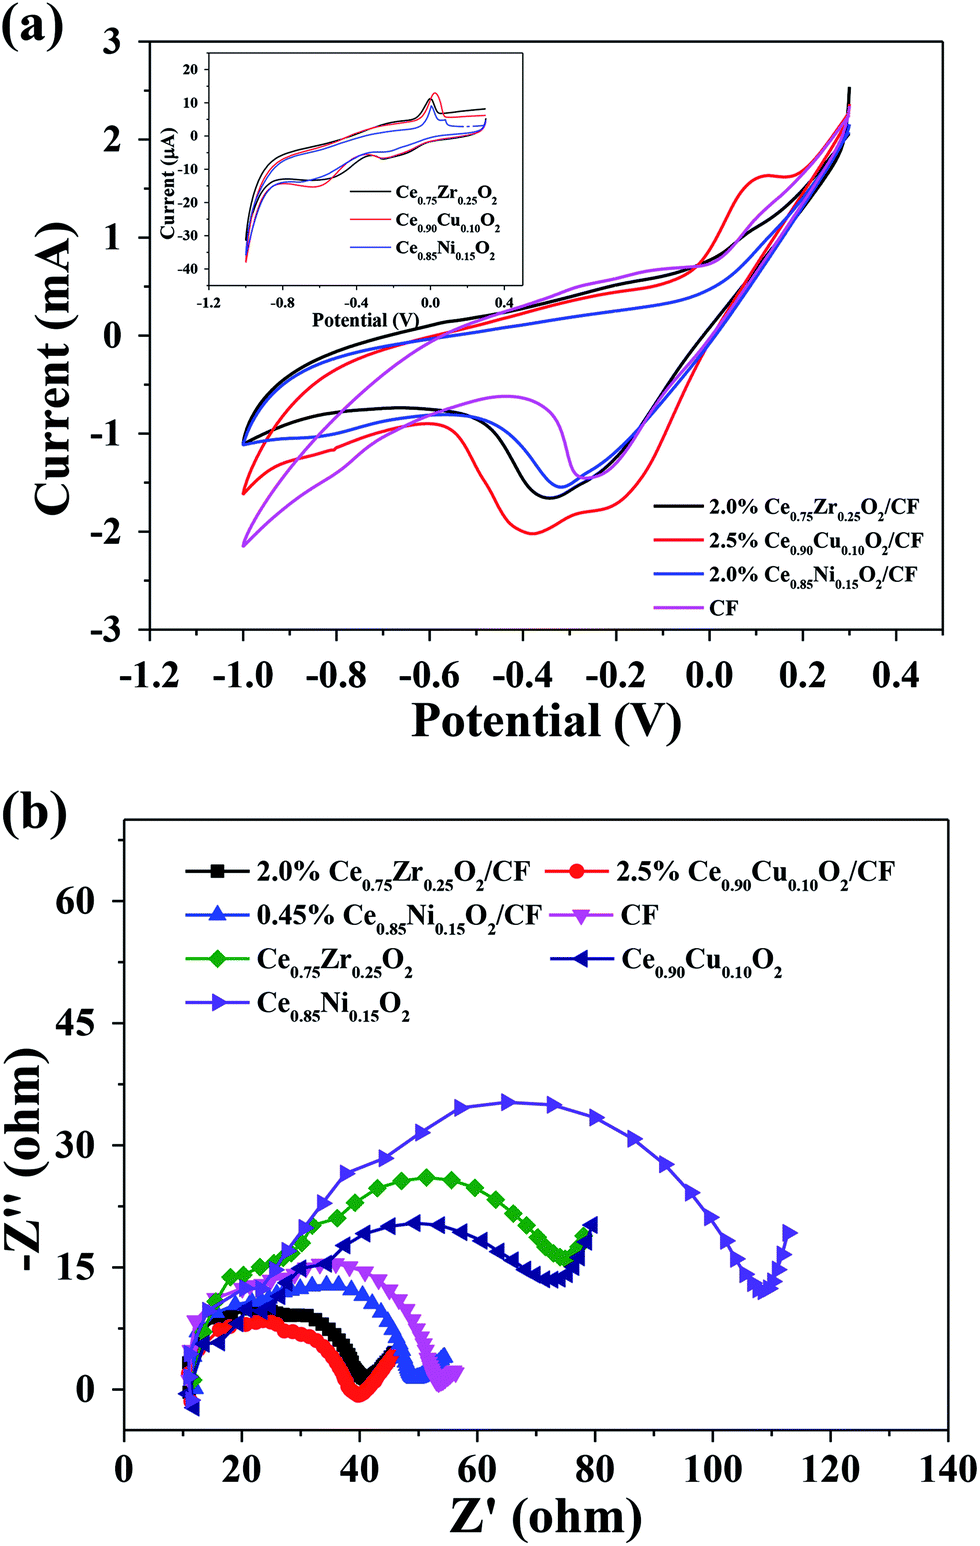 | ||
| Fig. 6 (a) Cyclic voltammetry of CexA1−xO2 (A = Zr, Cu and Ni) composite, CexA1−xO2/CF composite and CF electrodes in 50 mg L−1 CIP with 0.1 mmol L−1 Fe2+ and 0.05 mol L−1 Na2SO4 at pH = 3 solution, the scan rate was 0.04 V s−1, all scans were performed from the negative potential to positive potential and the initial potential was −1.0 V. (b) Nyquist plots of CexA1−xO2 (A = Zr, Cu and Ni) composite, CexA1−xO2/CF composite and CF electrodes under a potential of 0.8 V in 50 mg L−1 CIP with 0.1 mmol L−1 Fe2+ and 0.05 mol L−1 Na2SO4 at pH = 3 solution. | ||
Fig. 6b shows the Nyquist plots of CexA1−xO2 (A = Zr, Cu and Ni) composite, CexA1−xO2/CF composite and CF electrodes under a potential of 0.8 V in 50 mg L−1 CIP with 0.1 mmol L−1 Fe2+ and 0.05 mol L−1 Na2SO4 at pH = 3 solution. It can be found that there is a semicircular part at high frequency which represents the charge transfer process. And the smaller of the radius of the semicircle, the better electrochemical activity of electrode and the faster of electron transfer rate. It can be seen that the electrochemical performance of CF is much better than that of Ce0.75Zr0.25O2, Ce0.90Cu0.10O2 and Ce0.85Ni0.15O2. And the electrochemical performance of 2.0 wt% Ce0.75Zr0.25O2/CF, 2.5 wt% Ce0.90Cu0.10O2/CF and 0.45 wt% Ce0.85Ni0.15O2/CF is better than that of CF. This is because Ce0.75Zr0.25O2, Ce0.90Cu0.10O2, and Ce0.85Ni0.15O2 nanoparticles are well dispersed on CF, respectively. And Ce0.90Cu0.10O2/CF has the best electrochemical behavior. However, the difference of the semicircle radius for these three electrodes is very small.
3.2 Analysis of influence factors on the oxidative degradation of CIP
Fig. 7 shows that CIP is rapidly degraded by electro-Fenton with CIP degradation efficiency of 83.03%, 100%, 93.07% and 95.90% after 1 h by using CF, Ce0.75Zr0.25O2/CF, Ce0.90Cu0.10O2/CF and Ce0.85Ni0.15O2/CF, respectively. As shown in Fig. 7a, the degradation efficiency is 88.91% for electrosorption of CIP on CF (no Fe2+ and no CexA1−xO2 adding) after 2 h which shows CF has a strong electrosorption behavior. The reason why there is a strong electrosorption behavior is that the carbon felt has large specific surface area and can produce 0.7054 mg L−1 H2O2 as a cathode after 2 h (from Fig. S4†). From Fig. 7b–d, we can see the degradation efficiency is respectively 96.24%, 92.64% and 95.75% for electrocatalysis and electrosorption of CIP by using the Ce0.75Zr025O2/CF, Ce0.90Cu0.10O2/CF and Ce0.85Ni0.15O2/CF electrodes (no Fe2+ adding) which shows CexA1−xO2 has a strong catalytic activity. The result is that 0.4235 mg L−1, 0.3748 mg L−1 and 0.3980 mg L−1 H2O2 are produced when Ce0.75Zr0.25O2/CF, Ce0.90Cu0.10O2/CF and Ce0.85Ni0.15O2/CF electrodes are individually used as cathode. And what's more, a Fenton-like reaction between Ce3+ and H2O2 may be happened. Therefore, synergistic effects from the predominant role of the Fenton reaction of Fe2+ and H2O2 forming homogeneous ˙OH and the Fenton-like reaction of Ce3+ and H2O2 producing heterogeneous ˙OH and the electrocatalytic activity of CexA1−xO2 (A = Zr, Cu and Ni) composites and the strong adsorption of CF contribute to the degradation efficiency of CIP in electro-Fenton system.
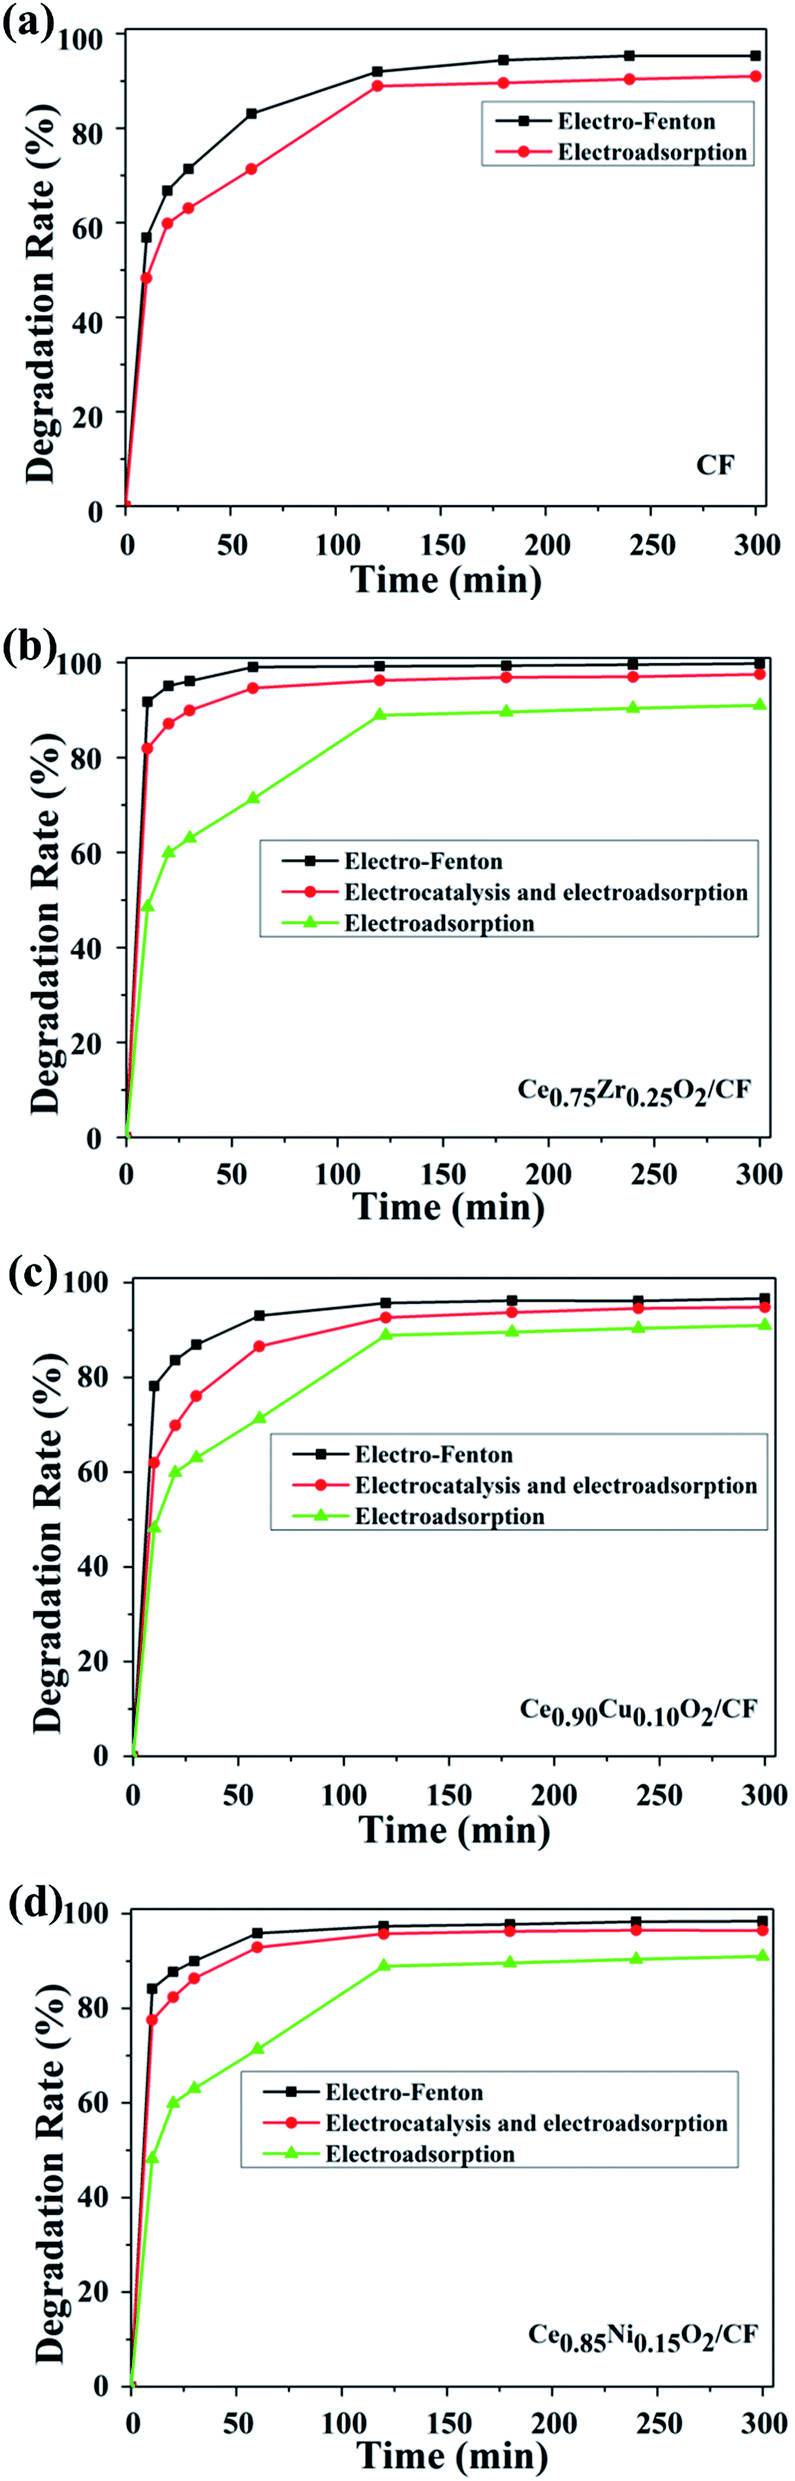 | ||
| Fig. 7 Degradation efficiency of CIP by electro-Fenton, electrocatalysis and electrosorption (a) CF, (b) Ce0.75Zr0.25O2/CF, (c) Ce0.90Cu0.10O2/CF, (d) Ce0.85Ni0.15O2/CF at the experiment condition: pH = 3, 0.1 mmol L−1 Fe2+ and 0.05 mol L−1 Na2SO4 solution. | ||
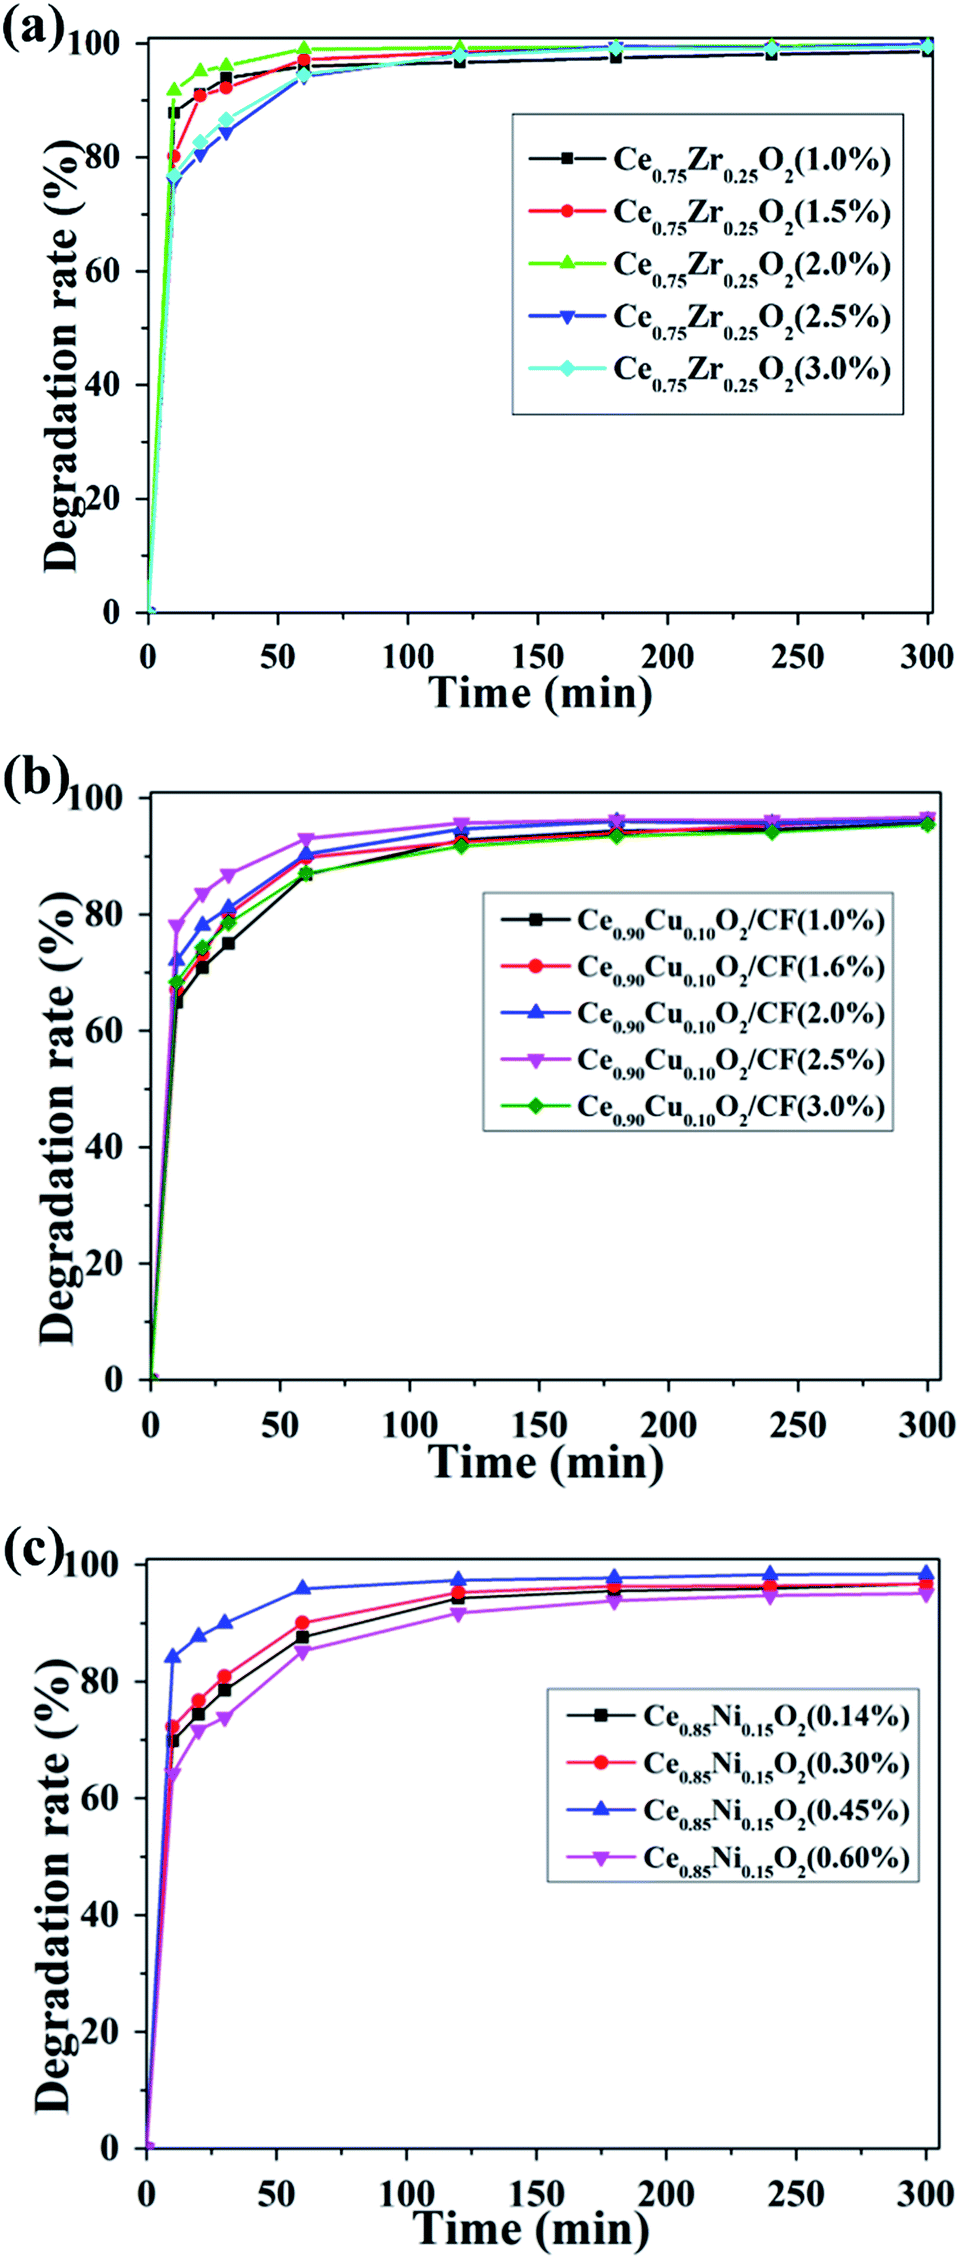
From Fig. 8a, it can be seen that with the increase of Zr doping amount, the CIP degradation efficiency increased and then decreased when the load capacity of Ce1−xZrxO2 (the Zr loading, x wt%) was fixed at 2.0 wt%. The degradation efficiencies of CIP for Ce/Zr quality ratio of 0.85:0.15, 0.75:0.25 and 0.65:0.35 were 94.78%, 100% and 92.66% after 2 h, respectively. So the Ce/Zr ratio of 0.75:0.25 exhibited the highest degradation efficiency, which demonstrates Ce0.75Zr0.25O2 composite having a large amount of oxygen vacancy and strong electrocatalytic activity. As shown in Fig. 8b, it was found that the degradation efficiency for CIP increased first and then decreased with the increase of the Cu doping amount when the load capacity of Ce1−xCuxO2 (the Cu loading, x wt%) was fixed at 2.5 wt%. The CIP degradation efficiencies of CIP for Ce/Cu quality ratio of 0.95:0.05, 0.90:0.10 and 0.85:0.15 were 86.35%, 95.70% and 87.84% after 2 h, respectively. So the Ce/Cu ratio of 0.90:0.10 exhibited the highest degradation efficiency, which indicates Ce0.90Cu0.10O2 composite has a large amount of oxygen vacancy and strong electrocatalysis effect. When Ce1−xNixO2 (the Ni loading, x wt%) load capacity was fixed at 0.45 wt%, it could be seen that the CIP degradation efficiency also increased first and then decreased with increase of the Ni doping amount from Fig. 8c. The CIP degradation efficiencies of CIP for Ce/Ni quality ratio of 0.80:0.20, 0.85:0.15 and 0.90:0.10 were 90.77%, 97.33% and 93.40% after 2 h, respectively. Apparently, the Ce/Ni ratio of 0.85:0.15 exhibited the highest degradation efficiency which showed Ce0.85Ni0.15O2 composite having large amount of oxygen vacancy and strong electrocatalytic activity.
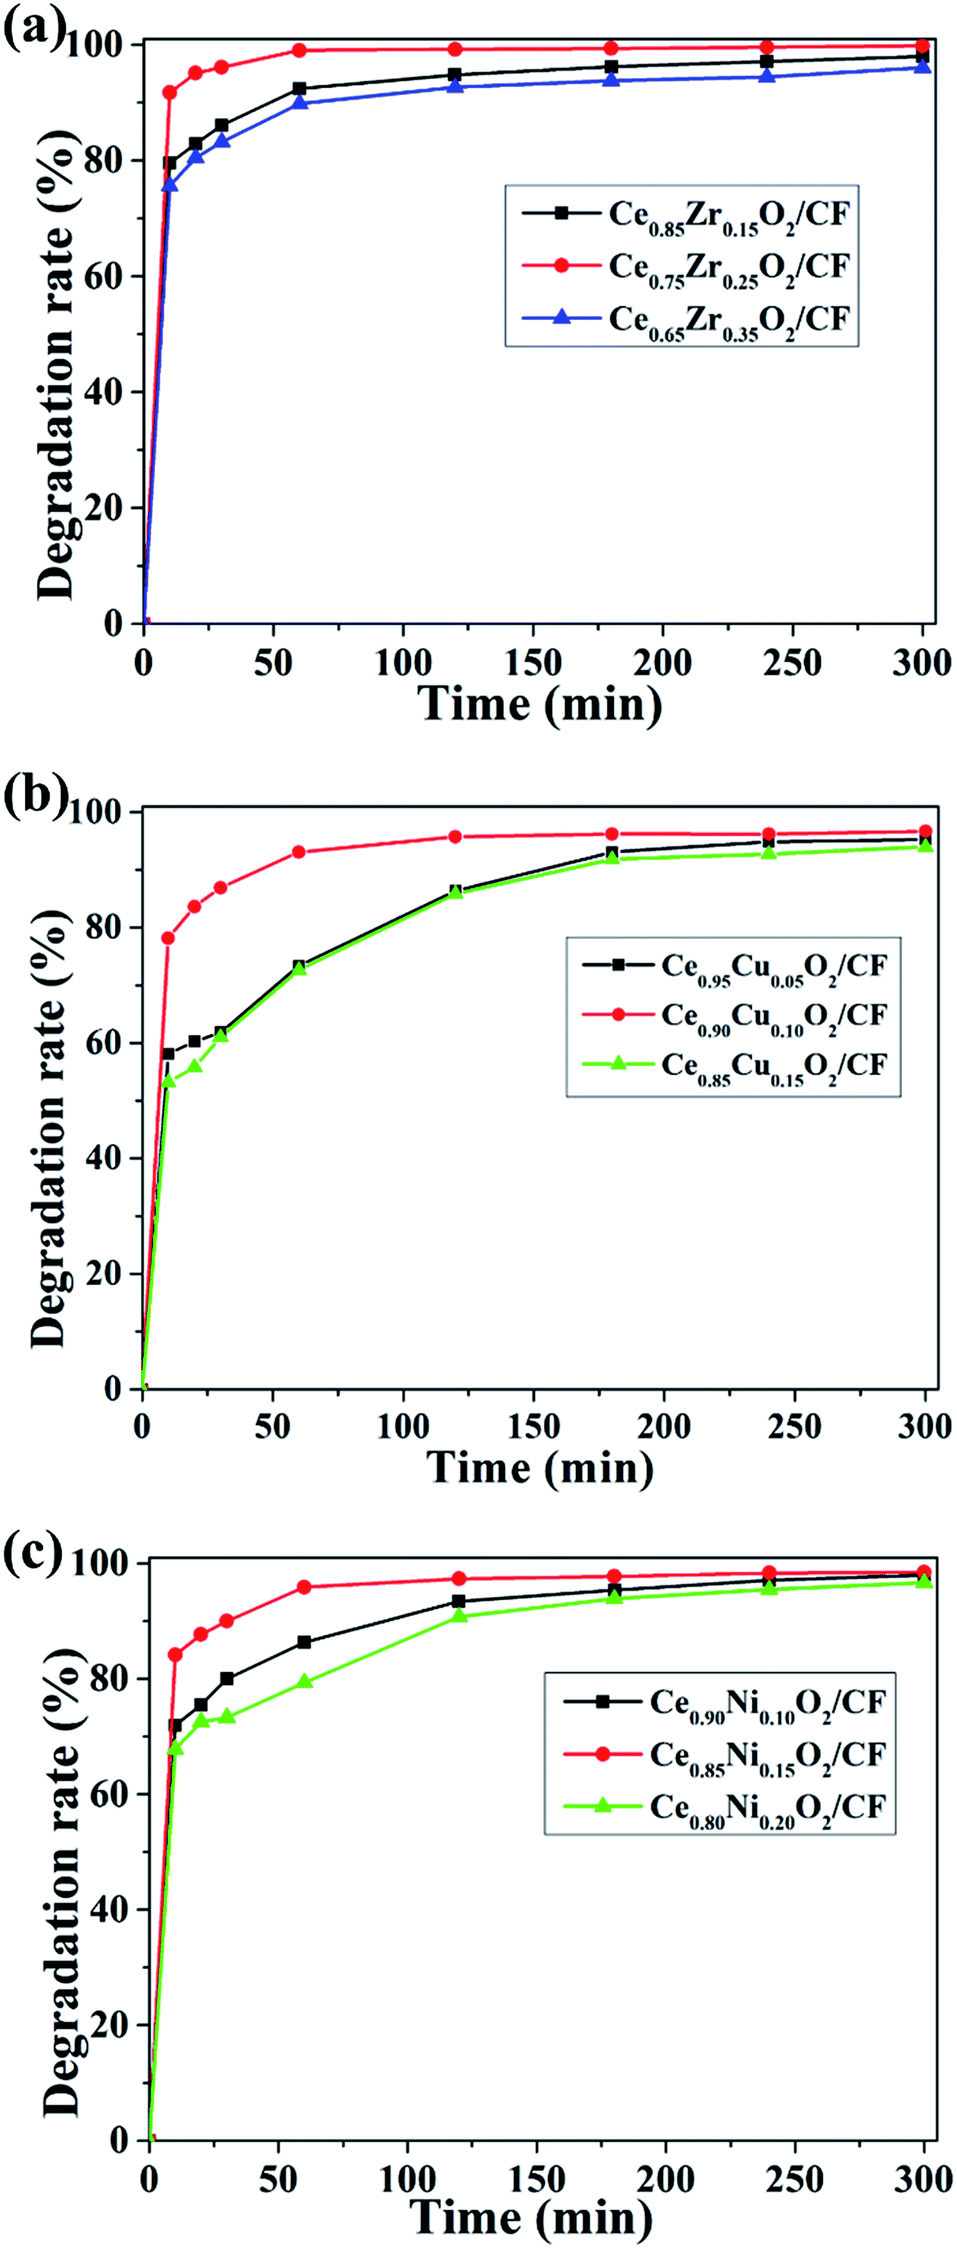 | ||
| Fig. 8 Degradation efficiency of CIP in the presence of CexA1−xO2/CF composites (A = Cu and Ni) with different Ce/Zr (a), Ce/Cu (b) and Ce/Ni ratios (c) at the experiment condition: pH = 3, 0.1 mmol L−1 Fe2+ and 0.05 mol L−1 Na2SO4 solution. | ||
 | ||
| Fig. 9 Effect of (a) Ce0.75Zr0.25O2, (b) Ce0.90Cu0.10O2, (c) Ce0.85Ni0.15O2 load capacity on degradation efficiency of CIP at pH = 3, 400 mA, 0.1 mmol L−1 Fe2+ and 0.05 mol L−1 Na2SO4 solution of the experiment condition. | ||
As shown in Fig. 9a, there was a positive effect on CIP degradation when Ce0.75Zr0.25O2 load increased from 1.0 wt% to 2.0 wt%. Meanwhile, the CIP solution degradation efficiency increased from 96.02% to 100% after 1 h. This effect might be due to the increase of oxygen vacancies with the increase of Ce0.75Zr0.25O2 loading. Thus, more ˙OH could be formed by Ce0.75Zr0.25O2 and Fe2+ catalysis. That is to say, there is a synergy between Fe2+ and Ce3+ to make feasible a larger production of hydroxyl radical.32 However, with the further increase of Ce0.75Zr0.25O2 loading, the degradation efficiency decreased to 94.54% and 94.24% for 2.5 wt% and 3.0 wt% Ce0.75Zr0.25O2 loading, respectively. It may be due to the too much loading of Ce0.75Zr0.25O2, so that the conductivity of Ce0.75Zr0.25O2/CF electrode became poor.
Fig. 9b shows the influence of different loading capacity of Ce0.90Cu0.10O2 on the degradation of the CIP. When Ce0.90Cu0.10O2 loading increased from 1.0 wt% to 2.5 wt% on the CF, we found that the degradation efficiency of CIP increased from 86.86% to 93.07% after 2 h. However, the degradation efficiency of CIP of 2.5 wt% Ce0.90Cu0.10O2 loading on CF only reached 96.65% after 5 h. This may be caused by the adsorption of a large number of CIP intermediates on the surface of Ce0.90Cu0.10O2, which affected production of oxygen vacancy and the electro-conductivity of Ce0.90Cu0.10O2/CF electrode. It could be seen that the removal rate of CIP decreased to 87.08% of 3.0 wt% Ce0.90Cu0.10O2 loading from Fig. 9b. Because Ce0.90Cu0.10O2 content was too high in Ce0.90Cu0.10O2/CF composite which led to blocking the pores of Ce0.90Cu0.10O2/CF composite, and then the effective area for O2 adsorption decreased which contributed to producing less oxygen vacancy.
From Fig. 9c, we could see that the CIP degradation efficiency increased from 87.59% to 95.90% after 1 h with the increase of Ce0.85Ni0.15O2 loading from 0.14 wt% to 0.45 wt% on CF, respectively. And the CIP degradation efficiency of 0.45 wt% Ce0.85Ni0.15O2 loading on CF reached to 98.33% after 4 h. That maybe that more oxygen vacancies were produced when the loading of Ce0.85Ni0.15O2 increased and more ˙OH was produced. However, when the Ce0.85Ni0.15O2 loading increased to 0.6 wt%, the CIP solution removal rate reached 85.23% and 94.75% after 1 h and 4 h, respectively. That was because the conductivity of Ce0.85Ni0.15O2/CF electrode became poor.
Overall, Fig. 9 shows the optimal load capacity of Ce0.75Zr0.25O2, Ce0.90Cu0.10O2 and Ce0.85Ni0.15O2 on CF was 2.0 wt%, 2.5 wt% and 0.45 wt%, respectively. And their corresponding CIP degradation efficiencies were about 100%, 93.07% and 95.9% at 1 h, respectively. The highest degradation performance was measured for the Ce0.75Zr0.25O2/CF electrode at the experiment condition of 400 mA, pH = 3, 0.1 mmol L−1 Fe2+ and 0.05 mol L−1 Na2SO4 solution.
Fig. 10a shows the effect of applied current on the oxidative degradation of CIP by using CF as cathode. The degradation efficiency increases from 61.84% to 83.03% after 1 h when the applied current increased from 100 to 400 mA. This enhanced degradation efficiency of CIP is due to higher electrochemical production of H2O2 and Fe2+ catalyst regeneration causing a higher concentration of homogeneous ˙OH in the solution. In addition, the increased current density leads to an enhanced production of Pt (˙OH) on the anode surface.18 However, further increase in current to 500 mA, the CIP degradation efficiency reaches 81.87% after 1 h which is lower than that of 400 mA. This is because the side reactions have an enhanced rate which competes with the CIP oxidative degradation.50 The main side reactions as follows:
| O2 + 4e− + H+ = H2O | (1) |
| H2O + 2e− = H2 + 2OH− | (2) |
| H2O2 = O2 + 2H+ + 2e− | (3) |
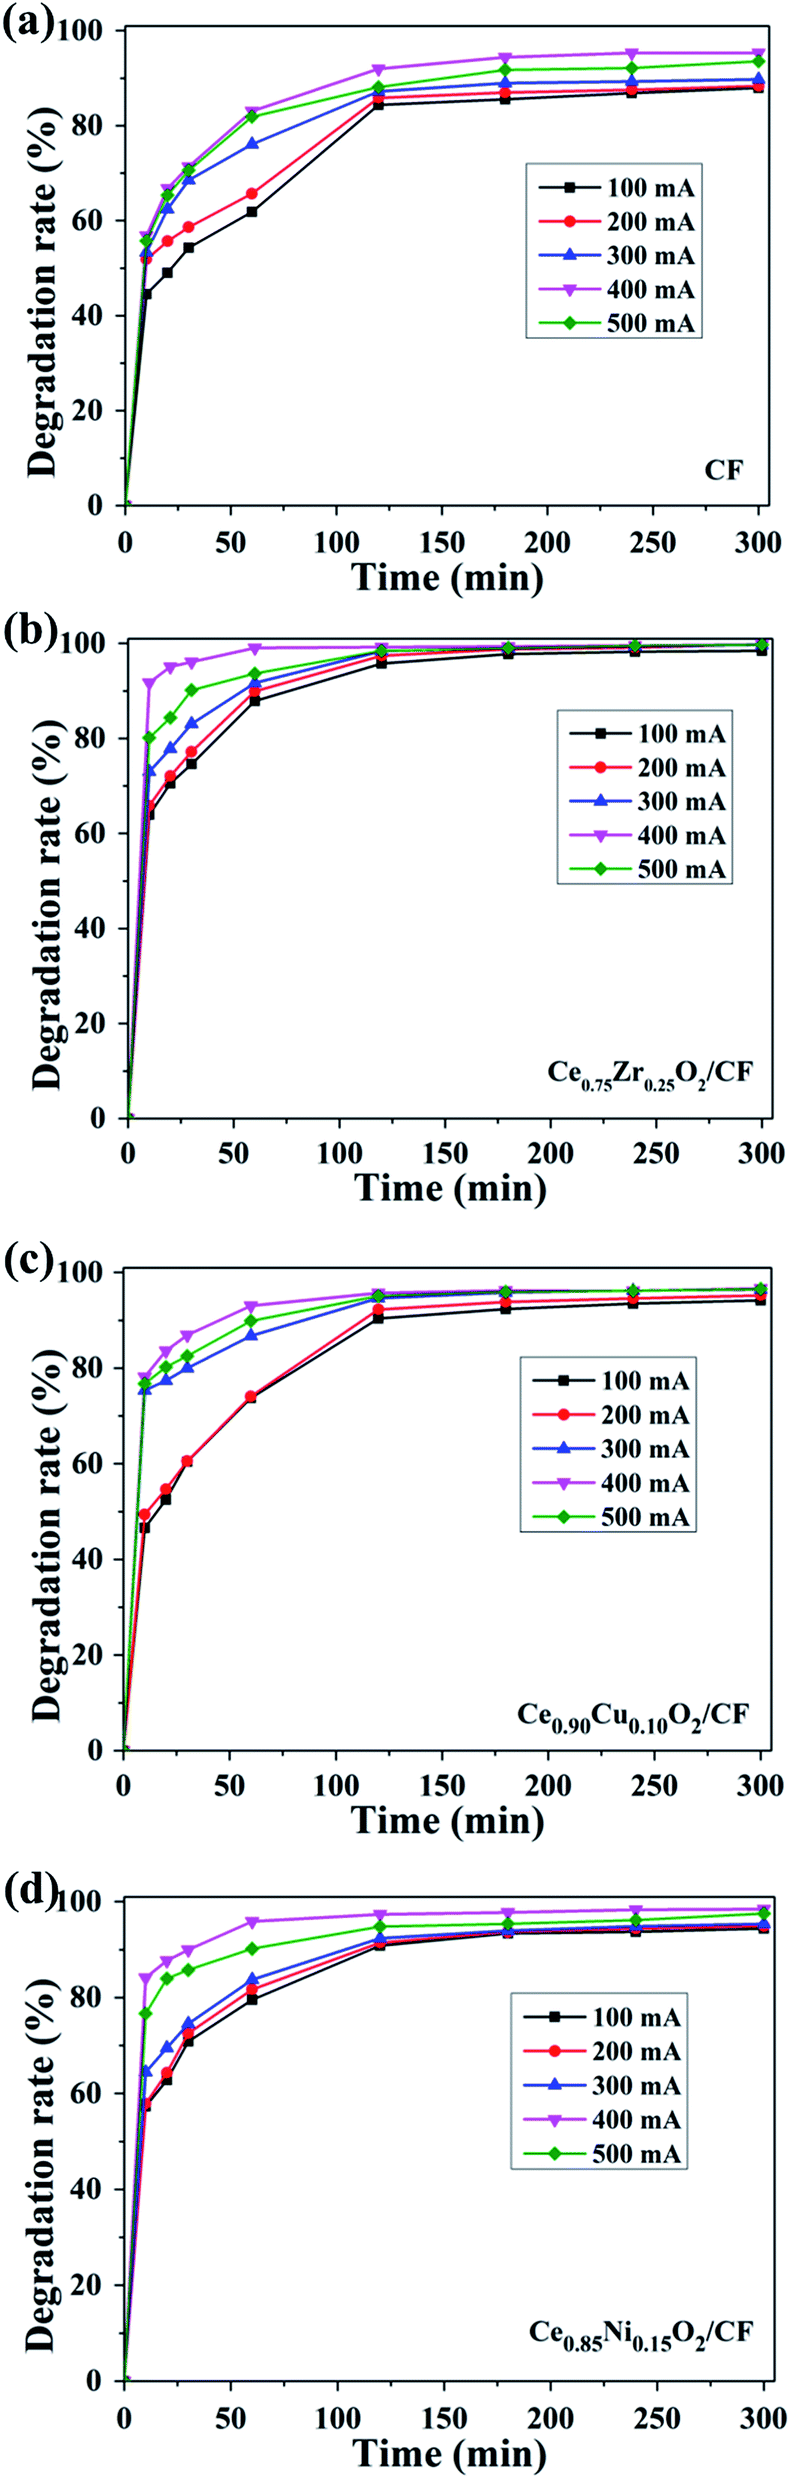 | ||
| Fig. 10 Effect of applied current on the degradation of CIP in the cell of (a) Pt/CF, (b) Pt/Ce0.75Zr0.25O2/CF, (c) Pt/Ce0.90Cu0.10O2/CF, (d) Pt/Ce0.85Ni0.15O2/CF experiment condition: pH = 3, 0.1 mmol L−1 Fe2+ and 0.05 mol L−1 Na2SO4 solution. | ||
Therefore, 400 mA is the optimal current value on the CIP degradation.
As shown in Fig. 10b, the oxidation degradation performance of the Ce0.75Zr0.25O2/CF composites as cathode is tested under the same operating conditions. Obtained results showed that the CIP degradation efficiency is accelerated from 87.87% to about 100% after 1 h by increasing the applied current from 100 to 400 mA. This is probably related to higher electrochemical production of H2O2 and Fe2+ catalyst regeneration and Ce3+ catalyst generation occurring at the Ce0.75Zr0.25O2/gas interface51 causing a higher concentration of ˙OH. However, further increase current to 500 mA, the degradation efficiency of CIP decreases which can explained by acceleration of side reactions (eqn (1)–(3)) at higher current values. So the optimal current is 400 mA for the degradation of CIP when Ce0.75Zr0.25O2/CF composites used as cathode.
Fig. 10c shows the impact of different applied current on the decay of the CIP by using as Ce0.90Cu0.10O2/CF as cathode in the EF process. Due to electrochemical production of H2O2 from O2 reduction and the electro-catalysis of Fe2+ and Ce3+, the degradation efficiency of CIP increases from 60.42% to 86.90% after 0.5 h electrolysis when the applied current increases from 100 to 400 mA. However, when the applied current is 500 mA, the degradation efficiency is reduced to 82.54% owing to fast occurrence of side reactions (eqn (1)–(3)). So the optimal current is 400 mA using as Ce0.90Cu0.10O2/CF composite as cathode during the degradation of CIP.
The results obtained with Pt as anode and Ce0.85Ni0.15O2/CF as cathode are depicted in Fig. 10d. The CIP degradation efficiency increases from 79.54% to 95.9% after 1 h when the applied current increases from 100 to 400 mA. The results show that the higher the applied current, the higher the decay in CIP concentration. This is because in addition to higher electrochemical production of H2O2 and Fe2+ catalyst regeneration, as well as the circle of Ce4+/Ce3+ which leads to produce a large number of ˙OH. And it further brings about the formation of H2O2 from O2 reduction. However, the degradation efficiency decreases to 95.90% under the applied current of 500 mA owing to side reactions occurrence (eqn (1)–(3)).
Overall, the optimal current is 400 mA during the degradation of CIP for different electrodes. Due to the electrocatalysis of Ce0.75Zr0.25O2 composite, Ce0.90Cu0.10O2 composite and Ce0.85Ni0.15O2 composite, the CIP degradation efficiency by using CF as cathode is lower than that of Ce0.75Zr0.25O2/CF composite, Ce0.90Cu0.10O2/CF composite and Ce0.85Ni0.15O2/CF composite as cathode, respectively. And the degradation efficiency of Ce0.75Zr0.25O2/CF composite as cathode is higher than that of Ce0.85Ni0.15O2/CF composite and Ce0.90Cu0.10O2/CF composite as cathodes. This is because Ce0.75Zr0.25O2 composites have larger specific surface area, that is to say, it has a more catalytic active sites, than Ce0.90Cu0.10O2 composite and Ce0.85Ni0.15O2 composite which results in producing a small amount of oxygen vacancies.
To compare specific surface area and pore volume of Ce0.75Zr0.25O2 and Ce0.90Cu0.10O2 and Ce0.85Ni0.15O2 nanoparticles, the N2 adsorption–desorption was performed. As shown in Fig. S3a,† bimodal pore size distribution was found in Ce0.75Zr0.25O2 material with average pore diameters of ∼34 nm which was larger than that of Ce0.90Cu0.10O2 and Ce0.85Ni0.15O2 materials (Fig. S3b†). In addition, the obtained pore volumes for Ce0.75Zr0.25O2 and Ce0.90Cu0.10O2 and Ce0.85Ni0.15O2 materials are ∼0.15 and 0.079 and 0.13 cm3 g−1, respectively (Table S1†). It was found that the Ce0.75Zr0.25O2 material exhibits a higher BET surface area compared to that of Ce0.90Cu0.10O2 and Ce0.85Ni0.15O2 materials (Table S1†). Overall, this observation indicates Ce0.75Zr0.25O2 nanoparticles had lager specific surface area and pore volume than Ce0.90Cu0.10O2 and Ce0.85Ni0.15O2 nanoparticles which caused more flexible response to the active site so that producing more oxygen vacancies. And further it could produce a larger number of H2O2 by oxygen reduction which contributed to the degradation of CIP.
3.3 Comparison of degradation and mineralization efficiency of CIP aqueous solution
It is crucial to completely remove organic pollutants from wastewater. The EF process can degrade and mineralize the organic matter in aqueous solution and further achieve high CIP degradation and TOC removal efficiency. Furthermore, the degradation efficiency and mineralization degree of this technology depend on several parameters, one of the most crucial is the nature of the cathode material used.The degradation of CIP solution was carried out by using different modified cathodes (Ce0.75Zr0.25O2/CF, Ce0.90Cu0.10O2/CF, Ce0.85Ni0.15O2/CF) at 400 mA and pH = 3. Fig. 11a showed that the CIP solution degradation efficiency of 2.0 wt% Ce0.75Zr0.25O2/CF reached about 100% after 1 h. The degradation efficiency of 2.5 wt% Ce0.90Cu0.10O2/CF was much higher than that of CF before electrolysis of 2 h and even its electrolytic efficiency reached 93.07% after 1 h. But the degradation efficiency of Ce0.90Cu0.10O2/CF and CF was about the same after 5 h. And the CIP solution degradation efficiency of 0.45 wt% Ce0.85Ni0.15O2/CF attained 95.9% and 98.45% after 1 and 3 h, respectively. Further comparison of 2.0 wt% Ce0.75Zr0.25O2/CF, 2.5 wt% Ce0.90Cu0.10O2/CF and 0.45 wt% Ce0.85Ni0.15O2/CF showed that 2.0 wt% Ce0.75Zr0.25O2/CF was the outstanding one. Although Ce0.90Cu0.10O2/CF has a greater electrical conductivity than Ce0.75Zr0.25O2/CF and Ce0.85Ni0.15O2/CF, Ce0.75Zr0.25O2 nanoparticles had lager specific surface area and pore volume than Ce0.90Cu0.10O2 and Ce0.85Ni0.15O2 nanoparticles (Table S1†) which resulted in having more catalytic activity sites to contribute to the entry of oxygen to obtain a higher concentration of hydrogen peroxide (Fig. S4†).
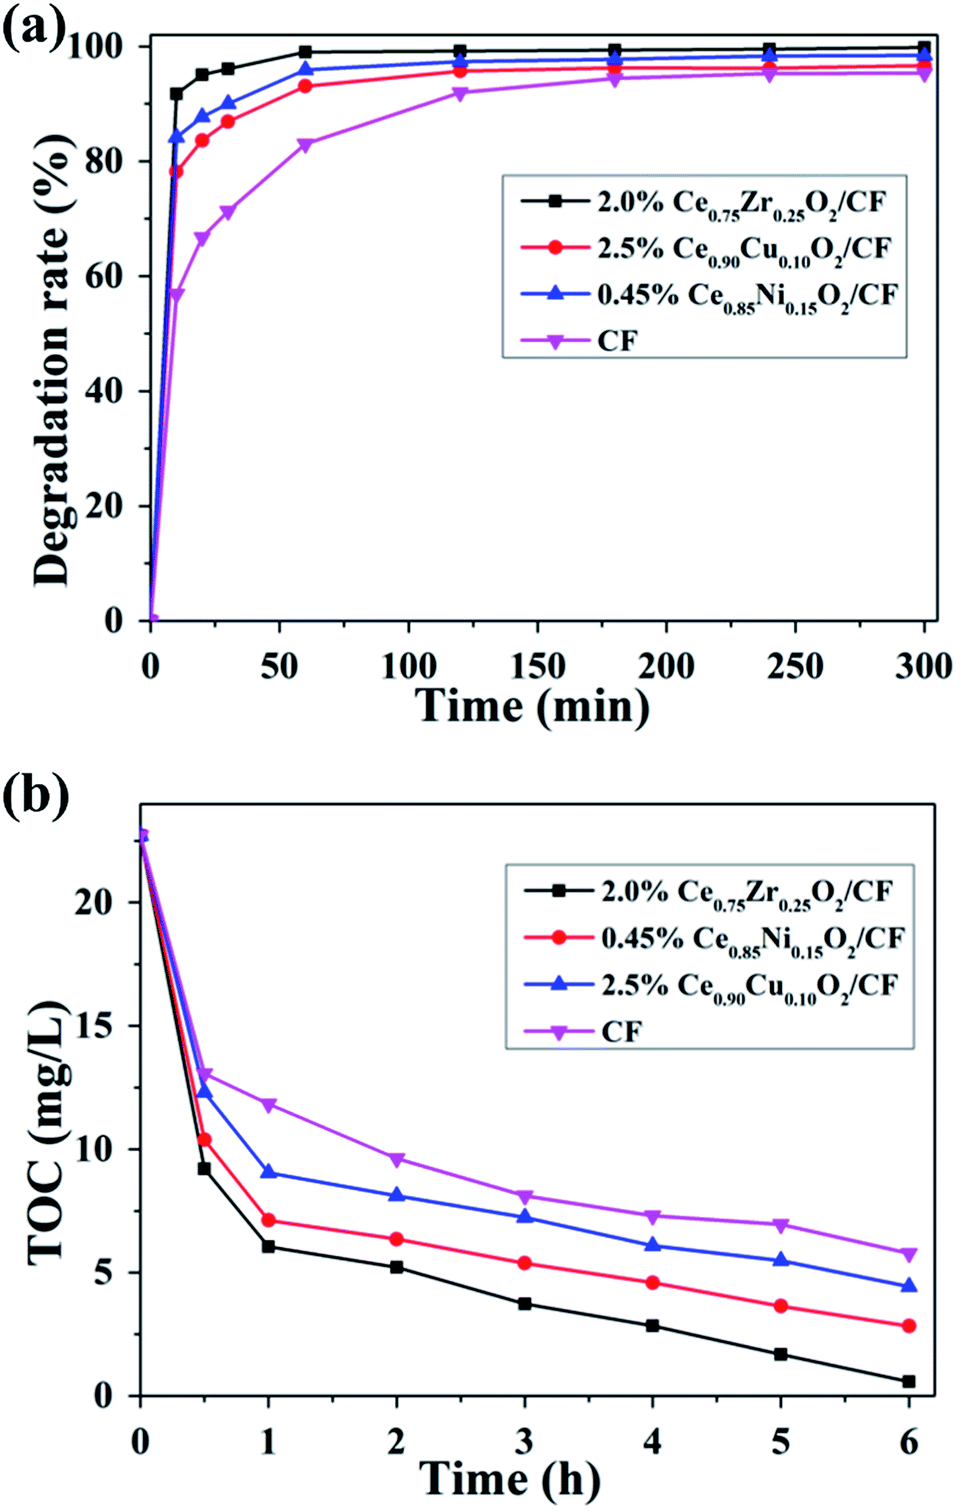 | ||
| Fig. 11 Effect of CexA1−xO2/CF (A = Zr, Cu and Ni) cathode on the degradation rate (a) and the extent of TOC removal (b) of CIP aqueous solution at pH = 3, 400 mA, 0.1 mmol L−1 Fe2+ and 0.05 mol L−1 Na2SO4 solution. | ||
As it could be seen in Fig. 11b, the mineralization of CIP was improved by CexA1−xO2 (A = Zr, Cu and Ni) loading on CF. When Ce0.75Zr0.25O2/CF was used as cathode in EF process, there was a maximum value of the TOC removal. Because Ce0.75Zr0.25O2 nanoparticles had larger specific surface area (Table S1†) which led to having fast mass and electron transport rate. Ce0.75Zr0.25O2/CF composite had more catalytic activity sites than that of Ce0.90Cu0.10O2/CF composite and Ce0.85Ni0.15O2/CF composite. And Ce0.75Zr0.25O2/CF composite had more oxygen vacancies which resulted in the formation of H2O2 with higher concentration (Fig. S4†). From Fig. 11, the mineralization degree of CIP aqueous solution by using Ce0.75Zr0.25O2/CF during electro-Fenton system was 97.45% after 6 h owing to synergistic effects from the predominant role of homogeneous ˙OH and the Fenton-like reaction of Ce3+ and H2O2 producing heterogeneous ˙OH and the electrocatalytic activity of CexA1−xO2 (A = Zr, Cu and Ni) composites and strong adsorption property of CF. It could be also found that removal rate of TOC was fast during the early treatment time, but it became slowly with the increase of time. The decrease of the mineralization rate was related to the formation of the precipitation of soluble iron species52 and the consumption of ˙OH.53
It is well-known that the concentration of H2O2 is a very important parameter during CIP degradation in electro-Fenton process. Herein, the concentration of H2O2 is investigated by potassium iodide spectrophotometry (λ = 352 nm, εmax = 26400 M−1 cm−1). After applying current, the reduction reactions of Fe3+/Fe2+ and Ce4+/Ce3+ rapidly happen and more oxygen vacancies will be produced. And the Pt anode allows to generate supplementary hydroxyl radical from the oxidation of water on its surface.54,55
It can be seen that the H2O2 concentration sharply increases for the first 10 min from Fig. S4,† which is consistent with the results of Fig. 11. From Fig. 11, the CIP degradation efficiency and the mineralization degree also increase rapidly at this time. After 10 min, the H2O2 concentration decreases gradually, but it still remains the effective values and the degradation rate still increases at this time. This maybe because a large number of CIP intermediates adsorbed on the surface of CexA1−xO2 and iron deposits and Fe(III)-carboxylate products adsorbed on CF which causes the decrease of the production of oxygen vacancy and the poor electrical conductivity. It can be also found that the concentration of H2O2 is lower for CexA1−xO2/CF (A = Zr, Cu and Ni) as cathodes than that of CF. Because the strong electro-catalysis of CexA1−xO2 and a Fenton-like reaction of Ce3+ and H2O2 can consume a large amount of hydrogen peroxide. We can find the amount of H2O2 produced by Ce0.75Zr0.25O2/CF as cathode is similar to that of CF as cathode at 5 h which indicates the catalytic action of CexA1−xO2 composites plays a very important role in addition to the production of hydroxyl radicals. The production of H2O2 of Ce0.90Cu0.10O2/CF and Ce0.85Ni0.15O2/CF as cathodes is lower than that of Ce0.75Zr0.25O2/CF as cathode owing to the smaller specific surface area and pore volume of Ce0.90Cu0.10O2 and Ce0.85Ni0.15O2 nanoparticles (Table S1†) leading to producing small amount of H2O2. Above all, Ce0.75Zr0.25O2/CF electrode has a higher adsorption oxygen content than the other materials which can be mainly attributed to the formation of oxygen vacancies (Table 1).
3.4 Degradation mechanism of CIP
Samples withdrawn after 1 h in 0.05 mol L−1 Na2SO4 with 0.1 mmol L−1 Fe2+ at pH 3.0 using a Pt/Ce0.75Zr0.25O2/CF cell at 400 mA are analyzed by HPLC-MS. Apart from CIP, it can also be found that the name, molecular structure and m/z values of seven intermediates from Table S2.† These compounds are formed via hydroxylation, defluorination, cleavage of C–N bonds, deamination and breaking of the dihydroquinoline moiety. Since hydroxyl radicals are the main oxidizing agents in all the EAOPs tested, one can also expect the generation of the same intermediates in Pt/Ce0.90Cu0.10O2/CF, Pt/Ce0.85Ni0.15O2/CF and Pt/CF cells. However, the intermediate of m/z (201) only can be found in the Pt/Ce0.75Zr0.25O2/CF cell.Based on the products of Table S2† and literatures of the degradation mechanism of CIP,56,57 a possible degradation path of CIP is proposed. As shown in Fig. 12, the path is initiated by the oxidation of CIP to generate either A via defluorination with hydroxylation or D by cleavage of two C–N bonds of the piperazinyl group. Further the hydroxylation of A yields B, whereas D produces E by the deamination. The cleavage of two C–N bonds of the piperazinyl group of B leads to producing C, nevertheless, F further is formed via the loss of the acetylene group of E. The loss of the lateral groups of compound F along with the breaking of the dihydroquinoline moiety yields G. C and G are further oxidized by ˙OH to form short chain carboxylates which can ultimately produce CO2, H2O and inorganic ions owing to strong oxidizing property of ˙OH.
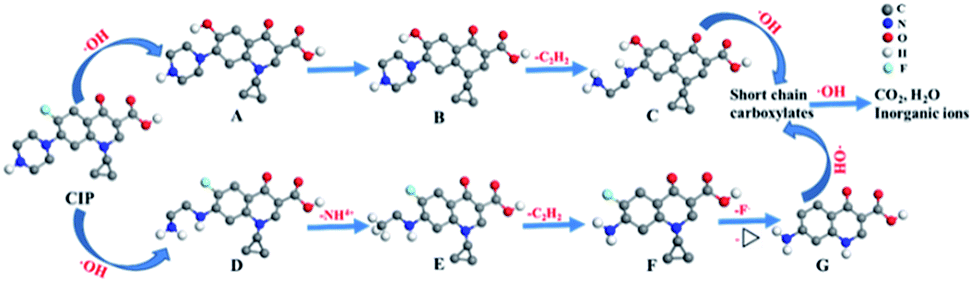 | ||
| Fig. 12 Proposed degradation pathways for CIP. | ||
3.5 Stability of Ce0.75Zr0.25O2/CF cathode
Because the reuse performance of modified cathode is vital for industrial application, the stability of Ce0.75Zr0.25O2/CF cathode is tested 5 times after 60 min. As shown in Fig. 13, the degradation efficiency of CIP is almost stable in all 5 runs. The CIP removal kept all above 97% except the third time with a slight decrease with a value of 96.80% at 60 min. According to the publication,58–60 the standard deviation (SD) can also evaluate the repeatability or stability of different cathode materials. By calculating, we can see its value is between 0.12% and 1.6%. These results imply that the stability of cathodic material ensures good quality of waste water treatment after five runs in the electro-Fenton system at the experiment condition of 400 mA, pH = 3, 0.1 mmol L−1 Fe2+ and 0.05 mol L−1 Na2SO4 solution. That is to say, the Ce0.75Zr0.25O2/CF cathode material has high stability and is suit to application in electro-Fenton system.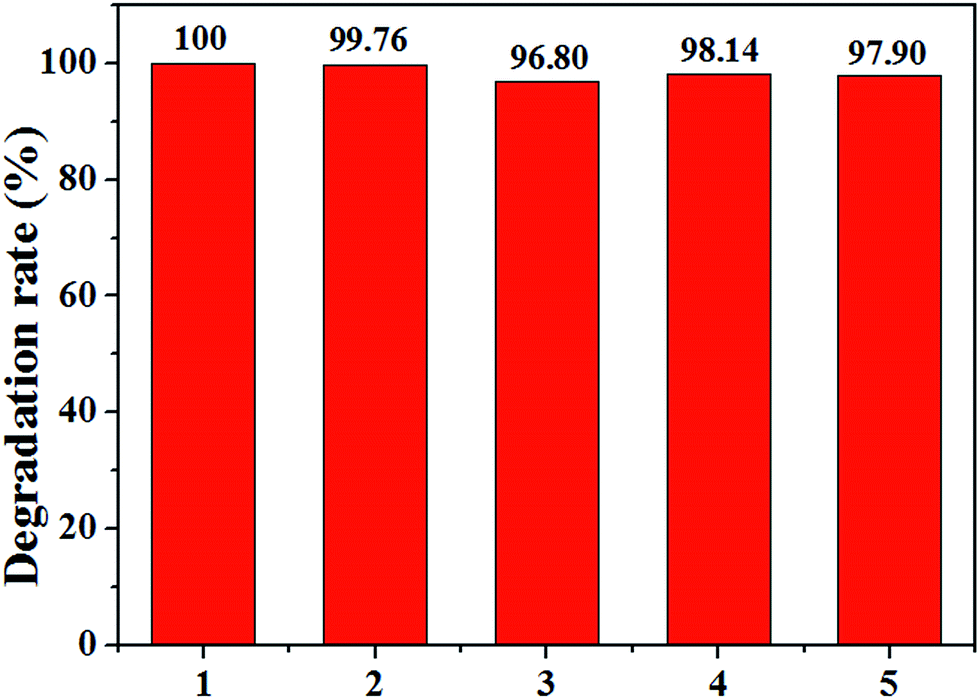 | ||
| Fig. 13 The stability test of Ce0.75Zr0.25O2/CF cathode in 5 times continuous runs in EF system at the experiment condition of 400 mA, pH = 3, 0.1 mmol L−1 Fe2+ and 0.05 mol L−1 Na2SO4 solution. | ||
4 Conclusions
CexA1−xO2/CF (A = Zr, Cu and Ni) composites were prepared successfully by impregnating CF into CexA1−xO2 solid solution and then dried and calcined. Four different cathode materials (Ce0.75Zr0.25O2/CF, Ce0.90Cu0.10O2/CF, Ce0.85Ni0.15O2/CF and CF) have been investigated for the degradation of CIP. About 100% degradation efficiency at 1 h and 97.45% mineralization efficiency (in terms of TOC removal) at 6 h were obtained with a Ce0.75Zr0.25O2/CF cathode owing to synergistic effects from the predominant role of the Fenton reaction of Fe2+ and H2O2 forming homogeneous ˙OH and the Fenton-like reaction of Ce3+ and H2O2 producing heterogeneous ˙OH and the electrocatalytic activity of Ce0.75Zr0.25O2 composite and the strong electrosorption of carbon felt. Eight intermediates were detected via HPLC-MS analysis. Based on them, a possible path of CIP degradation was proposed in the paper.Acknowledgements
This work was supported by the National Natural Science Foundation of China (Grant No. 21377061), Independent Innovation fund of Tianjin University (Grant No. 2015XRG-0020 and 2016XJ-0006), National Science and Technology Major Project of the Ministry of Science and Technology of China (Grant No. 2016ZX05058-003-004), Natural Science Foundation of Tianjin (Grant No. 15JCYBJC48400, 15JCZDJC41200 and 16YFZCSF00300) and by Innovation and Entrepreneurship Training Program of Tianjin for College Students (Grant No. 201610056239).Notes and references
- C. H. Huang, J. E. Renew, K. L. Smeby, K. Pinkston and D. L. Sedlak, Water Res., 2001, 120, 30–40 Search PubMed.
- G. Hamscher, S. Sczesny, H. Hoper and H. Nau, Anal. Chem., 2002, 74, 1509–1518 CrossRef CAS PubMed.
- J. L. Martinez, Environ. Pollut., 2009, 157, 2893–2902 CrossRef CAS PubMed.
- D. G. J. Larsson, C. de Pedro and N. Paxeus, J. Hazard. Mater., 2007, 148, 751–755 CrossRef CAS PubMed.
- L. Zhang, J. Tu, L. Lai and C. Hu, Appl. Catal., B, 2016, 181, 561–569 CrossRef CAS.
- K. Kümmerer, A. Al-Ahmad and V. Mersch-Sundermann, Chemosphere, 2000, 40, 701–710 CrossRef.
- T. An, H. Yang, G. Li, W. Song, W. J. Cooper and X. Nie, Appl. Catal., B, 2010, 94, 288–294 CrossRef CAS.
- A. Benito, A. Penadés, J. L. Lliberia and R. Gonzalez-Olmos, Chemosphere, 2017, 166, 230–237 CrossRef CAS PubMed.
- S. W. D. Silva, C. R. Klauck, M. A. Siqueira and A. M. Bernardes, J. Hazard. Mater., 2015, 282, 241–248 CrossRef PubMed.
- F. C. Moreira, A. R. B. Rui, E. Brillas and V. J. P. Vilar, Appl. Catal., B, 2016, 202, 217–261 CrossRef.
- S. Giannakis, M. Voumard, D. Grandjean, A. Magnet, L. F. De Alencastro and C. Pulgarin, Water Res., 2016, 2, 505–515 CrossRef PubMed.
- E. J. Ruiz, C. Arias, E. Brillas, A. Hernandez-Ramirez and J. M. Peralta-Hernandez, Chemosphere, 2011, 82, 495–501 CrossRef CAS PubMed.
- J. Tian, J. Zhao, A. M. Olajuyin, M. M. Sharshar and T. Mu, Environ. Sci. Pollut. Res., 2016, 23, 1–12 CrossRef PubMed.
- I. Sirés, E. Brillas, M. A. Oturan, M. A. Rodrigo and M. Panizza, Environ. Sci. Pollut. Res., 2014, 21, 8336–8367 CrossRef PubMed.
- N. Oturan, E. D. van Hullebusch, H. Zhang, L. Mazeas, H. Budzinski, K. Le Menach and M. A. Oturan, Environ. Sci. Technol., 2014, 44, 2577–2641 CrossRef.
- F. Sopaj, N. Oturan, J. Pinson, F. Podvorica and M. A. Oturan, Appl. Catal., B, 2016, 199, 331–341 CrossRef CAS.
- S. Shukla and M. A. Oturan, Environ. Chem. Lett., 2015, 13, 157–172 CrossRef CAS.
- E. Brillas, I. Sires and M. A. Oturan, Chem. Rev., 2009, 109, 6570–6631 CrossRef CAS PubMed.
- Y. Wang, G. Zhao, S. Chai, H. Zhao and Y. Wang, ACS Appl. Mater. Interfaces, 2012, 5, 842–852 Search PubMed.
- S. T. Khankhasaeva, D. V. Dambueva, E. T. Dashinamzhilova, A. Gil, M. A. Vicente and M. N. Timofeeva, J. Hazard. Mater., 2015, 293, 21–29 CrossRef CAS PubMed.
- T. Liu, K. Wang, S. Song, A. Brouzgou, P. Tsiakaras and Y. Wang, Electrochim. Acta, 2016, 194, 228–238 CrossRef CAS.
- W. R. P. Barros, J. R. Steter, M. R. V. Lanza and A. C. Tavares, Appl. Catal., B, 2015, 180, 434–441 CrossRef.
- N. Oturan, J. Wu, H. Zhang, V. K. Sharma and M. A. Oturan, Appl. Catal., B, 2013, 140, 92–97 CrossRef.
- Y. Wang, Y. Liu, T. Liu, S. Song, X. Gui, H. Liu and P. Tsiakaras, Appl. Catal., B, 2014, 156, 1–7 CrossRef.
- T. X. H. Le, M. Bechelany, S. Lacour, N. Oturan, M. A. Oturan and M. Cretin, Carbon, 2015, 94, 1003–1011 CrossRef CAS.
- W. H. Wang, X. D. Wang, W. H. Wang and X. D. Wang, Electrochim. Acta, 2007, 52, 6755–6762 CrossRef CAS.
- S. Ding, F. Liu, X. Shi and H. He, Appl. Catal., B, 2016, 180, 766–774 CrossRef CAS.
- Q. Wang, Y. Li, B. Liu, Q. Dong, G. Xu, L. Zhang and J. Zhang, J. Mater. Chem. A, 2015, 3, 139–147 CAS.
- M. Jing, X. Zhang, X. Fan, L. Zhao, J. Liu and C. Yan, Electrochim. Acta, 2016, 215, 57–65 CrossRef CAS.
- J. Tian, J. Zhao, A. M. Olajuyin, M. M. Sharshar, T. Mu, M. Yang and J. Xing, Environ. Sci. Pollut. Res., 2016, 23, 15471–15482 CrossRef CAS PubMed.
- K. V. Plakas, S. D. Sklari, D. A. Yiankakis, G. T. Sideropoulos, V. T. Zaspalis and A. J. Karabelas, Water Res., 2016, 91, 183–194 CrossRef CAS PubMed.
- M. Sun, X. R. Ru and L. F. Zhai, Appl. Catal., B, 2015, 165, 103–110 CrossRef CAS.
- H. Zhou, Y. Shen, J. Xi, X. Qiu and L. Chen, ACS Appl. Mater. Interfaces, 2016, 8, 15369–15378 CAS.
- C. Pham-Huu, R. Vieira, B. Louis, A. Carvalho, J. Amadou, T. Dintzer and M. J. Ledoux, J. Catal., 2006, 240, 194–202 CrossRef CAS.
- A. L. Chen, Y. Zhou, N. Ta, Y. Li and W. J. Shen, Catal. Sci. Technol., 2015, 5, 4184–4192 CAS.
- Y. Li, Y. N. Li, B. R. Xie, J. J. Han, S. H. Zhan and Y. Tian, Environ. Sci.: Nano, 2017, 4, 425–436 RSC.
- L. Wang, H. Liu, Y. Liu, Y. Chen and S. Yang, J. Rare Earths, 2013, 31, 559–564 CrossRef CAS.
- L. Yue, W. Li, F. Sun, L. Zhao and L. Xing, Carbon, 2010, 48, 3079–3090 CrossRef CAS.
- L. Tu, S. C. Chang and J. F. Peng, Thin Solid Films, 2010, 518, 5488–5493 CrossRef.
- Y. W. Zhang, R. Si, C. S. Liao and C. H. Yan, J. Phys. Chem. B, 2003, 107, 10159–10167 CrossRef CAS.
- L. Qi, Q. Yu, Y. Dai, C. J. Tang, L. J. Liu, H. L. Zhang, F. Gao, L. Dong and Y. Chen, Appl. Catal., B, 2012, 119, 308–320 CrossRef.
- P. V. R. Rao, V. P. Kumar, G. S. Rao and K. V. R. Chary, Catal. Sci. Technol., 2012, 2, 1665–1673 CAS.
- S. Mahammadunnisa, P. M. K. Reddy, N. Lingaiah and C. Subrahmanyam, Catal. Sci. Technol., 2012, 3, 730–736 Search PubMed.
- M. M. Antunes, S. Lima, P. Neves, A. L. Magalhães, E. Fazio, F. Neri, M. T. Pereira, A. F. Silva, C. M. Silva, S. M. Rocha, M. Pillinger, A. Urakawa and A. A. Valente, Appl. Catal., B, 2016, 182, 485–503 CrossRef CAS.
- G. Zhou, H. Lan, T. Gao and H. Xie, Chem. Eng. J., 2014, 246, 53–63 CrossRef CAS.
- D. Srinivas, C. V. V. Satyanarayana, H. S. Potdar and P. Ratnasamy, Appl. Catal., A, 2003, 246, 323–334 CrossRef CAS.
- F. Sopaj, N. Oturan, J. Pinson, F. Podvorica and M. A. Oturan, Appl. Catal., B, 2016, 199, 331–341 CrossRef CAS.
- D. M. de Araujo, C. Saez, C. A. Martinez-Huitle, P. Canizares and M. A. Rodrigo, Appl. Catal., B, 2015, 166, 454–459 CrossRef.
- Y. M. Liu, S. Chen, X. Quan, H. T. Yu, H. M. Zhao and Y. B. Zhang, Environ. Sci. Technol., 2015, 49, 13528–13533 CrossRef CAS PubMed.
- E. Brillas, I. Sirés and M. A. Oturan, Chem. Rev., 2009, 109, 6570–6631 CrossRef CAS PubMed.
- A. Özcan, Y. Sahin, A. S. Koparal and M. A. Oturan, J. Electroanal. Chem., 2008, 616, 71–78 CrossRef.
- S. Ammar, M. A. Oturan, L. Labiadh, A. Guersalli, R. Abdelhedi, N. Oturan and E. Brillas, Water Res., 2015, 74, 77–87 CrossRef CAS PubMed.
- A. Khataee, A. Khataee, M. Fathinia, B. Vahid and W. J. Sang, J. Ind. Eng. Chem., 2013, 19, 1890–1894 CrossRef CAS.
- N. Barhoumi, L. Labiadh, M. A. Oturan, N. Oturan, A. Gadri, S. Ammar and E. Brillas, Chemosphere, 2015, 141, 250–257 CrossRef CAS PubMed.
- W. R. P. Barros, J. R. Steter, M. R. V. Lanza and A. C. Tavares, Appl. Catal., B, 2016, 180, 434–441 CrossRef CAS.
- V. S. Antonin, M. C. Santos, S. Garcia-Segura and E. Brillas, Water Res., 2015, 83, 31–41 CrossRef CAS PubMed.
- J. S. Ye, J. Liu, H. S. Ou and L. L. Wang, Chemosphere, 2016, 165, 311–319 CrossRef CAS PubMed.
- J. Zbiljić, O. Vajdle, V. Guzsvány, J. Molnar, J. Agbaba, B. Dalmacija and K. Kalcher, J. Hazard. Mater., 2014, 283, 292–301 CrossRef PubMed.
- N. W. Beyene, P. Kotzian, K. Schachl, H. Alemu, E. Turkusic, A. Chopra, H. Moderegger, I. Svancara, K. Vytras and K. Kalcher, Talanta, 2004, 64, 1151–1159 CrossRef CAS PubMed.
- K. Schachl, H. Alemu, K. Kalcher, J. Jezkova, I. Svancara and K. Vytras, Analyst, 1997, 122, 985–989 RSC.
Footnote |
| † Electronic supplementary information (ESI) available. See DOI: 10.1039/c7ra03302h |
| This journal is © The Royal Society of Chemistry 2017 |