
 Open Access Article
 This Open Access Article is licensed under a Creative Commons Attribution-Non Commercial 3.0 Unported Licence
(−)-Epigallocatechin-3-gallate (EGCG) inhibits fibrillation, disaggregates amyloid fibrils of α-synuclein, and protects PC12 cells against α-synuclein-induced toxicity
Juan Zhaoa,
Qingnan Liangb,
Qing Suna,
Congheng Chena,
Lihui Xua,
Yu Ding*b and
Ping Zhou *a
*a
aState Key Laboratory of Molecular Engineering of Polymers, Department of Macromolecular Science, Fudan University, Shanghai 200433, China. E-mail: pingzhou@fudan.edu.cn; Fax: +86-21-55664038; Tel: +86-21-55664038
bDepartment of Physiology and Biophysics, School of Life Sciences, Fudan University, Shanghai 200438, China. E-mail: yuding@fudan.edu.cn; Fax: +86-21-51630545; Tel: +86-21-51630545
First published on 26th June 2017
Abstract
α-Synuclein (α-Syn) aggregates are the major component of Lewy bodies (LB), which is a pathological hallmark in the brain tissue of Parkinson's disease (PD) patients. It has been reported that (−)-epigallocatechin-3-gallate (EGCG) is biologically able to penetrate the blood–brain barrier and inhibit the fibrillation of amyloid proteins. This study aimed to provide insight into the possible mechanism of EGCG as a potential candidate agent for the prevention and treatment of PD on the basis of the interaction between α-Syn and EGCG. In the present study, the effects of EGCG on the fibrillation and disaggregation of α-Syn were investigated by thioflavin T (ThT) fluorescence spectroscopy, circular dichroism spectroscopy (CD), nuclear magnetic resonance (NMR) spectroscopy, atomic force microscopy (AFM) and transmission electron microscopy (TEM) on a molecular level. In addition, on the cellular level, we investigated the protective effects of EGCG on α-Syn-induced cell death in the transduced PC12 cells which overexpressed α-Syn, using the techniques of 3-(4,5-dimethylthiazol-2-yl)-2,5-diphenyltetrazolium bromide (MTT) assay, 2,7-dichlorodihydrofluorescein diacetate (DCFH-DA) assay, western blot and confocal laser scanning microscopy. It was found that EGCG not only significantly inhibited the conformational transition of α-Syn from random coil to β-sheet conformers through binding to Ile, Phe and Tyr amino residues, but also disaggregated the amyloid fibrils of α-Syn in a dose-dependent manner, through binding to Leu, His, Phe and Tyr amino residues. It is also demonstrated that EGCG can protect PC12 cells against α-Syn-induced damage by inhibiting the overexpression and fibrillation of α-Syn in the cells.
1 Introduction
Parkinson's disease (PD), one of the most prevalent neurodegenerative diseases, is a degenerative situation leading to basal ganglia atrophy and disorders in motorial, cognitive and affective domains,1 which readily occurs in people over the age of 60,2 and causes great discomfort for the afflicted elderly and strain for attending family and caregivers. The exploration of an effective target and treatment for the neurodegenerative progression in PD remains challenging. The accumulation of the synaptic protein of α-synuclein (α-Syn) in Lewy bodies (LB),3 and neurites of the nervous system in the form of amyloid fibrils4 are the characteristics of neuropathology in PD. α-Syn, the causative gene firstly identified in familial PD,5 is a soluble and unfolded protein under normal physiological conditions with a molecular weight of 14.46 kDa.6 Fig. 1 shows the amino acid sequence alignment of human α-Syn. Although the function of α-Syn is not well understood, studies suggest that α-Syn is essential for healthy development of the cognitive functions.7 However, the factors including the overexpression of α-Syn,8 which are associated with an increased rate of neuronal cell death, and the aggregation of α-Syn from monomers into amyloid fibrils via oligomeric intermediates9 are considered to play a vital role in the development of PD, by triggering neuronal damage.10 Therefore, hindering the overexpression and aberrant fibrillation of α-Syn for preventing α-Syn-induced neurotoxicity is regarded as promising therapeutic strategies against PD.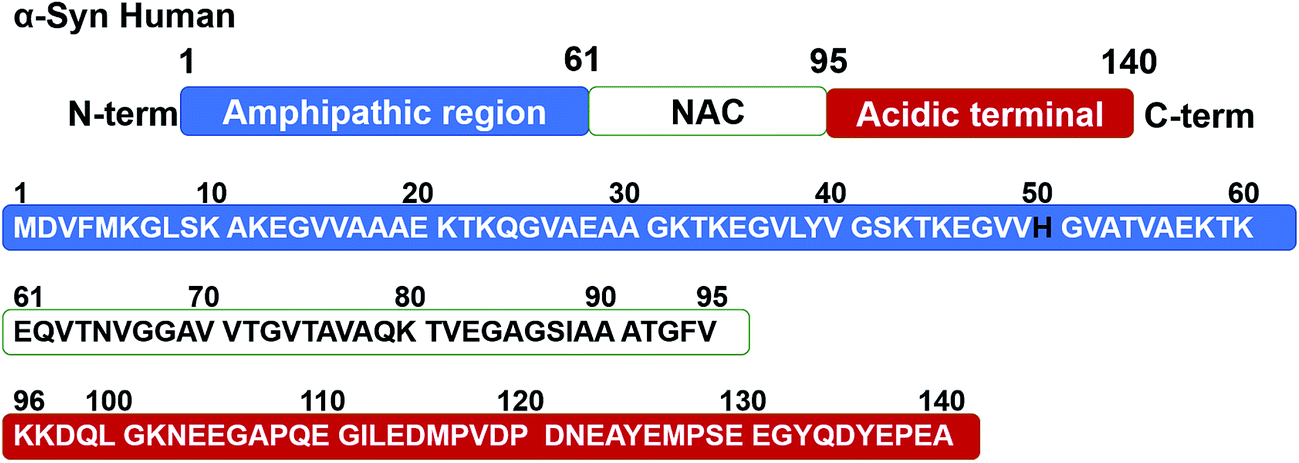 | ||
| Fig. 1 Amino acid sequence alignment of human α-Syn. N-terminal, NAC and C-terminal regions identical in the sequence are indicated in the upper panel, respectively. | ||
Experimental evidence showed that amyloid fibrillation can be modulated using molecular chaperones such as Hsp40, Hsp70,11 Hsp104 (ref. 12) and TRiC,13 and small natural compounds including polyaromatic dyes and antioxidants. The dyes of interest are Congo red,14 methylene blue,15 curcumin,16 orcein and its derivatives.17 However, the toxicity and poor water-solubility limit their therapeutic application.18 The antioxidants are mainly polycyclic polyphenols, such as resveratrol,19 dopamine20 and catechins.21 (−)-Epigallocatechin-3-gallate (EGCG, Fig. 2) extracted from green tea is the most abundant and efficient component among catechins from the tea plant Camilla sinensis.22 Studies in vitro show that EGCG can interact with proteins, such as germ line λ VI,23 Aβ24 and islet amyloid polypeptide (IAPP),25 which involve the light chain amyloidosis (AL), Alzheimer's disease (AD) and type 2 diabetes (T2D), respectively, to inhibit the peptide conformation transition from random coil to β-sheet, prevent the amyloidogenesis, and protect nerves.26 Besides, EGCG is also able to disassemble the preformed β-sheet-rich aggregates as well as earlier intermediates of fibrillogenesis.27
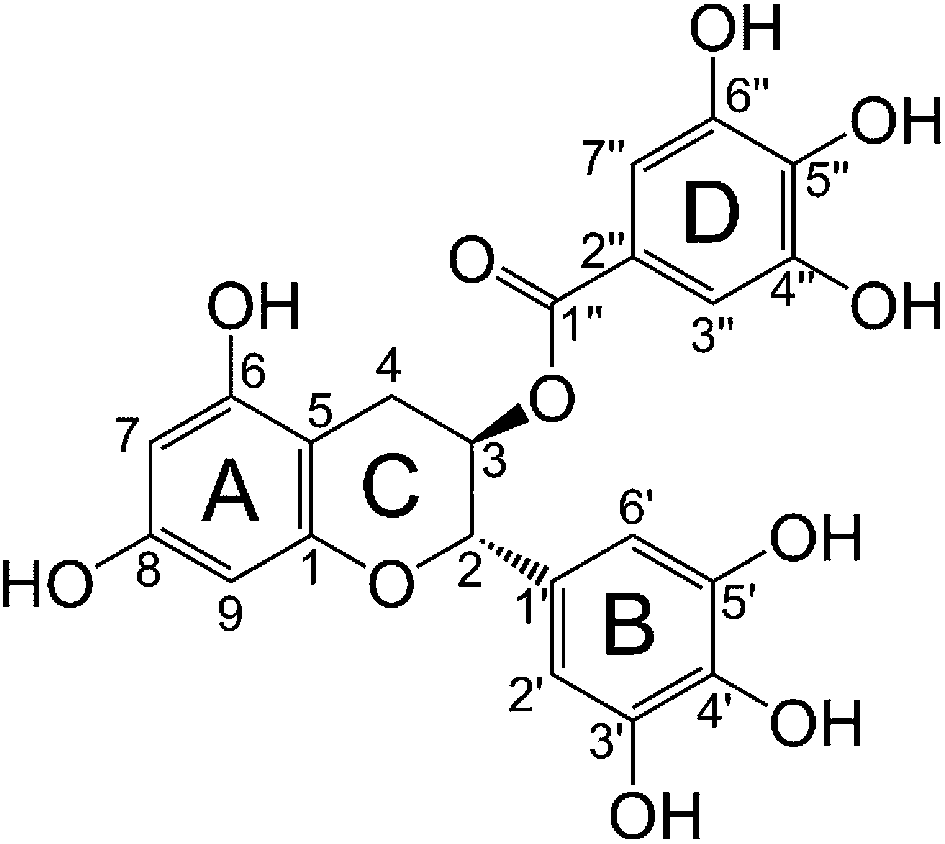 | ||
| Fig. 2 Molecular structure of EGCG. | ||
As above, although EGCG has been demonstrated probably beneficial for PD treatment, systematically revealing the mechanism of EGCG inhibiting the fibrillation, disaggregating the mature fibrils, and protecting the cells against α-Syn-induced toxicity is still not well carried out. In this study, we investigated in detail the function, mechanism, efficacy and safety of EGCG in inhibiting the fibrillation and reversing the secondary structure of mature amyloid fibrils from the ordered β-sheet into unfolded protein for maintaining and even recovering the cell activity, by using chemical, biochemical as well as cell-based methods including ThT fluorescence, NMR, microscopy and MTT, etc., with the employment of α-Syn transduced PC12 cells, in an attempt to understand the theoretic basis of the function and potential application of EGCG in the medicine and healthcare.
2 Results
2.1 Inhibition and disaggregation of α-Syn fibrillation by EGCG
To investigate the inhibition of α-Syn fibrillation by EGCG, ThT fluorescence was used to detect the kinetic of fibrillation. ThT can bind to the groove of β-sheet protein chain parallel to the fibril axis,28 which fixes the rotation around C–C bond in ThT molecule,29 and thereby results in the increase of ThT fluorescence. Here, ThT fluorescence was measured in 50 μM α-Syn solution incubated with 0, 5, 10, 20, 50, 100 and 200 μM EGCG, respectively (Fig. 3A). In the absence of EGCG, ThT fluorescence was increased over the time in a sigmoidal pattern. The formation kinetics of fibrils shows three phases in Fig. 3A, including (i) lag phase, the formation of β-sheet nucleus or seeds during the first 8 h of incubation, (ii) exponential phase, the logarithmic increase of β-sheet content during 8–19 h, and (iii) equilibrium phase, the saturation of β-sheet content. The results indicate that the fibrillation kinetics of α-Syn is similar to that of amyloid-like proteins, which undergoes a typical nucleation-dependent mechanism. However, the addition of EGCG inhibited the fibrillation of α-Syn as ThT fluorescence intensity increased slower over the time in a dose-dependent manner than that without EGCG, indicating an inhibitory effect of EGCG on α-Syn fibril formation. When the concentration of EGCG reached 200 μM, the conformation transition of α-Syn was completely inhibited. We also used CD to detect the α-Syn secondary structure in the nucleation period (Fig. 3C). At initial state, the spectrum of untreated α-Syn displayed a random coil conformation with a highly negative ellipticity at 197 nm. As incubation time went on, the negative ellipticity at 197 nm was reduced, indicating the decrease of random coil conformers. When EGCG were added to α-Syn, the negative ellipticity at 197 nm was reduced, indicating that the conformational transition of α-Syn was inhibited by EGCG (Fig. 3D).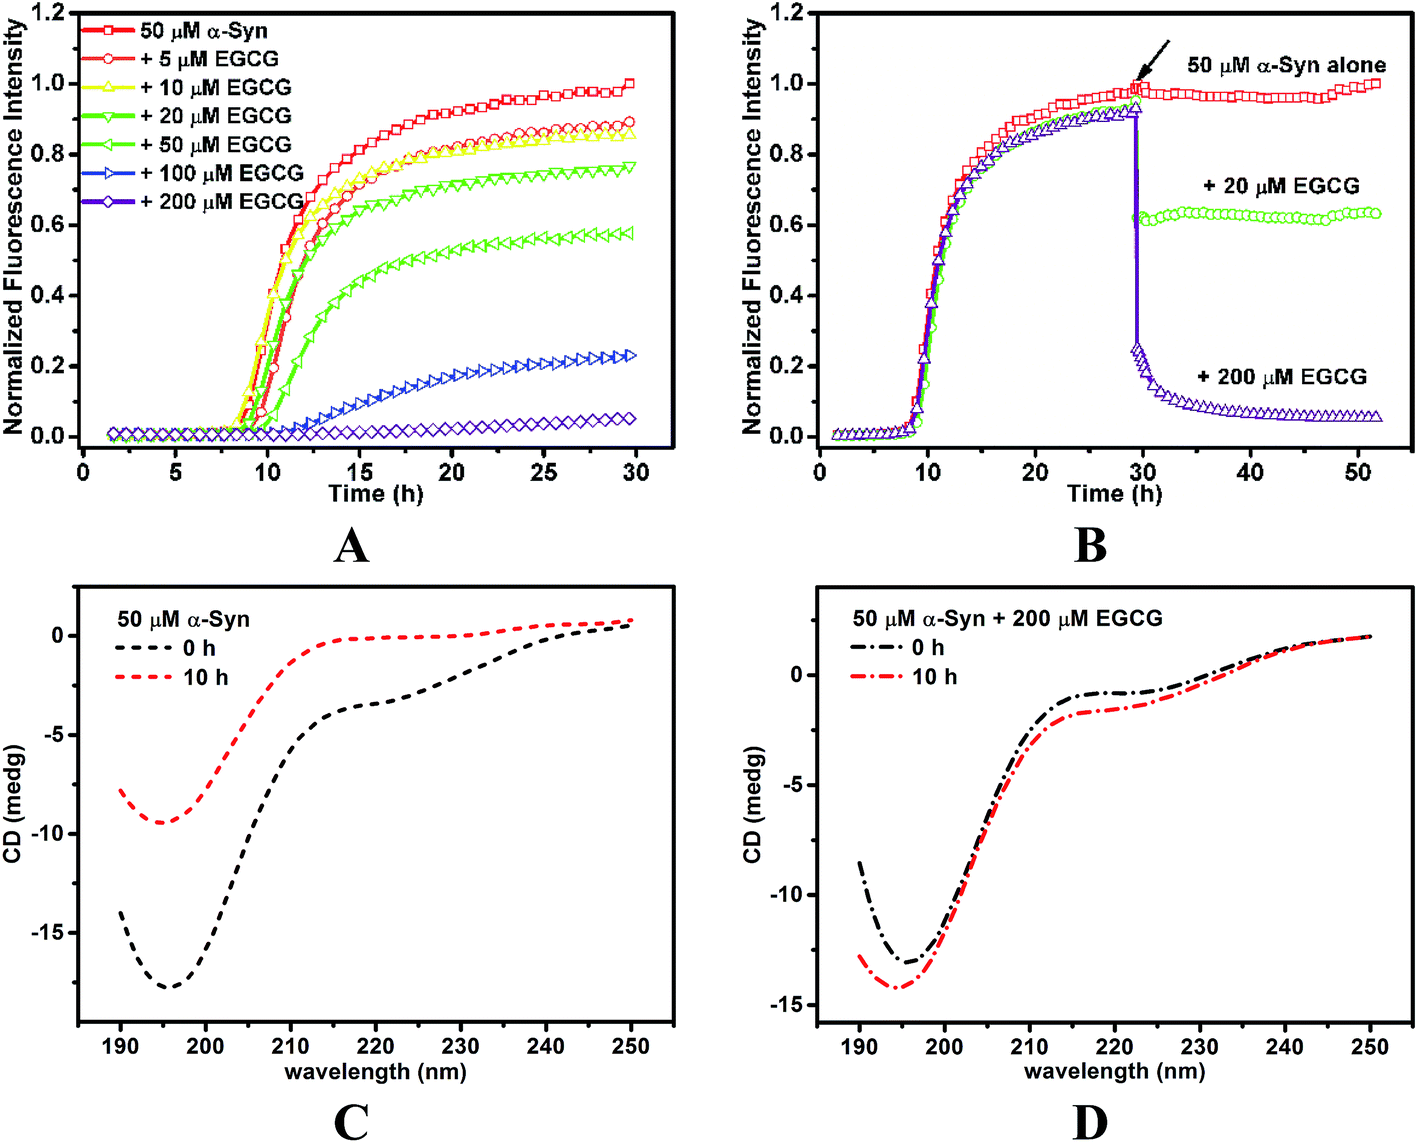 | ||
| Fig. 3 EGCG inhibited and disaggregated α-Syn fibrillation in vitro. (A) Fibrillation kinetics of 50 μM α-Syn in the absence or presence of 5, 10, 20, 50, 100 and 200 μM EGCG monitoring by ThT fluorescence. (B) Fibrillation kinetics of 50 μM α-Syn incubated alone for 30 h, and the addition of 20 μM EGCG and 200 μM EGCG afterward (indicated by arrow) monitoring by ThT fluorescence. CD spectra of 50 μM α-Syn incubated in the absence (C) or presence of (D) 40 μM EGCG for 0 h (black dash line), 10 h (red dash line). | ||
Furthermore, we investigated the disaggregation of the mature amyloid fibril in the presence of EGCG. When the fibrils of α-Syn reached saturation, EGCG was added to the sample. It was found that ThT fluorescence intensity declined with the addition of EGCG (Fig. 3B), which indicates that β-sheet content decreased, and even dropped to the original content in α-Syn solution in the presence of 200 μM EGCG. The results suggest that EGCG reverses the mature α-Syn fibril from β-sheet to soluble random coil conformation.
To confirm the ThT fluorescence results, the morphology of α-Syn during the conformation transition with and without EGCG were observed by AFM (Fig. 4) and TEM (Fig. 5). Fig. 4A and B show the images of α-Syn after 0 h and 58 h incubation without EGCG, respectively, which exhibit the typically bundled fibrils formed after 58 h incubation. When the α-Syn was treated with 20 μM EGCG for 58 h incubation (Fig. 4C), much shorter and thinner fibrils appeared. Importantly, the α-Syn treated with 200 μM EGCG (Fig. 4D) produced large amorphous aggregates, instead of the ordered fibrils. This phenomenon is well consistent with the ThT fluorescence results, revealing an effective inhibition of α-Syn fibrillation by EGCG.
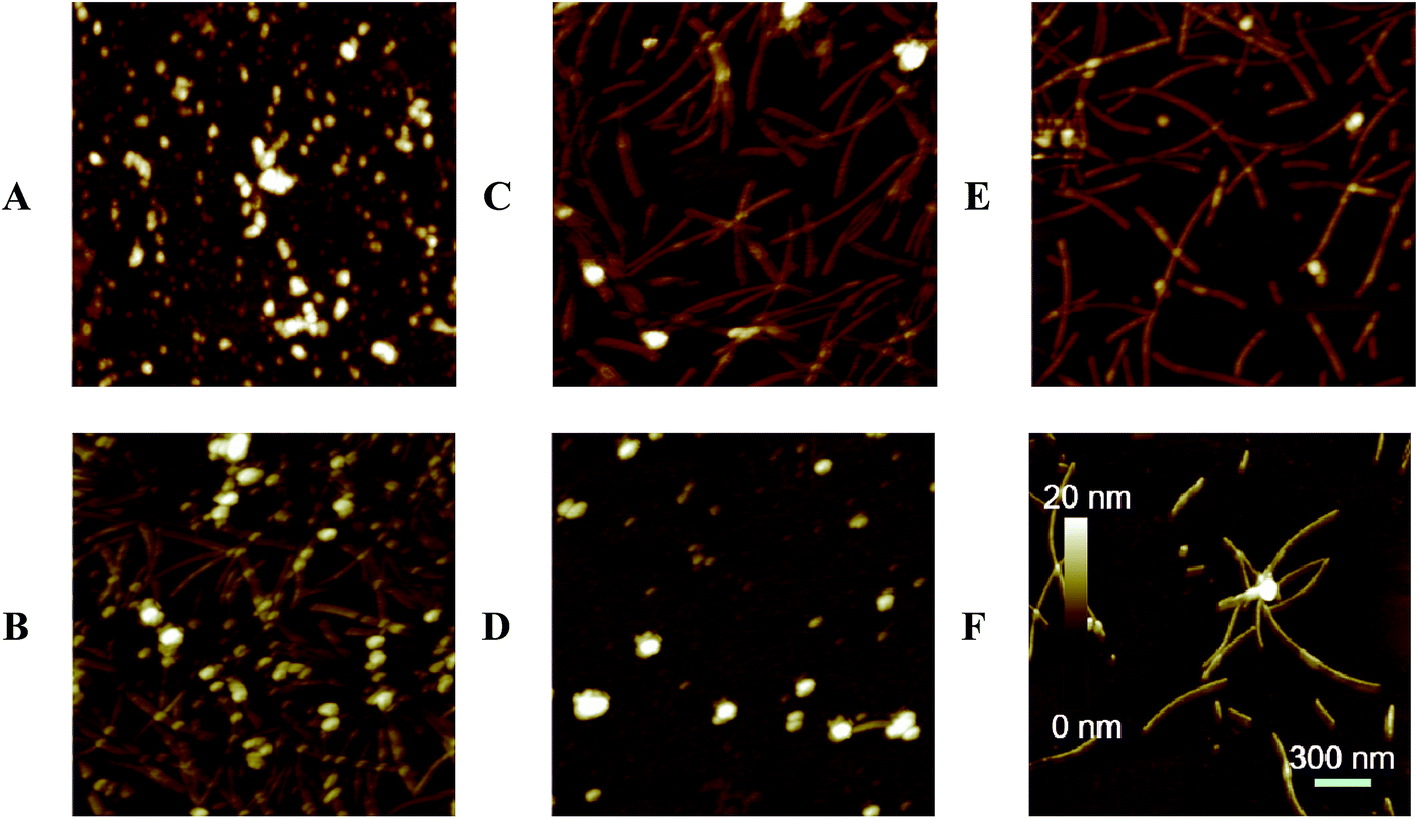 | ||
| Fig. 4 AFM analysis of morphologies of α-Syn aggregates. 50 μM α-Syn incubated alone for 0 h (A), 58 h (B); 50 μM α-Syn incubated in the presence of 20 μM (C), 200 μM (D) EGCG for 58 h; 50 μM α-Syn incubated alone for 30 h and then co-incubated with 20 μM (E), 200 μM (F) EGCG for another 28 h. | ||
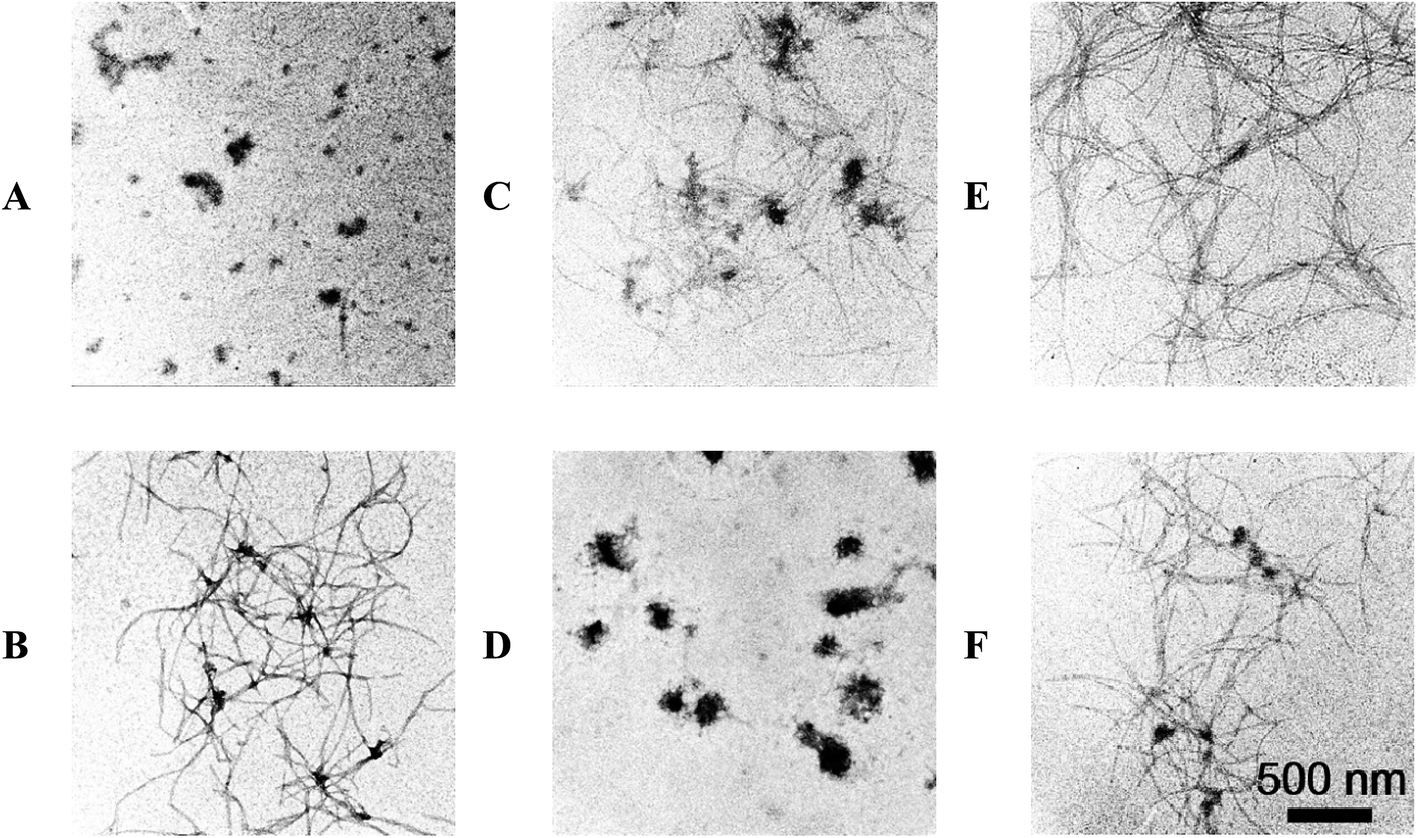 | ||
| Fig. 5 TEM analysis of morphologies of α-Syn aggregates. 50 μM α-Syn incubated alone for 0 h (A), 58 h (B), 50 μM α-Syn incubated in the presence of 20 μM (C), 200 μM (E) EGCG for 58 h. 50 μM α-Syn incubated alone for 30 h and then co-incubated with 20 μM (D), 200 μM (F) EGCG for another 28 h. | ||
To study the effect of EGCG on preformed amyloid fibrils, we firstly produced α-Syn fibrils by incubating natively unfolded monomers for 30 h, and then added EGCG into the preformed fibrils for additional 28 h incubation. We found that when α-Syn fibrils were treated with 20 μM EGCG (Fig. 4E), the amount of fibrils were decreased dramatically, and when treated with 200 μM EGCG (Fig. 4F), the α-Syn fibrils were almost disassembled and the rest of the fibrils became shorter and thinner. The results demonstrate that EGCG can remodel the ordered and fibrillary morphology of α-Syn into the amorphous one in a dose-dependent manner. The similar results were also observed by TEM as shown in Fig. 5.
2.2 EGCG-binding sites of α-Syn demonstrated by 1H NMR
To gain deeper insight into the interactions between EGCG and α-Syn, we recorded 1H NMR spectra of samples with 50 μM α-Syn in the absence or presence of 200 μM EGCG in 90% H2O/10% D2O. In order to avoid the overlap of solvent peaks, the region within 6.55 and 8.65 ppm and the region within 0.55 and 3.15 ppm were chosen to analyze the α-Syn resonances interfered by EGCG. 1H NMR spectrum at resonance range of 6.55–8.65 ppm (Fig. 6A) arose from aromatic residues, including Phe4, Tyr39, His50, Phe94, Tyr133 and Tyr136, and at resonance range of 0.55–3.15 ppm (Fig. 6B) from aliphatic residues. The changes of spectra in these regions provide the probe for exploring the binding features of EGCG to α-Syn. As observed in Fig. 6A(1) and (2) and B(1) and (2), the spectrum linewidth of α-Syn incubated for 58 h (2) was broadened significantly compared with that without incubation (1) especially for the aromatic region (Fig. 6A), which suggests that the aggregates of α-Syn were formed during incubation. The rigid particle has short transverse relaxation time of the resonance, therefore, leading to the line broadening.30 The results indicate that residues of Ala, Phe, His and Tyr play a fundamental role in the fibrillation of α-Syn.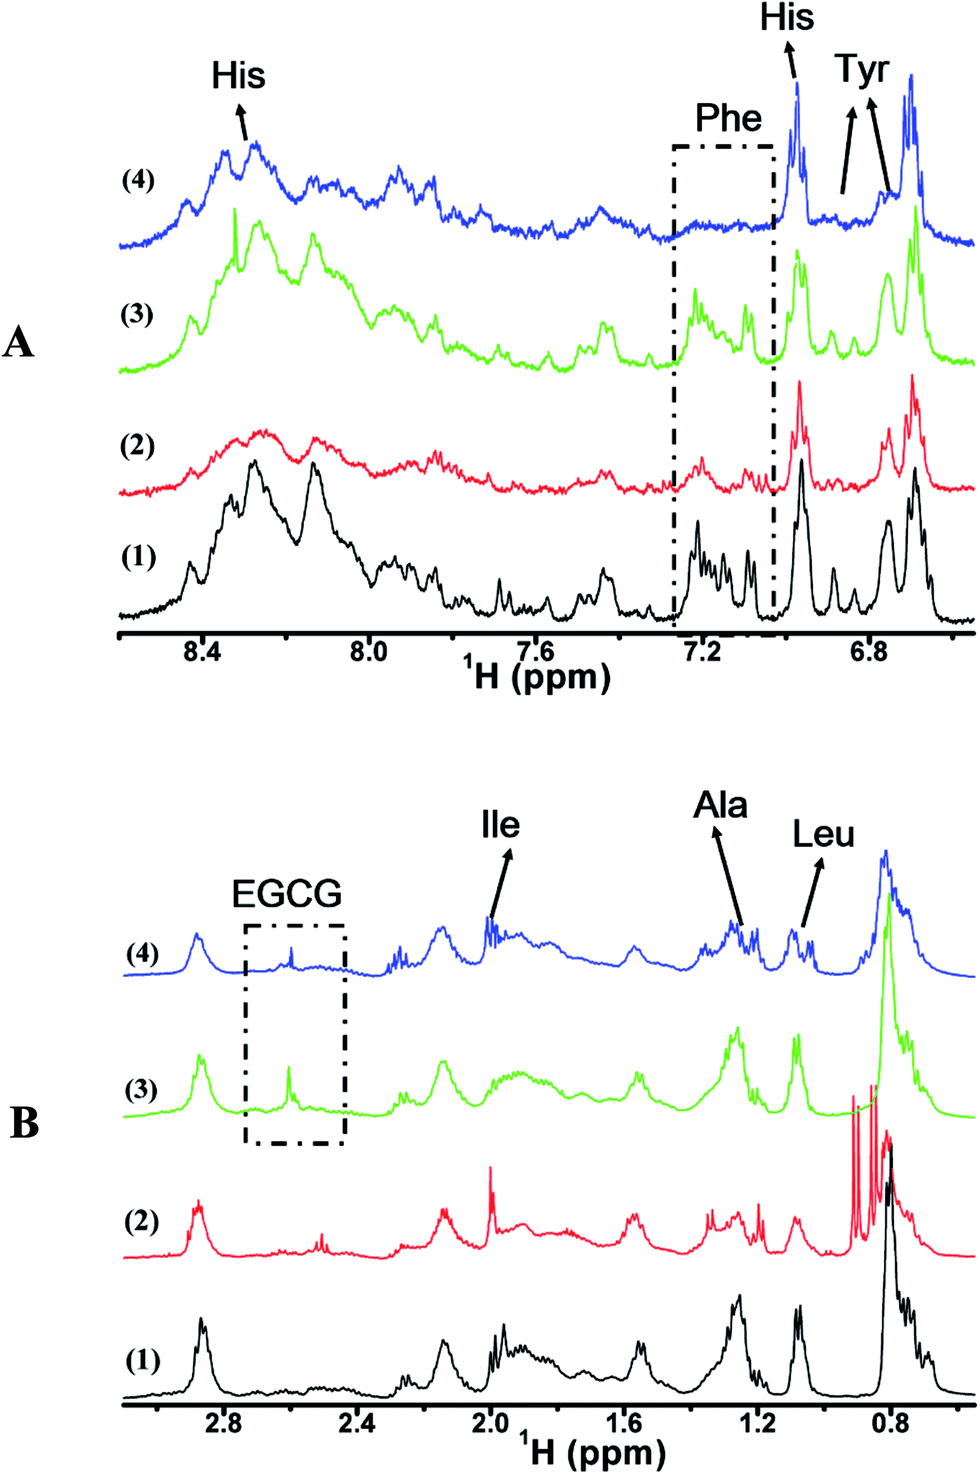 | ||
| Fig. 6 1H NMR of α-Syn treated with EGCG. (A) The aromatic region of α-Syn within 6.55 and 8.65 ppm; (B) high field region of α-Syn and EGCG within 0.55 and 3.15 ppm. Spectra were recorded at 25 °C in 90% H2O/10% D2O. Samples are 50 μM α-Syn incubated alone for 0 h (1) and 58 h (2), with 200 μM EGCG for 58 h (3); α-Syn incubated alone for 30 h and then co-incubated with 200 μM EGCG for another 28 h (4), respectively, in PBS (20 mM, pH 7.4). | ||
To investigate the binding sites of EGCG in preventing the formation of α-Syn abnormal aggregates, we recorded the 1H NMR spectrum of 50 μM α-Syn in the presence of 200 μM EGCG after 58 h incubation. It was found that the line broadenings were suppressed in Fig. 6A(3) and B(3) compared with Fig. 6A(2) and B(2), which also implies that EGCG significantly inhibited the abnormal aggregation of α-Syn. In this work, Fig. 6A(3) and B(3) shows that the peaks of Ile (δ 1.95 ppm), Phe (δ 7.20 ppm) and Tyr (δ 6.85 ppm) were broadened compared with that in Fig. 6A(1) and B(1), which suggests that Ile, Phe and Tyr were involved in the EGCG interaction.
Furthermore, to explore the disaggregation of preformed aggregates of α-Syn by EGCG, we recorded 1H NMR spectrum of 50 μM α-Syn incubated alone for 30 h and then with 200 μM EGCG for extra 28 h (Fig. 6A(4) and B(4)). The linewidths of Fig. 6A(4) and B(4) were broadened, compared with that of unfolded α-Syn in Fig. 6A(1) and B(1), but the broadening of the peak of His (δ 8.00–8.50 ppm) was receded, compared with that of the folded α-Syn without EGCG in Fig. 6A(2) and B(2). In contrast, from Fig. 6A(4) and B(4), the broadenings of the peaks of Phe (δ 7.20 ppm) and Tyr (δ 6.85 ppm) were enhanced, and interestingly, the peak of Leu (δ 1.05 ppm) was split, which appeared due to small field-dependent perturbations of scalar couplings.
Altogether, 1H NMR structural characterization reported here indicates that the inhibition of α-Syn aggregates may possibly result from the interaction of EGCG with the residues of Ile, Phe and Tyr, while the disaggregation of α-Syn aggregates from the interaction of EGCG with the residues of Leu, His, Phe and Tyr.
2.3 Suppression of α-Syn overexpression and cytotoxicity in transduced PC12 cells by EGCG
To study the effect of EGCG on α-Syn overexpressed cells, we employed the rat pheochromocytoma cell line PC12, a stable cell line expressing wild-type α-Syn by α-Syn gene knock-in method. Western blot analysis shows that the treatment of EGCG led to the decrease of α-Syn expression in a concentration-dependent manner (Fig. 7A). MTT assay shows that when the transduced PC12 cells were cultured with EGCG at the concentrations of 1, 10 and 50 μM for 48 h, cell viability remained (Fig. 7B) approximately by 107, 112 and 95%, respectively, as compared with that of the control group (without EGCG). The treatment of EGCG attenuated cell death, and 10 μM EGCG protected the cells most efficiently against α-Syn-induced toxicity.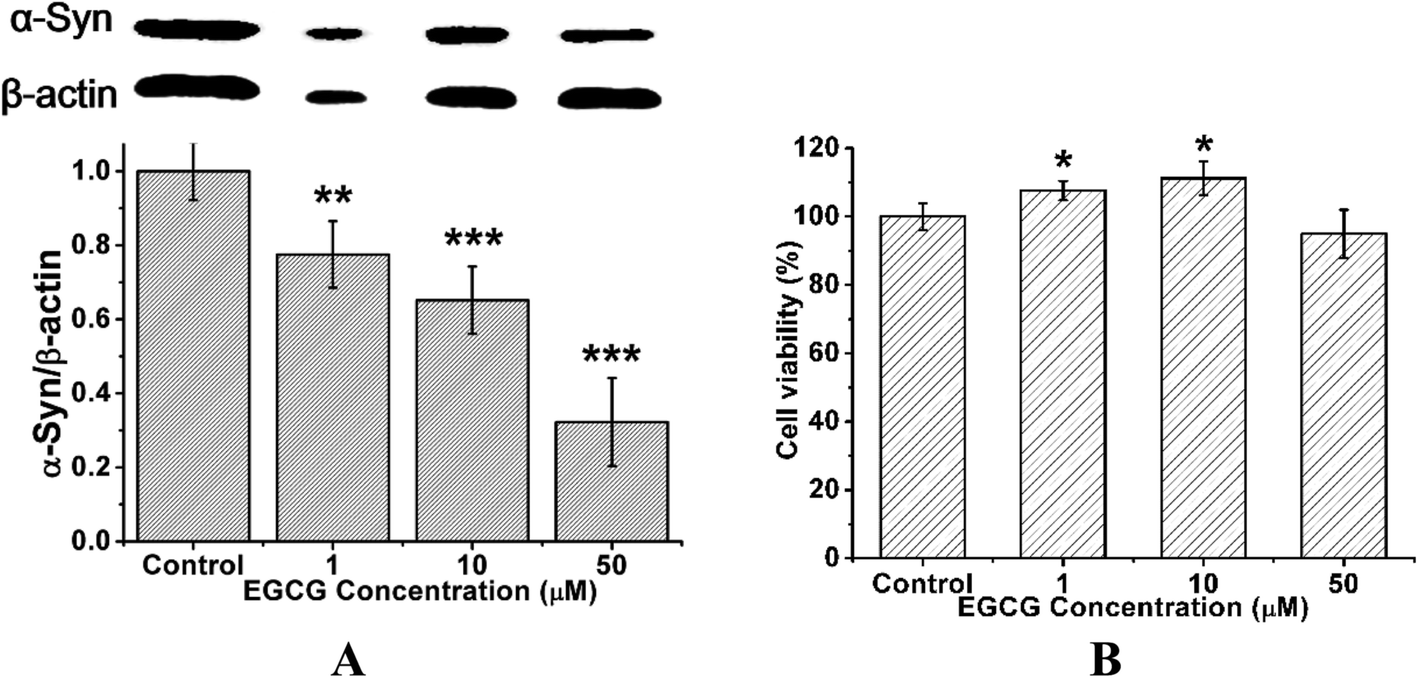 | ||
| Fig. 7 Effect of EGCG on the expression of α-Syn in the transduced PC12 cells and on the viability of the transduced PC12 cells. (A) Western blot analyses for the α-Syn expression in the cells. β-Actin was used as an endogenous loading reference. (B) The cell viability determined by the MTT assay. The transduced PC12 cells were cultured with 0 (control), 1, 10 and 50 μM EGCG for 48 h, respectively. Error bars = SD, n = 3; *: p < 0.05, **: p < 0.01, ***: p < 0.001 compared with the control group. | ||
To further study the functional mechanism of EGCG in the transduced PC12 cells, we used LSCM to observe the distribution of α-Syn in the cells, and ThT fluorescence assay to investigate α-Syn fibrillation inside the cells with and without EGCG. Firstly, we cultured the transduced PC12 cells in wells for 24 h and then added 10 μM EGCG for additional 48 h incubation. Then the cells were stained with fluorescence agents of DAPI for cells nuclei, rabbit anti-human α-Syn antibody for α-Syn protein, 0.05% ThT for α-Syn fibrils, and washed to remove the excess stain. As shown in Fig. 8, cells nuclei (DAPI, blue), cytoplasmic inclusions containing α-Syn (rabbit anti-human α-Syn antibody, red) and intracellular α-Syn fibrils (ThT, green) are observed. Fig. 8 shows that the expression level of α-Syn was remarkably higher in the transduced PC12 cells without EGCG (control) than that with EGCG, and α-Syn fibrils were also more in control than that in the cells with EGCG after 48 h incubation, which indicate that EGCG inhibited the expression of α-Syn and reduced the fibrils of α-Syn.
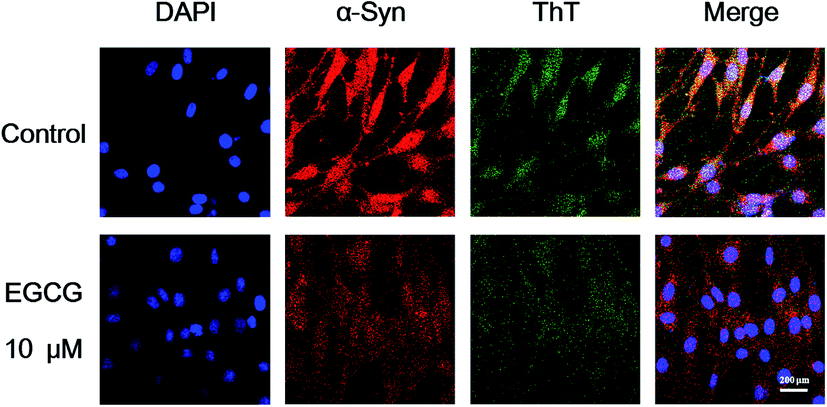 | ||
| Fig. 8 LSCM images of α-Syn aggregates in the transduced PC12 treated with 0 (control) and 10 μM EGCG for 48 h. Cells were stained by DAPI (blue) for nuclei, rabbit anti-human α-Syn antibody (red) for α-Syn, and ThT (green) for amyloid fibrils. | ||
2.4 EGCG inhibits ROS production in transduced PC12 cells
For analysis of intracellular ROS, the oxidation-sensitive probe DCFH-DA was used, which can be oxidized to the highly fluorescent dichlorofluorscein (DCF).31 Fig. 9 shows that EGCG incubated with cells for 48 h decreased ROS levels in a dose–response manner, compared with the control group. When cells were treated with 50 μM EGCG, the intracellular ROS was decreased by 60%. These results suggest that EGCG inhibited ROS production in transduced PC12 cells, displaying a significantly antioxidant capacity.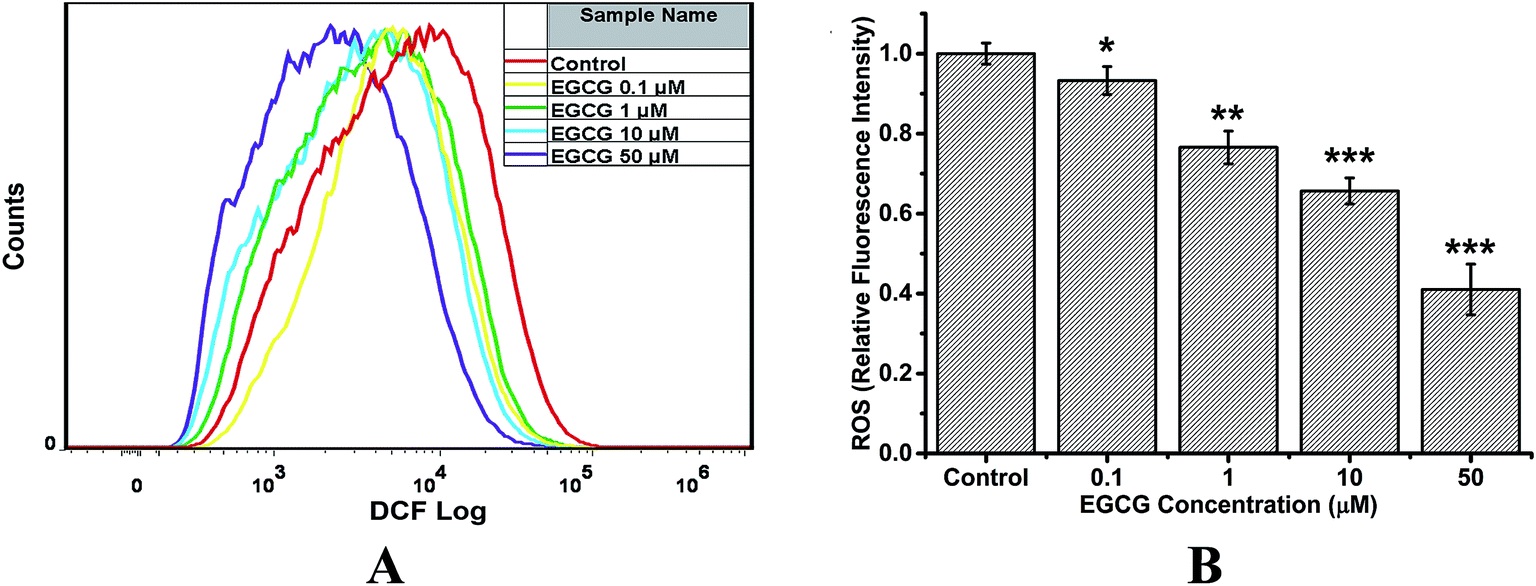 | ||
| Fig. 9 Flow cytometry analysis to evaluate the effect of EGCG on the production of ROS in transduced PC12 cells. The transduced PC12 cells were treated with 0 (control), 0.1, 1, 10 and 50 μM EGCG for 48 h, respectively. (A) Representative histogram of DCF fluorescence in the cells. (B) Quantitative analysis of the production of ROS. Results are expressed as relative fluorescent intensity. Error bars = SD, n = 3; *: p < 0.05, **: p < 0.01, ***: p < 0.001 compared with the control group. | ||
3 Discussion
It is generally acknowledged that the soluble β-sheet-rich protofibrils or aggregates induce the cellular toxicity, while amorphous aggregates of protein are nontoxic to mammalian cells.32 Recent studies suggest that α-Syn interacts with phospholipid membranes, regulates synaptic vesicle dynamics and plays a role in neuronal plasticity and neurotransmission.33 Transgenic mice34 and flies35 overexpressing human wild type or mutant α-Syn exhibit neuronal dysfunction and degeneration. In vitro, it has been found that overexpression of α-Syn increases intracellular reactive oxygen species (ROS), causes mitochondrial dysfunction and induces cell death.36 Some small molecules can be used to modulate protein aggregation.37,38 EGCG, a natural small molecule, has been demonstrated not only as an antiangiogenic and antitumor agent,39 but also as an amyloidogenic inhibitor. It is capable of modulating the misfolding of proteins by directly binding to unfolded polypeptide chains and forming unstructured, SDS-stable, nontoxic oligomers instead of the ordered β-sheet-rich aggregates, which makes the protein aggregation prone to a safe off-pathway assembly.26 In addition, as an in vitro model, PC12 cells pretreated by α-Syn and Aβ are often used to investigate PD and AD, respectively.40,41 However, α-Syn is a highly abundant endogenous protein with 140 amino acids, its uptake in cells cannot be accurately determined. Therefore, on the cellular level, understanding the effect of EGCG on the overexpression, fibrillation and cytotoxicity of α-Syn in the transduced PC12 cells is a paramount issue for the development of EGCG in the clinical application.3.1 Binding sites of EGCG to amino acids for inhibition and disaggregation of α-Syn fibrillation
In this study, we systematically investigated how EGCG inhibits the fibrillation of α-Syn and disaggregates the mature β-sheet-rich fibrils. Above studies indicate that EGCG not only significantly inhibits the conformational transition of α-Syn from random coil to β-sheet conformers, but also disaggregates the amyloid fibrils of α-Syn in a dose-dependent manner. Ehrnhoefer et al. reported that at equimolar concentrations, EGCG preferentially binds to the C-terminus of α-Syn at amino acid residues of Asp119, Ser129, Glu130 and Asp-135.26 However, at high EGCG/α-Syn molar ratio, EGCG binds nonspecifically to both hydrophobic and hydrophilic residues in the polypeptide chain.26 The hydroxyl groups in benzene ring of gallate are crucial for EGCG binding with protein.42 These groups are also found in other fibrillation inhibitors, such as baicalein, scutellarein, etc.43 Here, from 1H NMR spectroscopic results, we can find that for inhibition of fibrillation, EGCG interacts with amino acid sites of Ile, Phe and Tyr which are different from Leu, His, Phe and Tyr for disaggregation of fibrils.Schulten et al.44 have found that residues from 36 to 55 in α-Syn adopt β-hairpin in β-sheet conformation by molecular dynamics simulation. Among those residues, Gly36, Leu38, Val40, Ser42, Val49, Gly51, Ala53 and Val55 are affixed to the front surface of β-hairpin, while Val37, Tyr39, Gly41, His50, Val52 and Thr54 are on the back surface of β-hairpin, and Lys43, Thr44, Lys45, Glu46, Gly47 and Val48 are in the turn. EGCG is able to interact with protein by hydrogen bonding as well as π–π stacking.45 The interaction between B-ring and residues of Ile and Ala, between A-ring and Phe, between B/C ring and Leu, and between E-ring and Tyr play an important role during EGCG binding process.46 It seems reasonable to speculate that when α-Syn is in an unfolded conformation, EGCG may anchor to Ile by strong hydrogen bonding and to Phe and Tyr by π–π stacking, which blocks β-sheet formation in core amyloidogenic sequence, therefore effectively inhibiting the self-assembly of α-Syn. When α-Syn is in a folded β-sheet conformation, EGCG may interact with residues of His and Tyr which locate in the back surface of β-sheet, by π–π stacking, and interact with Leu which locate in the front surface of β-sheet, by hydrogen bonding, leading to the disassembling of preformed β-sheet structures. These assumptions need to be confirmed by further molecular dynamics simulations.
3.2 Attenuation of α-Syn overexpression, aggregation and α-Syn-induced cell death on cellular level by EGCG
It has been reported that the overexpression of α-Syn can decrease mitochondrial complex I activity, increase ROS production, and produce LB-like synuclein-contained inclusions which damage the dopaminergic neurons, resulting in the behavioral abnormality.36,47,48 Taking accounts into the effect of EGCG on the fibrillation of α-Syn in the protein system, we deduced that EGCG may also have the similar effect in the cellular system. Since the concentration of α-Syn in the transduced PC12 cells is much lower than that in the studied protein sample, it is reasonable that EGCG concentration required for the inhibition of α-Syn fibrillation in cells is much lower than that in protein sample. EGCG has been proven to be neuroprotective in both cell and animal models of PD by releasing caspase-3 and cytochrome c, cleaving poly (ADP-ribose) polymerase and glycogen synthase kinase-3, activating phosphatidyl inositol-3 kinase/Akt signaling pathway, and scavenging ROS and nitrogen species (RNS).49–53 In this work, we specifically used the transduced PC12 cells to further verify the role of EGCG in inhibiting overexpression, fibrillation and cytotoxicity of α-Syn.Besides, the protofibrils and β-sheet rich oligomeric aggregates of α-Syn are demonstrated to be the primary toxic species in PD.54 They are formed during the early-stage of protein aggregation,54 and bind to lipid membranes, disrupting vesicles, mitochondria, lysosomes and cellular membrane, and leading to the apoptosis of neurons.55–57 There is an equilibrium between the expression and fibrillation of α-Syn. High concentration of α-Syn is likely to form the ordered β-sheet fibril nuclei, leading to the increase of fibrils and aggregates.58 The overexpression of α-Syn can block the endoplasmic reticulum (ER)–golgi transporting lysosomal enzyme and glucocerebrosidase (GCase), resulting in the GCase activity reduced, and consequently the neurotoxicity in the cells.59 On the basis of our work for the transduced PC12 cells, we suggest that EGCG can maintain or improve the cell viability by decreasing the overexpression of α-Syn, inhibiting the fibrillation of α-Syn and even disaggregating the preformed ordered β-sheet fibrils into amorphous aggregates. Moreover, EGCG can protect the cells by eliminating ROS produced by the overexpression and β-sheet aggregation of α-Syn.
In conclusion, we demonstrate that EGCG not only significantly inhibits the conformational conversion of α-Syn from random coil to β-sheet conformers, but also disaggregates the ordered amyloid fibrils of α-Syn on molecular level. In addition, EGCG can protect the transduced PC12 cells against α-Syn-induced cytotoxicity via reducing α-Syn overexpression and fibrillation. α-Syn transduced PC12 cells can be used to provide a valuable model system for preclinical investigation of PD therapeutics. We suppose that EGCG could be potentially used as a neuroprotective agent as well as a therapeutic agent against PD.
4 Materials and methods
EGCG, thioflavin T (ThT), uranyl acetate, thiazolyl blue tetrazolium bromide (MTT), phenylmethanesulfonyl fluoride (PMSF) and tris-hydroxymethyl aminomethane (Tris) were sourced from Sigma and Aldrich, USA. Dulbecco's modified Eagle's medium (DMEM), horse serum (HS), fetal bovine serum (FBS), L-glutamine, penicillin/streptomycin antibiotics were purchased from Gibco, USA. Hydrochloric acid (HCl), KH2PO4, Na2HPO4·12H2O, KCl, NaCl, Triton X-100 and dimethyl sulphoxide (DMSO) were purchased from Sinopharm, CN. Stock solutions of EGCG and ThT were prepared immediately before use.4.1 α-Syn expression and purification
α-Syn gene (GenBank: NM_000345) was amplified by PCR and cloned into the pT7N10C6 prokaryotic expression vector. The pT7N10C6 vector was reconstructed from the commercialized pET15b vector (Novagen, USA) by replacing the N-terminal with a 10-histidine tag and a TEV protease (Tobacco Etch Virus protease) cleavage site. The expression plasmid pT7N10C6-α-Syn was then introduced into Escherichia coli BL21 (DE3) pLsyS, in which the recombinant α-Syn protein was expressed in the auto-induction system at 37 °C (Studier 2005). When the bacteria were cultured until the optical density of ODλ = 600 = 0.8, they were incubated at 16 °C for 20 h for the transferred reaction. The cells were harvested by centrifugation (6000g, 4 °C and 15 min) and the cell pellets were suspended in 50 mM Tris–HCl buffer, pH 8.5, with 150 mM NaCl and 5% glycerol. Cells were then disrupted by sonication, followed by centrifugation (20![[thin space (1/6-em)]](https://www.rsc.org/images/entities/char_2009.gif) 000g, 4 °C and 60 min). The supernatants were loaded onto HisTrap HP column (GE Healthcare) and eluted with 50 mM Tris–HCl buffer, pH 8.5, containing 150 mM NaCl, 5% glycerol and 140 mM imidazole. Afterward, the His10 tag on the α-Syn protein was removed by incubation with His-tagged TEV protease overnight and separated on a HisTrap HP column (GE Healthcare). The recombinant α-Syn protein was further purified by Superdex 75 Increase 10/300 GL size exclusive column (GE Healthcare). Finally, the purified protein was exchanged into Tris–HCl buffer by ultrafiltration.
000g, 4 °C and 60 min). The supernatants were loaded onto HisTrap HP column (GE Healthcare) and eluted with 50 mM Tris–HCl buffer, pH 8.5, containing 150 mM NaCl, 5% glycerol and 140 mM imidazole. Afterward, the His10 tag on the α-Syn protein was removed by incubation with His-tagged TEV protease overnight and separated on a HisTrap HP column (GE Healthcare). The recombinant α-Syn protein was further purified by Superdex 75 Increase 10/300 GL size exclusive column (GE Healthcare). Finally, the purified protein was exchanged into Tris–HCl buffer by ultrafiltration.
4.2 ThT fluorescence assay
ThT fluorescence measurements were performed at the excitation wavelength of 450 nm and the emission wavelength of 485 nm using a BioTek Synergy H1 (BioTek, USA) plate reader. The samples were incubated in 96-well plates at 37 °C. All samples were prepared by adding lyophilized α-Syn into Tris–HCl–ThT (pH 7.4) solution immediately before the measurement. The final solution contained 50 μM protein, 10 μM ThT and 20 mM Tris–HCl. The concentration of EGCG in the protein solution was adjusted to 0, 5, 10, 20, 50, 100 and 200 μM, respectively.4.3 CD spectroscopy analysis
Jasco spectropolarimeter was utilized to record CD spectra of the α-Syn-based samples. 10 μL of the reaction mixture was diluted by 140 μL phosphate buffer (20 mM, pH = 7.4) in a 1 mm path-length quartz cell at the scanning range from 190 to 250 nm. The final CD spectra were calculated by subtracting a blank control spectrum (20 mM phosphate buffer only).4.4 Atomic force microscopy (AFM)
AFM samples were prepared from the solutions used for the fluorescence measurements. 5 μL of the protein solution was collected at the end of the kinetic runs and swiftly diluted to 5 μg mL−1 solutions with Tris buffer. 20 μL of the diluted samples was mounted onto the freshly cleaved mica for AFM observation. After dried at room temperature for 2 h, the sample on the mica surface was gently rinsed with deionized water for removing the Tris salt in the sample, and then dried in vacuum overnight. The images of protein aggregates were acquired in atmosphere by the silicon probes in a tapping mode by using Multimode 8 Scanning Probe Microscope (Bruker, USA). The model of the probe is RTESP with 40 N m−1 elastic index and 300 kHz resonance frequency.4.5 Transmission electron microscopy (TEM)
TEM samples were prepared from the solutions used for the fluorescence measurements. 5 μL of the protein solution was collected at the end of the kinetic runs and swiftly diluted to 25 μg mL−1 solutions with Tris buffer. After that, 10 μL of the diluted samples was blotted on a carbon-coated Formvar 300 mesh copper grid (Electron Microscopy Sciences, USA) twice for 20 min and then negatively stained with saturated uranyl acetate for 2 min. The images of protein aggregates were acquired by using Tecnai G2 20 TWIN (FEI, USA).4.6 1H NMR spectroscopy
The protein was dissolved in PBS buffer (20 mM, pH 7.4) and then mixed with EGCG aqueous solutions to obtain the protein concentration of 50 μM, and EGCG concentration of 0, 20 and 200 μM, respectively. The samples were incubated while steadily shaken at 37 °C for 58 h, and then D2O was added in the ratio of 90% H2O/10% D2O for 1H NMR measurement at 25 °C. 1H NMR spectra were acquired on an AVANCE III HD 500 MHz spectrometer (Bruker, GER) using the water suppression pulse sequence.4.7 Viability of α-Syn transduced PC12 cells by MTT method
PC12 cell is a cell line derived from a pheochromocytoma of the rat adrenal medulla and was purchased from Shanghai Institutes for Biological Sciences, CAS, CN. PC12 cells which can overexpress wild-type α-Syn were prepared as described in our previous reports.60 The transduced PC12 cells were grown in DMEM containing 6.7% HS, 3.3% FBS, 1% L-glutamine (3.6 mM) and 1% penicillin/streptomycin antibiotics in 5% CO2 at 37 °C. Cells were harvested from flasks (Corning Inc., NY) and plated in 96-well polystyrene plates (Corning Inc., NY) with the density of 2.5 × 10⁴ mL−1 in 100 μL medium per well and incubated at 37 °C for 24 h to attach to the plates, then the pre-incubated medium in each well was aspirated carefully, and 100 μL fresh medium (DMEM containing 1.0% HS, 0.5% FBS, 1% L-glutamine (3.6 mM) and 1% penicillin/streptomycin antibiotics) with EGCG at concentrations of 0, 1, 10 and 50 μM were added to the wells, respectively. The cells were then incubated for additional 48 h at 37 °C, and at the end of incubation, 20 μL fresh DMEM with 5 mg mL−1 MTT was added to each well and incubated for additional 4 h at 37 °C for the formation of formazan crystals, and the formed crystals were then dissolved by addition of 100 μL DMSO in each well with shaking for 20 min at room temperature. The absorbance at 490 nm was measured by Bio-Rad multi-well assay plate reader (Bio-Rad, USA) and averaged by five replicated wells for each sample and control. Cell viability was calculated by the ratio of the absorbance of studied groups to that of the control group. The standard deviations were analyzed by one-way ANOVA packaged in Origin 8.0 software.4.8 Western blot analysis of endogenous α-Syn in transduced PC12 cells
The cells were harvested from flasks and plated in 6-well polystyrene plates with 5 × 10⁵ mL−1 cells in 2.5 mL medium per well, and then incubated at 37 °C for 24 h to attach to the plate. EGCG at concentrations of 0, 1, 10 and 50 μM was then added individually to those cell wells. The cells were then incubated for additional 48 h at 37 °C. At the end of incubation, α-Syn expressed in the cells was analyzed by Western blot method. The cells were lysed on ice in the RIPA lysis buffer (Beyotime, CN) with 1 mM PMSF for 30 min. After centrifugation at 12000g for 10 min, the supernatants were collected. The protein concentrations in the supernatants were determined by BCA method. Before electrophoresis, the cell lysates in the supernatants were further diluted with SDS loading buffer (Beyotime, CN) and heated at 100 °C for 8 min. 30 μg of lysate was separated by SDS-PAGE and transferred to the polyvinylidene difluoride (PVDF) membranes (Millipore, MA). The PVDF membrane was then blocked in TBST (10 mM Tris–HCl, pH 7.4, 150 mM NaCl, 0.1% Tween-20, 5% non-fat milk) and probed with the rabbit anti-human α-Syn primary antibody (1:1000, CST, USA). Blots were detected using the enhanced chemiluminescence reagents (ECL, Pierce, IL), and visualized with GelDoc XR (Bio-Rad, USA). The intensity of each band was estimated by densitometric quantification using the Image Lab version 5.2.1 software. Data were collected from three independent experiments.
4.9 Immunofluorescence microscopy
The cells were harvested from flasks, and 5 × 10⁴ mL−1 cells in 1 mL medium were seeded on 0.01% poly-L-lysine (Songon Biotech, CN) coated glass slides in 12-well polystyrene plate (Corning Inc., NY), and incubated at 37 °C for 24 h to attach to the plate. Then the pre-incubated medium in each well was aspirated carefully, and 1 mL fresh medium (DMEM containing 1.0% HS, 0.5% FBS, 1% L-glutamine (3.6 mM), and 1% penicillin/streptomycin antibiotics) with EGCG at concentrations of 0 and 10 μM were added individually to each cell well. The cells were incubated for additional 48 h at 37 °C and then were fixed in 4% (w/v) paraformaldehyde (Songon Biotech, CN) in PBS for 20 min. Upon washed with PBS, cells were permeated with 0.1% Triton X-100 in PBS and blocked with 3% goat serum (Songon Biotech, CN) in PBS for 30 min at room temperature, subsequently incubated with rabbit anti-human α-Syn primary antibody (1:250, CST, USA) for 1 h at room temperature and then incubated with secondary antibody (1:250, goat anti-rabbit IgG conjugated to Alexa Fluor 647, CST, USA) for 1 h. 4′,6-Diamidino-2-phenylindole (DAPI, Songon Biotech, CN) and ThT were used to label the cell nuclei and amyloid fibrils, respectively. After finally washed with PBS, the coverslips were mounted in antifade mounting medium (Beyotime, CN) and observed by laser scanning confocal microscope (LSCM, C2+, Nikon, JP).4.10 Measurement of intracellular ROS formation
The cells were harvested from flasks and plated in 6-well polystyrene plates with 5 × 10⁵ mL−1 cells in 2.5 mL medium per well, and then incubated at 37 °C for 24 h to attach to the plate. EGCG at concentrations of 0, 1, 10 and 50 μM was then added individually to those cell wells. The cells were incubated for additional 48 h at 37 °C and then were incubated with 10 μM DCFH-DA for 30 min. Upon washed with DMEM and PBS, cells were detached with 0.05% trypsin and the cellular fluorescence intensity was measured by using a flow cytometer (Beckman Coulter, USA) (excitation 488 nm and emission 525 nm for the DCF). A total of 100000 events were acquired and cells were properly gated for analysis. Data were collected from three independent experiments.
Conflict of interest
The authors declare that there are no conflicts of interest.Abbreviations
| α-Syn | α-Synuclein |
| AD | Alzheimer's disease |
| AFM | Atomic force microscopy |
| CD | Circular dichroism spectroscopy |
| DCFH-DA | 2,7-Dichlorodi-hydrofluorescein diacetate assay |
| EGCG | (−)-Epigallocatechin-3-gallate |
| IAPP | Islet amyloid polypeptide |
| LB | Lewy bodies |
| LSCM | Laser scanning confocal microscope |
| NMR | Nuclear magnetic resonance |
| PD | Parkinson's disease |
| PBS | Phosphate buffer saline |
| ROS | Reactive oxygen species |
| TEM | Transmission electron microscopy |
| ThT | Thioflavin T |
Acknowledgements
The work was supported by the National Natural Science Foundation of China (No. 21374022 and 31470764).References
- C. G. Goetz, Cold Spring Harbor Perspect. Med., 2011, 1, a008862 CrossRef PubMed.
- A. J. Hughes, S. E. Daniel, Y. Ben-Shlomo and A. J. Lees, Brain, 2002, 125, 861–870 CrossRef PubMed.
- J. Li, E. Englund, J. L. Holton, D. Soulet, P. Hagell, A. J. Lees, T. Lashley, N. Quinn, S. Rehncrona and A. Bjorklund, Nat. Med., 2008, 14, 501–503 CrossRef CAS PubMed.
- L. Volpicellidaley, K. C. Luk, T. P. Patel, S. Tanik, D. M. Riddle, A. Stieber, D. F. Meaney, J. Q. Trojanowski and V. M. Y. Lee, Neuron, 2011, 72, 57–71 CrossRef CAS PubMed.
- M. H. Polymeropoulos, C. Lavedan, E. Leroy, S. E. Ide, A. Dehejia, A. Dutra, B. R. Pike, H. Root, J. Rubenstein and R. Boyer, Science, 1997, 276, 2045–2047 CrossRef CAS PubMed.
- V. N. Uversky, J. Biomol. Struct. Dyn., 2003, 21, 211–234 CAS.
- S. Liu, I. Ninan, I. Antonova, F. Battaglia, F. Trinchese, A. Narasanna, N. Kolodilov, W. T. Dauer, R. D. Hawkins and O. Arancio, EMBO J., 2004, 23, 4506–4516 CrossRef CAS PubMed.
- M. R. Cookson, Mol. Neurodegener., 2009, 4, 9–23 CrossRef PubMed.
- M. Periquet, T. A. Fulga, L. Myllykangas, M. G. Schlossmacher and M. B. Feany, J. Neurosci., 2007, 27, 3338–3346 CrossRef CAS PubMed.
- Q. Yang, H. She, M. Gearing, E. Colla, M. K. Lee, J. J. Shacka and Z. Mao, Science, 2009, 323, 124–127 CrossRef CAS PubMed.
- P. J. Muchowski, G. Schaffar, A. Sittler, E. E. Wanker, M. Hayerhartl and F. U. Hartl, Proc. Natl. Acad. Sci. U. S. A., 2000, 97, 7841–7846 CrossRef CAS PubMed.
- J. Shorter and S. Lindquist, Mol. Cell, 2006, 23, 425–438 CrossRef CAS PubMed.
- S. J. Tam, R. Geller, C. Spiess and J. Frydman, Nat. Cell Biol., 2006, 8, 1155–1162 CrossRef CAS PubMed.
- J. D. Sipe and A. S. Cohen, J. Struct. Biol., 2000, 130, 88–98 CrossRef CAS PubMed.
- C. M. Wischik, P. C. Edwards, R. Lai, M. Roth and C. R. Harrington, Proc. Natl. Acad. Sci. U. S. A., 1996, 93, 11213–11218 CrossRef CAS.
- J. M. Ringman, S. A. Frautschy, G. M. Cole, D. Masterman and J. L. Cummings, Curr. Alzheimer Res., 2005, 2, 131–136 CrossRef CAS PubMed.
- J. Bieschke, M. Herbst, T. Wiglenda, R. P. Friedrich, A. Boeddrich, F. Schiele, D. Kleckers, J. M. L. D. Amo, B. A. Gruning and Q. Wang, Nat. Chem. Biol., 2012, 8, 93–101 CrossRef CAS PubMed.
- B. Y. Feng, B. H. Toyama, H. Wille, D. W. Colby, S. R. Collins, B. C. H. May, S. B. Prusiner, J. S. Weissman and B. K. Shoichet, Nat. Chem. Biol., 2008, 4, 197–199 CrossRef CAS PubMed.
- A. R. A. Ladiwala, J. C. Lin, S. S. Bale, A. M. Marcelinocruz, M. Bhattacharya, J. S. Dordick and P. M. Tessier, J. Biol. Chem., 2010, 285, 24228–24237 CrossRef CAS PubMed.
- J. R. Mazzulli, A. Mishizen, B. I. Giasson, D. R. Lynch, S. A. Thomas, A. Nakashima, T. Nagatsu, A. Ota and H. Ischiropoulos, J. Neurosci., 2006, 26, 10068–10078 CrossRef CAS PubMed.
- L. Tilstra, H. Maeda and W. L. Mattice, J. Chem. Soc., Perkin Trans. 1, 1988, 1613–1616 RSC.
- H. N. Graham, Prev. Med., 1992, 21, 334–350 CrossRef CAS PubMed.
- A. E. Pelaez-Aguilar, L. Rivillas-Acevedo, L. French-Pacheco, G. Valdes-Garcia, R. Maya-Martinez, N. Pastor and C. Amero, Biochemistry, 2015, 54, 4978–4986 CrossRef CAS PubMed.
- C. Lin, T. H. Chen, M. Chiu, T. Way and J. Lin, Neurobiol. Aging, 2009, 30, 81–92 CrossRef CAS PubMed.
- F. Meng, A. Abedini, A. Plesner, C. B. Verchere and D. P. Raleigh, Biochemistry, 2010, 49, 8127–8133 CrossRef CAS PubMed.
- D. E. Ehrnhoefer, J. Bieschke, A. Boeddrich, M. Herbst, L. Masino, R. Lurz, S. Engemann, A. Pastore and E. E. Wanker, Nat. Struct. Mol. Biol., 2008, 15, 558–566 CAS.
- P. Cao and D. P. Raleigh, Biochemistry, 2012, 51, 2670–2683 CrossRef CAS PubMed.
- M. Groenning, J. Chem. Biol., 2010, 3, 1–18 CrossRef PubMed.
- N. Amdursky, Y. Erez and D. Huppert, Acc. Chem. Res., 2012, 45, 1548–1557 CrossRef CAS PubMed.
- M. M. Dedmon, K. Lindorfflarsen, J. Christodoulou, M. Vendruscolo and C. M. Dobson, J. Am. Chem. Soc., 2005, 127, 476–477 CrossRef CAS PubMed.
- F. L. Sun, L. Zhang, R. Y. Zhang and L. Li, Eur. J. Pharmacol., 2011, 660, 283–290 CrossRef CAS PubMed.
- O. Weinreb, S. Mandel, T. Amit and M. B. H. Youdim, J. Nutr. Biochem., 2004, 15, 506–516 CrossRef CAS PubMed.
- M. Lundblad, M. Decressac, B. Mattsson and A. Bjorklund, Proc. Natl. Acad. Sci. U. S. A., 2012, 109, 3213–3219 CrossRef CAS PubMed.
- E. Masliah, E. Rockenstein, I. Veinbergs, M. Mallory, M. Hashimoto, A. Takeda, Y. Sagara, A. Sisk and L. Mucke, Science, 2000, 287, 1265–1269 CrossRef CAS PubMed.
- S. S. Park and D. Lee, Eur. J. Neurosci., 2006, 23, 2908–2914 CrossRef PubMed.
- K. F. Winklhofer and C. Haass, Biochim. Biophys. Acta, 2010, 1802, 29–44 CrossRef CAS PubMed.
- A. R. A. Ladiwala, J. S. Dordick and P. M. Tessier, J. Biol. Chem., 2011, 286, 3209–3218 CrossRef CAS PubMed.
- S. Sinha, Z. Du, P. Maiti, F. Klarner, T. Schrader, C. Wang and G. Bitan, ACS Chem. Neurosci., 2012, 3, 451–458 CrossRef CAS PubMed.
- B. N. Singh, S. Shankar and R. K. Srivastava, Biochem. Pharmacol., 2011, 82, 1807–1821 CrossRef CAS PubMed.
- J. Bieschke, J. Russ, R. P. Friedrich, D. E. Ehrnhoefer, H. Wobst, K. Neugebauer and E. E. Wanker, Proc. Natl. Acad. Sci. U. S. A., 2010, 107, 7710–7715 CrossRef CAS PubMed.
- F. L. Palhano, J. Lee, N. P. Grimster and J. W. Kelly, J. Am. Chem. Soc., 2013, 135, 7503–7510 CrossRef CAS PubMed.
- M. Caruana, T. Hogen, J. Levin, A. Hillmer, A. Giese and N. Vassallo, FEBS Lett., 2011, 585, 1113–1120 CrossRef CAS PubMed.
- M. Kumamoto, T. Sonda, K. Nagayama and M. Tabata, Biosci., Biotechnol., Biochem., 2001, 65, 126–132 CrossRef CAS PubMed.
- H. Yu, W. Han, W. Ma and K. Schulten, J. Chem. Phys., 2015, 143, 243142 CrossRef PubMed.
- Q. Wang, J. Guo, P. Jiao, H. Liu and X. Yao, PLoS One, 2014, 9, e94796 Search PubMed.
- S. A. Hudson, H. Ecroyd, F. C. Dehle, I. F. Musgrave and J. A. Carver, J. Mol. Biol., 2009, 392, 689–700 CrossRef CAS PubMed.
- R. G. Pendleton, F. Parvez, M. Y. Sayed and R. Hillman, J. Pharmacol. Exp. Ther., 2002, 300, 91–96 CrossRef CAS PubMed.
- K. Jomova, D. Vondrakova, M. Lawson and M. Valko, Mol. Cell. Biochem., 2010, 345, 91–104 CrossRef CAS PubMed.
- A. Attar, F. Rahimi and G. Bitan, Transl. Neurosci., 2013, 4, 385–409 Search PubMed.
- J. Y. Jung, C. R. Han, Y. J. Jeong, H. J. Kim, H. S. Lim, K. H. Lee, H. O. Park, W. M. Oh, S. H. Kim and W. T. Kim, Neurosci. Lett., 2007, 411, 222–227 CrossRef CAS PubMed.
- R. Hou, J. Chen, H. Chen, X. Kang, M. Li and B. Wang, Cell Biol. Int., 2008, 32, 22–30 CrossRef CAS PubMed.
- F. Nanjo, K. Goto, R. Seto, M. Suzuki, M. Sakai and Y. Hara, Free Radicals Biol. Med., 1996, 21, 895–902 CrossRef CAS PubMed.
- N. Salah, N. J. Miller, G. Paganga, L. Tijburg, G. P. Bolwell and C. Riceevans, Arch. Biochem. Biophys., 1995, 322, 339–346 CrossRef CAS PubMed.
- K. A. Conway, S. Lee, J. Rochet, T. T. Ding, R. E. Williamson and P. T. Lansbury, Proc. Natl. Acad. Sci. U. S. A., 2000, 97, 571–576 CrossRef CAS.
- P. K. Auluck, G. Caraveo and S. Lindquist, Annu. Rev. Cell Dev. Biol., 2010, 26, 211–233 CrossRef CAS PubMed.
- B. D. Van Rooijen, M. M. A. E. Claessens and V. Subramaniam, Curr. Protein Pept. Sci., 2010, 11, 334–342 CrossRef CAS PubMed.
- B. Van Rooijen, M. M. A. E. Claessens and V. Subramaniam, PLoS One, 2010, 5, e14292 CAS.
- V. N. Uversky, J. Li and A. L. Fink, J. Biol. Chem., 2001, 276, 44284–44296 CrossRef CAS PubMed.
- M. Xilouri, O. R. Brekk and L. Stefanis, Mov. Disord., 2016, 31, 178–192 CrossRef CAS PubMed.
- M. Neystat, T. Lynch, S. Przedborski, N. Kholodilov, M. Rzhetskaya and R. E. Burke, Mov. Disord., 1999, 14, 417–422 CrossRef CAS PubMed.
| This journal is © The Royal Society of Chemistry 2017 |