 Open Access Article
Creative Commons Attribution 3.0 Unported Licence
Microvesicle release and micellar attack as the alternative mechanisms involved in the red-blood-cell-membrane solubilization induced by arginine-based surfactants†
M. Elisa Fait a,
Melisa Hermeta,
Francesc Comelles
 b,
Pere Clapés
 c,
H. Ariel Alvarez
 d,
Eduardo Prietoe,
Vanesa Herlaxf,
Susana R. Morcelle
 *a and
Laura Bakás*a
aCentro de Investigación de Proteínas Vegetales (CIPROVE), Departamento, de Ciencias Biológicas, Facultad de Ciencias Exactas, Centro Asociado CIC PBA, UNLP, La Plata, Argentina. E-mail: morcelle@biol.unlp.edu.ar; lbakas@biol.unlp.edu.ar
bDepartment of Chemical and Surfactant Technology, Institute of Advanced Chemistry of Catalonia (IQAC-CSIC), Barcelona, Spain
cDepartment of Chemical Biology and Molecular Modeling, Catalonia Institute of Advanced Chemistry (IQAC-CSIC), Barcelona, Spain
dInstituto de Física de Líquidos y Sistemas Biológicos (IFLYSIB), CCT-La Plata, CONICET, UNLP and Departamento de Ciencias Biológicas, Facultad de Ciencias Exactas, UNLP, La Plata, Argentina
eInstituto de Investigaciones Fisicoquímicas Teóricas y Aplicadas (INIFTA), CCT-La Plata, CONICET, UNLP, La Plata, Argentina
fInstituto de Investigaciones Bioquímicas de La Plata (INIBIOLP), CCT-La Plata, CONICET, UNLP, La Plata, Argentina
First published on 28th July 2017
Abstract
Two novel arginine-based surfactants, Bz-Arg-NHC10 and Bz-Arg-NHC12, were characterized with respect to surface properties and their interaction with human red-blood-cell (HRBC) membranes. The values for critical micellar concentration (CMC), the maximum surfactant adsorption at the air–liquid interface, and the area per molecule indicated better surface properties for Bz-Arg-NHC12. The observation of cylindrical worm-like aggregates of Bz-Arg-NHCn via atomic-force microscopy supported the predictions based on the value of the surfactant-packing parameter (SPP). Erythrocyte-membrane solubilization was effected by surfactant aggregates since cell lysis became evident at only surfactant concentrations above the CMC. Changes in HRBC shape observed at different surfactant concentrations led to the conclusion that a slow mechanism based on the insertion of surfactant monomers into the HRBC membrane, followed by a shedding of microvesicles was responsible for the hemolysis produced by both surfactants at the lower concentrations tested. In contrast, the extraction of membrane lipids upon collisions between HRBCs and surfactant aggregates competes with and prevents microvesicle release at the higher concentrations assayed.
1. Introduction
Synthetic amphipathic structures that mimic natural ones (such as lipoamino acids and other surfactant-like peptides) possess better properties than commercial surfactants from the point of view of toxicity and biodegradability and are relatively easy to obtain. A plethora of amino-acid and/or peptide-based structures with surface activity that can be designed accounts for the diversity of physicochemical and biologic properties that these kinds of compounds may exhibit.1 Arginine-based surfactants constitute an interesting group of amino-acid-based surfactants since those lipoamino acids generally constitute nontoxic and highly biodegradable cationic compounds with excellent broad-spectrum antimicrobial properties2 and therefore are much less toxic and more environmentally friendly than quaternary ammonium compounds. This family of surfactants is remarkably effective as a preservative in food and pharmaceutical formulations, or even as an active ingredient in dermatology and personal-care products.3 Moreover, arginine-based surfactants can be incorporated into liposomal formulations in order to obtain gene delivery systems4 and vesicles with antimicrobial properties and lower cytotoxicity than classical formulations.5,6According to their structure, arginine-based surfactants can be classified in three categories: namely, as (i) single-chain, (ii) dimeric (gemini), and (iii) glycerolipid-conjugate surfactants.3 Two novel arginine-based compounds belonging to the first of these groups, Bz-Arg-NHC10 and Bz-Arg-NHC12 (Fig. 1), were synthesized in our laboratory by means of a biocatalytic strategy. Papain from Carica papaya latex was used as a biocatalyst for the condensation reaction between Nα-benzoyl-arginine ethyl ester hydrochloride and decyl- or dodecylamine as nucleophiles. Nα-Benzoyl-arginine alkylamides (Bz-Arg-NHCn) exhibited antimicrobial activity against both Gram-positive and Gram-negative bacteria and were also less hemolytic and eye-irritating than the commercial quaternary ammonium compound Cetrimide. A similar pattern could also be observed when cytotoxicity was tested on human hepatocytes and fibroblasts: both arginine derivatives were less toxic than Cetrimide.7 These findings provided relevant information about the potential use of these multifunctional (i.e., both surface active and biocidal) compounds in pharmaceutical formulations. Nevertheless, surfactants may cause a variety of adverse side effects when present in such formulations, with hemolysis being one of the most common. Pape et al. developed a simple, rapid, and effective methodology to evaluate the toxicity of detergents and surfactants based on the use of red blood cells as a model to test membrane integrity.8 In the present work, we thus characterized the surface-active properties of the two Bz-Arg-NHCn and described the morphology of the resulting aggregates. We furthermore studied and analyzed the sequential steps in the hemolysis induced by those Bz-Arg-NHCn to obtain a sharper focus on the aggregation state of the surfactant molecules (monomers or aggregates) responsible.
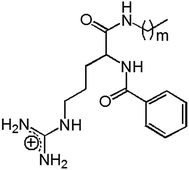 | ||
| Fig. 1 Chemical structure of arginine-based cationic surfactants: Nα-benzoyl-arginine acyl amides (Bz-Arg-NHCn), with m = 9, 11 and n = m + 1. | ||
2. Experimental
2.1. Chemicals
Red blood cells were obtained from the blood of healthy volunteers from our laboratory staff (CIPROVE, La Plata, Argentina) with EDTA used to prevent blood clotting. Cells were washed three times with phosphate-buffered saline (PBS: 123.3 mM NaCl, 22.2 mM Na2HPO4, 5.6 mM KH2PO4 in MilliQ® nanopure water; pH 7.4; 300 mOsm l−1). Triton X-100 and poly-L-lysine were from Sigma-Aldrich. Bovine-serum albumin was from Fedesa S. A. The arginine-based cationic surfactants Bz-Arg-NHC10 and Bz-Arg-NHC12 were synthesized in our laboratory with papain—an endopeptidase from Carica papaya latex, adsorbed onto polyamide as previously described7—as biocatalyst. The rest of the chemicals used in this work were of analytical grade.2.2. Critical micelle concentration (CMC)
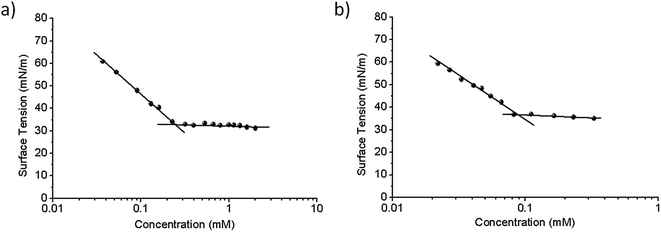
The surface-tension measurements at equilibrium were performed with a Krüss K12 tensiometer (Hamburg, Germany) by means of the Wilhelmy-plate method. All solutions at different surfactant concentrations were prepared in deionized water and equilibrated for 2 h at 25 °C in the appropriate glass cells. The CMC was estimated from the intersection between the two linear portions of the γ vs. log![[thin space (1/6-em)]](https://www.rsc.org/images/entities/char_2009.gif) C plot (cf. Fig. 2).
C plot (cf. Fig. 2).
2.3. Atomic-force microscopy (AFM)
The aggregates of the two Bz-Arg-NHCn surfactants were characterized in both air and a fluid cell by AFM in the tapping mode at 25 °C. The surfactant concentration in each experiment was five times the corresponding CMC. In all instances, 20 μl of the corresponding surfactant solution was spotted on freshly cleaved planchets of muscovite mica. Samples for studies in air were dried under N2 and analyzed through the use of probes doped with silicon nitride (Model RTESP, Veeco Instruments, Santa Barbara, CA, USA; tip radii, 8–12 nm, 271–311 kHz, force constant 40 N m−1). Samples in a fluid cell (water) were analyzed with NPS10 probes (tip radius 8–12 nm, 2–10 kHz, force constant 0.06 N m−1). Images were obtained with a MultiMode Scanning Probe Microscope (Veeco) equipped with a Nanoscope V controller (Veeco) at the typical scanning rate (1 Hz).2.4. Hemolysis assays
 | (1) |
2.4.4.1. Microvesicle isolation. One volume of RBCs (hematocrit, 4.0%) was mixed with one volume of the surfactant solutions prepared in PBS. After incubation at 37 °C for 10 min, the RBCs were pelleted by centrifugation at 1300 × g for 5 min. The supernatant was centrifuged at 10
![[thin space (1/6-em)]](https://www.rsc.org/images/entities/char_2009.gif) 000 × g for 3 min and the pellet discarded. Finally, the microvesicles were recovered from the supernatant upon centrifugation at 100
000 × g for 3 min and the pellet discarded. Finally, the microvesicles were recovered from the supernatant upon centrifugation at 100![[thin space (1/6-em)]](https://www.rsc.org/images/entities/char_2009.gif) 000 × g for 1 h. The microvesicle pellets were resuspended in an appropriate volume of PBS. A positive control of microvesicle release was obtained after treatment with the Ca2+-ionophore A23187.
000 × g for 1 h. The microvesicle pellets were resuspended in an appropriate volume of PBS. A positive control of microvesicle release was obtained after treatment with the Ca2+-ionophore A23187.
2.4.4.2. Transmission electron microscopy. Microvesicle suspensions were fixed in 1% (v/v) aqueous glutaraldehyde and aliquots dripped onto grids covered with a collodion film. Negative staining was performed by the addition of several drops of 1% (w/v) phosphotungstic acid to the grids, the excess stain was drawn off with filter paper, and the grids were then air dried. The samples were examined with a JEOL JEM-1200EX II transmission electron microscope (Japan).
3. Results and discussion
3.1. Determination of the CMC of the Bz-Arg-NHCn surfactants
A certain parallelism between the surfactant's CMC—the surfactant concentration at which stable aggregates appear and the monomer concentration remains constant—and the partition coefficient between the aqueous (polar) and the membrane (nonpolar) phases has been proposed.11 Heerklotz and Seelig12 reported a linear relationship between the logarithm of the CMC and the logarithm of the surfactant's partition constant (K) in the membrane. In this regard, the CMC constitutes a key parameter for understanding the mechanism involved in the membrane solubilization induced by surfactants. Accordingly, we determined the two CMC values from the plot of surface tension (γ) vs. the logarithm of the surfactant concentration at 25 °C, as the concentration at the point of intersection of the two linear portions of the plot (Fig. 2). Both compounds were able to reduce the surface tension of water to a constant value, thus demonstrating a defined CMC value for each of the surfactants (i.e., 0.23 and 0.085 mM for Bz-Arg-NHC10 and Bz-Arg-NHC12 respectively). The increase in the alkyl chain length from 10 to 12 carbons led to a decrease in the CMC value because of the increment in the hydrophobicity.The CMC values of these two lipoamino acids were even lower than those reported for two other related arginine-based surfactants, Nα-decyl-arginine-methyl ester and Nα-dodecyl-arginine-methyl ester at 16 and 5.8 mM, respectively.13 This difference can be attributed to the presence of a hydrophobic benzoyl group attached to the molecule in the two surfactants used in this work, thus increasing the tendency to self-aggregate.
From the plots of Fig. 2 and an application of the Gibbs equation, we calculated the following other surface-active parameters: the surface tension at the CMC (γCMC), the effectiveness of adsorption (pC20), the amount of surfactant adsorbed per unit area on a saturated interface (Γmax), and the interfacial area occupied per surfactant molecule Amin (cf. Table S1 of the ESI†).
The parameter Γmax depends not only on the chemical structure of the surfactant molecule and the functional groups present, but also on their orientation at the interface. Moreover, the effectiveness of adsorption is related to the interfacial area Amin—i.e., the smaller the cross-sectional area of the surfactant at the interface, the greater the surfactant's effectiveness of adsorption. A comparison of the parameters calculated for both compounds would appear to indicate that Bz-Arg-NHC12 had better surface properties than its counterpart containing only 10 carbons in the hydrophobic tail.
3.2. Surfactant-packing parameters
The shape of the aggregates into which the surfactant molecules assemble can be predicted by the surfactant-packing parameter (SPP), defined by eqn (2):| SPP = v/lA0 | (2) |
In general, the higher the SPP, the less curved are the aggregates. SPP values between 0.33 and 0.50 denote a cylindrical conformation of the aggregates; whereas, for SPPs <0.33, the micelles tend to adopt spherical shapes. The SPP values calculated for Bz-Arg-NHC10 and Bz-Arg-NHC12 were 0.38 and 0.45 respectively, thus predicting the formation of cylindrical micelles with both lipoamino acids. Pinazo et al.13 reported the aggregation of Nα-acyl-arginine methyl ester into classical spherical micelles. In this instance, the prediction based on the estimated SPP value (SPP = 0.31) was confirmed by NMR, light scattering, and small-angle-X-ray-diffraction scattering. These results established reasonable grounds for us to assume that our predictions based on the SPP parameter would be accurate.
3.3. AFM imaging
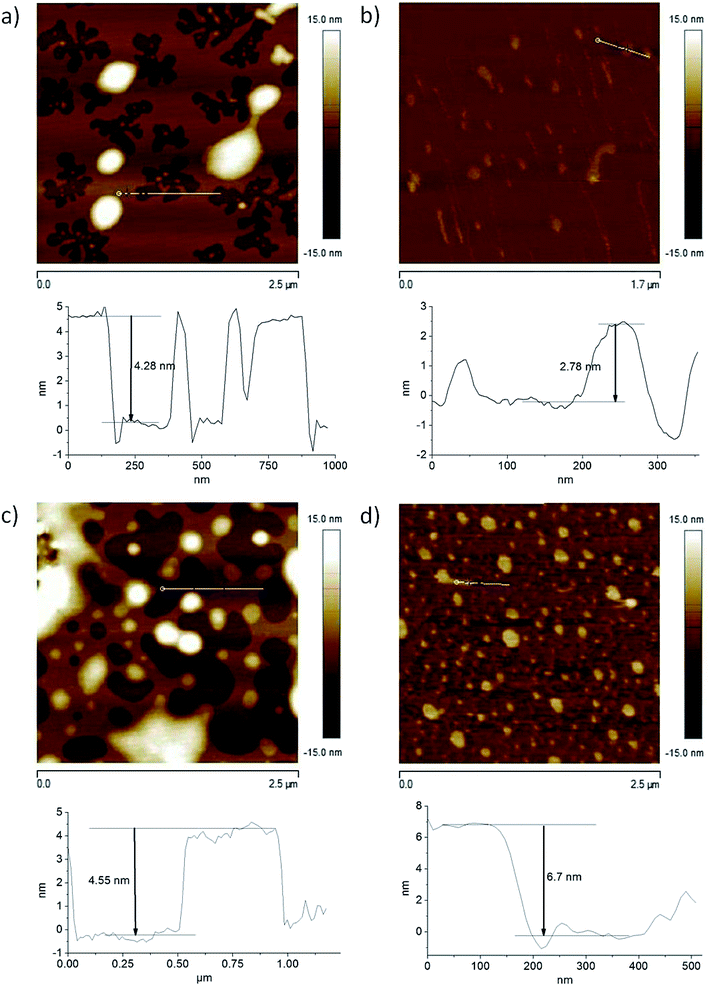
Topography imaging on the nano- and microscale is one of the main capabilities of AFM. Processes like crystallization and melting, diffusion, adsorption, self-assembly, and chemical reactions can be visualized through this technology. In the present work, we studied the aggregation of Bz-Arg-NHC10 and Bz-Arg-NHC12 by means of AFM in air and within liquids (Fig. 3). Height profiles were obtained in each medium for both surfactants. Assays were performed in the tapping mode, which setting minimizes damage to the sample by allowing contact of the tip with the sample for only short periods of time. Adsorption of the surfactants onto mica is mainly driven by electrostatic interactions between the positively charged head group of the surfactant and the negatively charged surface of the mica. Apart from charge neutralization, adsorption proceeds through hydrophobic interactions between the acyl chains of the already adsorbed surfactant molecules and the tails of additional molecules interacting with them from the bulk solution. In all instances, the profiles evidenced peaks corresponding to mono- and bilayers, with average heights of 3 and 5 nm, respectively. The presence of alternating patches of uncovered mica and surfactant bilayers was observed in the example of the surfactant solutions in air (Fig. 3, panels a and c). An adsorption of bulk aggregates on top of the initially formed bilayers was observed both in air and in the fluid cell. These aggregates were of highly variable sizes for Bz-Arg-NHC10, with heights ranging between 5 and 90 nm. A similar polydispersity was observed in the example of Bz-Arg-NHC12, with aggregate heights ranging between 12 and 40 nm. Moreover, cylindrical worm-like aggregates were observed in the AFM images acquired in the fluid cell for both Bz-Arg-NHCn (Fig. 3, panels b and d), consistent with predictions based on the SPP value.3.4. Kinetics of hemolysis
The two Bz-Arg-NHCn exhibited hemolytic activity in isotonic medium as had been previously demonstrated.7 In our earlier work, the experiments had proven that the hemolysis of HRBCs by Bz-Arg-NHC10 was almost 50% lower than that effected by Bz-Arg-NHC12.Although many efforts have been made to demonstrate a correlation between hemolytic activity and surfactant CMC, no clear proof has ever been garnered.15 In our experiments, the surfactant concentration producing 50% hemolysis (HC50) obtained for each arginine-based surfactant was at least one order of magnitude higher than the corresponding CMC, with HC50/CMC respective ratios of 11.42 and 16.60 obtaining for Bz-Arg-NHC10 and Bz-Arg-NHC12. As reported in Fait et al.,7 the pattern exhibited by the two Bz-Arg-NHCn in this regard differed greatly from that of Cetrimide, a commercial cationic surfactant for which the HC50/CMC ratio was 0.026. Differences between the HC50/CMC ratios in such instances suggest different hemolysis mechanisms involved in each example. Since highly hydrophobic surfactants have low CMC values; for a given surfactant concentration, the amount of free monomers in solution is considerably low. Since monomers are responsible for hemolysis, a much higher concentration of highly hydrophobic surfactants would be necessary to achieve hemolysis; hence, the HC50 would increase as the CMC decreases.16,17 Contrary to what would be expected on the basis of these considerations, when the results obtained for both arginine-based surfactants were compared, the lower CMC (i.e., the lower monomer concentration in solution in equilibrium with micelles) correlated with the higher hemolytic activity (i.e., the lower HC50).
As the HC50 represents the total concentration of surfactant that produces 50% hemolysis and not simply the fraction associated with the membrane, the effective ratio between the lipid and surfactant molecules for the onset (Rsat) and completion (Rsol) of membrane solubilization should be estimated on the basis of Lichtenberg's model18,19 (cf. ESI†).
The Rsat values obtained for the two surfactants did not represent a feasible reality since the conservation of membrane integrity after the incorporation of 6 or 11 surfactant molecules per lipid would seem highly unlikely. This paradox can be explained on the basis of the surfactants' low solubility and consequently low CMC. Within this context, surfactant aggregation can lead to an overestimation of both the Rsat and the Rsol values.
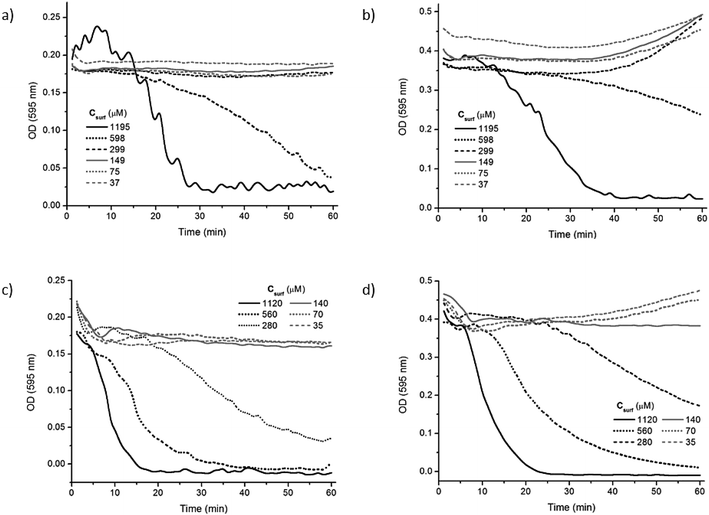
In order to obtain more information about the mechanism involved in the hemolysis induced by the two Bz-Arg-NHCn, changes in the optical density at 595 nm vs. time were obtained with HRBCs at 6 different surfactant concentrations, both below and above the respective CMCs. Fig. 4 illustrates the variation in the OD595 for 1 h at two different erythrocyte-membrane-lipid concentrations—13 and 26 μM, corresponding to hematocrits of 0.15 (panels a and c) and 0.30% (panels b and d), respectively—in the presence of Bz-Arg-NHC10 (panels a and b) and Bz-Arg-NHC12 (panels c and d).
When the HRBC suspensions were incubated with Bz-Arg-NHC10, erythrocyte solubilization was not evidenced for surfactant concentrations below the CMC. Likewise, at an erythrocyte concentration corresponding to a hematocrit of 0.15%, no substantial changes were observed in the OD595 for surfactant concentrations around the CMC of both compounds (Fig. 4). Hemolysis became evident, however, at surfactant concentrations 2.5 and 3.3 times the respective CMC values for Bz-Arg-NHC10 and Bz-Arg-NHC12.
For incubation periods longer than 30 min, a slight increment in the OD595 was detected for the lowest surfactant concentrations at the higher hematocrit (Fig. 4, panels b and d). This pattern resulted from a surfactant-mediated aggregation of the erythrocytes induced by the neutralization of the negatively charged cell surface by the cationic surfactant molecules. Cell aggregation was more evident when the erythrocyte concentration increased (cf. Fig. S3, panels b and d, ESI†). In this instance, the shape of the plots could be explained through a combination of two separate phenomena: an erythrocyte aggregation (recognized by an increase in the OD595) that competes with and eventually prevents membrane solubilization (evidenced by a decrease in the OD595).
3.5. Mechanism of HRBC-membrane solubilization induced by the two Bz-Arg-NHCn
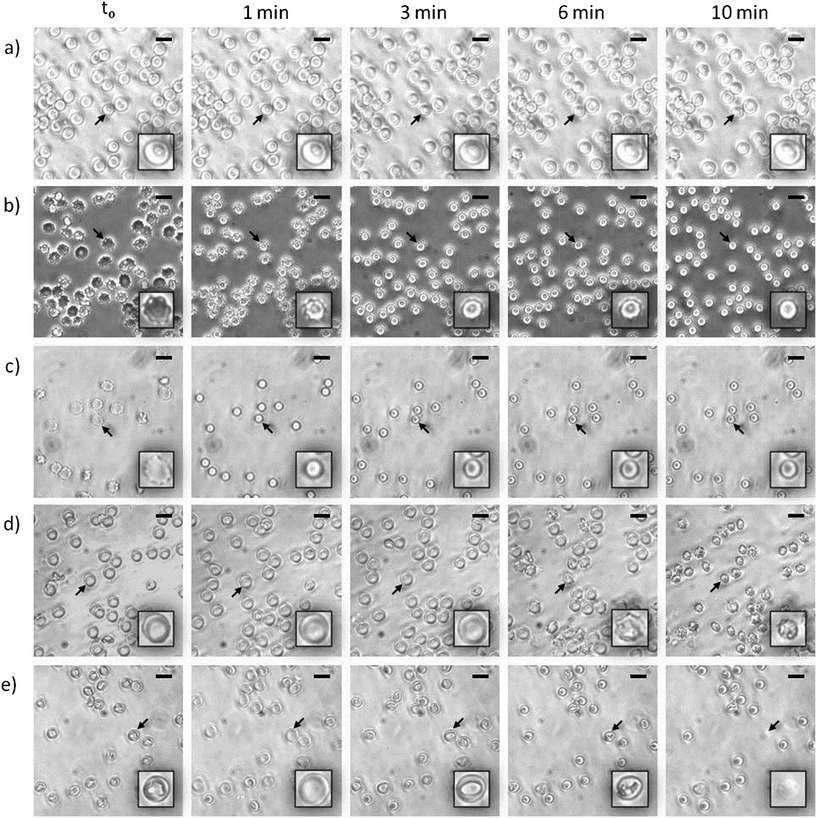
At the beginning of the hemolysis of erythrocytes induced by certain surfactants a lag period occurs during which surfactant molecules saturate the outer-membrane monolayer and flip into the inner one. Within this context, the hemolysis rate depends critically on the rapidity of that flipping: accordingly, for surfactants with slow rates, membrane solubilization proceeds slowly. Two different mechanisms have been proposed to explain such slow membrane solubilization: (i) via mixed micelles that pinch off from the erythrocyte membrane as a result of the outer-monolayer instability generated by the incorporation of surfactant molecules that cannot flip into the inner layer20 and (ii) via collisions of surfactant aggregates with the membrane, followed by the extraction of its components (either lipids or proteins).21 Considering this issue, we investigated the amount of solubilized phospholipids in the supernatant of lysed HRBCs after treatment with the two lipoamino acids. Since in all instances the erythrocyte-membrane solubilization was only evidenced at surfactant concentrations higher than the CMC, the assays were performed at about 6.6 times the corresponding CMC value (1518 and 547 μM for Bz-Arg-NHC10 and Bz-Arg-NHC12 respectively). The total amount of solubilized phospholipids was 8.6% for Bz-Arg-NHC10 and 10.9% for Bz-Arg-NHC12 (not shown). Because these results revealed the presence of solubilized phospholipids in the supernatant, further experiments were carried out in order to demonstrate which of the two above mechanisms was involved in the hemolysis of HRBCs by the two Bz-Arg-NHCn.The morphologic changes occurring in the erythrocytes were analyzed by phase-contrast microscopy in order to gain a better insight into the mechanism of the solubilization of HRBC membranes induced by the surfactants. The acquisition and analysis of digital imaging revealed distinctive morphologic sequences depending not only on the length of the surfactant acyl chain, but also on the surfactant concentration. Fig. 5 displays the alterations in the shape of HRBCs incubated in the presence of different concentrations of Bz-Arg-NHC10 (Fig. 5, panels b and c) or Bz-Arg-NHC12 (Fig. 5, panels d and e). Control images of untreated erythrocytes were recorded over the same time period, revealing no such morphologic variations in the absence of the surfactants (Fig. 5, panel a). For HRBC treated with Bz-Arg-NHC10 the sequence was discocyte → echinocyte → spherocyte, regardless of the concentration tested (300 or 1200 μM). For HRBCs incubated with Bz-Arg-NHC12, at the lowest surfactant concentration (280 μM) the sequence observed was discocyte → echinocyte → spheroechinocyte, whereas at the highest concentration (1120 μM) the erythrocyte morphologic changes were: discocyte → stomatocyte → spherocyte. During the experiments, lysis was evidenced only at 1120 μM of Bz-Arg-NHC12 after 6 min of incubation.
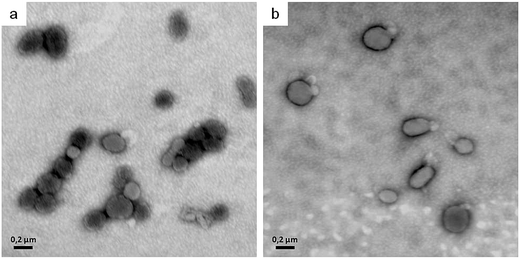
In order to explain the alterations in shape induced by the two lipoamino acids, we revised the bilayer-couple hypothesis formulated by Sheetz and Singer,12,21 which treatment establishes that a closed bilayer—i.e., composed of proteins and polar lipids asymmetrically distributed between the two monolayers—can act as a couple. In this respect, although the inner and outer monolayers remain coupled to one another, the shape alterations may arise from differences between the relative areas of each monolayer in response to different perturbations. Thus, any distress that increases the area of the outer monolayer—as the insertion of surfactant molecules that remain mainly in the outer leaflet—contributes to the formation of structures that protrude from the membrane surface in order to accommodate the extra area: there, the echinocytic shapes prevail. In contrast, the insertion and of amphiphilic molecules into the inner monolayer and the equilibration therein produces an expansion of that layer's area relative to the outer one, thus contributing to the formation of concavities on the membrane surface. The alterations in erythrocyte shape induced by surfactants may be not only a result of an asymmetric incorporation of amphiphile molecules into the bilayer, but also a consequence of the extraction of membrane components.22 In our experiments, after Bz-Arg-NHC10 monomers (the less hydrophobic) were incorporated into the HRBC membrane, they became settled in the outer monolayer, inducing changes in the typical shape of the erythrocyte from discocyte to echinocyte. The final transition to spherocytes (Fig. 5, panels b and c) could be explained by the subsequent shedding of mixed microvesicles. Bz-Arg-NHC12 (the more hydrophobic) induced a similar alteration at the lowest concentration tested (Fig. 5, panel d), but at the highest concentration, the main morphology observed was stomatocytic (Fig. 5, panel e). This difference can be explained on the basis of an increment in the number of surfactant aggregates, the latter being more efficient in lipid-protein extraction than those of Bz-Arg-NHC10. A rapid solubilization of the outer-monolayer components led to a substantial increase in the relative area of the inner monolayer, thus changing the erythrocyte shape from discocyte to stomatocyte. Within this context, we analyzed the presence of microvesicles in the supernatant of HRBCs treated with the two surfactants at echinocitogenic concentrations by transmission electron microscopy. Fig. 6 shows the electron micrographs of microvesicles isolated from the supernatant of treated HRBCs, with an average size of 200 nm.
4. Conclusions
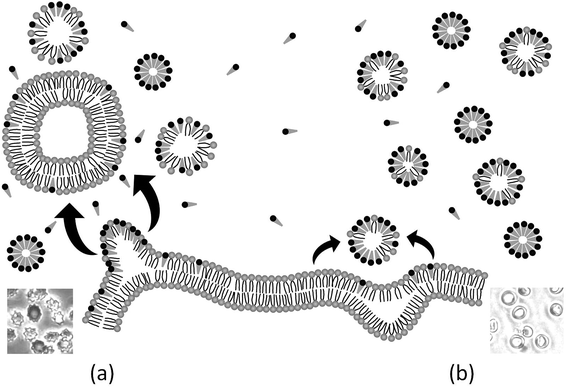
Two principal kinetic pathways have been accepted for the erythrocyte-membrane disruption caused by surfactants: (a) via a shedding of mixed micelles from the membrane, after solubilization is induced by surfactant monomers inserted in the outer monolayer and (b) a micellar mechanism, based on the extraction of membrane components caused by collisions between the HRBCs and the surfactant aggregates present in the surrounding medium. The first mechanism is applied in particular to amphiphiles that cannot translocate quickly to the inner monolayer of the membrane—e.g., surfactants with large hydrophilic head groups, such as the two Bz-Arg-NHCn in this work. In this regard, the insertion of monomers into the outer monolayer contributes to a stress resulting from the asymmetry between the area of the two monolayers, which deformation blocks further surfactant uptake and favors the release of membrane fragments from the overpacked leaflet. As a consequence, changes in the shape from discocyte to echinocyte take place. When, however, the number of surfactant aggregates in the solution is high, as in the example of Bz-Arg-NHC12, the extraction of membrane components overcomes the rate of monomer incorporation into the membrane. In this instance, an imbalance between the area of the inner and outer monolayers is observed: a relative increase in the area of the inner monolayer induces the discocyte → stomatocyte transition. Fig. 7 presents a schematic representation of both phenomena. That the classification of surfactants as echinocytogenic or stomatocytogenic can be based on only the net charge of the polar portion of the individual molecules (cationic or anionic) is generally accepted in the literature, but our results have proven that this generalization could lead to erroneous conclusions.Acknowledgements
Financial support of MINCyT (PICT 2013-00647), CONICET (PIP 0150) and UNLP (X11-682) are acknowledged. MEF and MH were awarded CONICET fellowship. HAA is UNLP Researcher. SRM and VH are members of CONICET Researcher Career. LB is member of CICPBA Researcher Career. EP is a member of the CONICET Support Professional Career Program. Dr Donald F. Haggerty, a retired academic career investigator and native English speaker, edited the final version of the manuscript.References
- M. R. Infante, L. Pérez, C. Morán, R. Pons and A. Pinazo, in Biobased surfactants and detergents. synthesis, properties and applications, ed. D. G. Hayes, D. Kitamoto, D. K. Y. Solaiman, R. D. Ashby, AOCS Press, Urbana, Illinois, 2009. Ch. 13, pp. 351–387 Search PubMed.
- A. Pinazo, M. A. Manresa, A. M. Marques, M. Bustelo, M. J. Espuny and L. F. Pérez, Adv. Colloid Interface Sci., 2016, 228, 17, DOI:10.1016/j.cis.2015.11.007.
- A. Singh and V. K. Tyagi, Tenside, Surfactants, Deterg., 2014, 51, 202–214, DOI:10.3139/113.110299.
- M. Rosa, N. Penacho, S. Simões, M. C. P. Lima, B. Lindman and M. G. Miguel, Mol. Membr. Biol., 2008, 25, 23–34, DOI:10.1080/09687680701499451.
- N. Lozano, L. Pérez, R. Pons and A. Pinazo, Amino Acids, 2011, 40, 721, DOI:10.1007/s00726-010-0710-4.
- L. Tavano, M. R. Infante, M. A. Riya, A. Pinazo, M. P. Vinardell, M. Mitjans, M. A. Manresa and L. Pérez, Soft Matter, 2013, 9, 306, 10.1039/c2sm26670a.
- M. E. Fait, G. L. Garrote, P. Clapés, S. E. Tanco, J. Lorenzo and S. R. Morcelle, Amino Acids, 2015, 47, 1465, DOI:10.1007/s00726-015-1979-0.
- W. J. W. Pape, U. Pfannenbecker and U. Hoppe, Mol. Toxicol., 1987, 1, 525 CAS.
- P. S. C. Preté, K. Gomes, S. V. P. Malheiros, N. C. Meirelles and E. De Paula, Biophys. Chem., 2002, 97, 45, DOI:10.1016/S0301-4622(02)00042-X.
- A. W. Jay, Biophys. J., 1975, 15, 205, DOI:10.1016/S0006-3495(75)85812-7.
- M. P. Sheetz and S. J. Singer, Proc. Natl. Acad. Sci. U. S. A., 1974, 71, 4457 CrossRef CAS.
- H. Heerklotz and J. Seelig, Biophys. J., 2000, 78, 2435, DOI:10.1016/S0006-3495(00)76787-7.
- A. Pinazo, R. Pons, L. Pérez and M. R. Infante, Ind. Eng. Chem. Res., 2011, 50, 4805, DOI:10.1021/ie1014348.
- C. Tanford, The hydrophobic effect: Formation of micelles and biological membranes, Wiley-Interscience, New York, 1980 Search PubMed.
- S. Dufour, M. Deleu, K. Nott, B. Wathelet, P. Thonart and M. Paquot, Biochim. Biophys. Acta, 2005, 1726, 87, DOI:10.1016/j.bbagen.2005.06.015.
- N. Joondan, P. Caumul, M. Akerman and S. Jhaumeer-Laulloo, Bioorg. Chem., 2015, 58, 117, DOI:10.1016/j.bioorg.2015.01.001.
- N. Joondan, S. Jhaumeer-Laulloo and P. Caumul, Microbiol. Res., 2014, 169, 675, DOI:10.1016/j.micres.2014.02.010.
- D. Lichtenberg, Biochim. Biophys. Acta, Biomembr., 1985, 821, 470 CrossRef CAS.
- U. Kragh-Hansen, M. le Maire and J. V. Møller, Biophys. J., 1998, 75, 2932, DOI:10.1016/S0006-3495(98)77735-5.
- M. C. A. Stuart and E. J. Boekema, Biochim. Biophys. Acta, Biomembr., 2007, 1768, 2681, DOI:10.1016/j.bbamem.2007.06.024.
- M. P. Sheetz, R. G. Painter and S. J. Singer, J. Cell Biol., 1976, 70, 193 CrossRef CAS PubMed.
- M. A. Vives, M. R. Infante, E. Garcia, C. Selve, M. Maugra and M. P. Vinardell, Chem.-Biol. Interact., 1999, 118, 1 CrossRef CAS PubMed.
Footnote |
| † Electronic supplementary information (ESI) available. See DOI: 10.1039/c7ra03640j |
| This journal is © The Royal Society of Chemistry 2017 |

