DOI:
10.1039/C7RA01937H
(Paper)
RSC Adv., 2017,
7, 37559-37567
The influence of carbon nanotubes and graphene oxide sheets on the morphology, porosity, surface characteristics and thermal and electrical properties of polysiloxane derived ceramics†
Received
16th February 2017
, Accepted 19th July 2017
First published on 28th July 2017
Abstract
Graphene oxide (GO) and multi-walled carbon nanotubes (MWCNT) were incorporated into a SiOC composite ceramic matrix using a simple roll-mixing method followed by thermal cross-linking and pyrolysis. The structure, morphology, porosity, surface characteristics, and thermal properties of polysiloxane are analysed using scanning electron microscopy, BET specific surface area, mercury intrusion porosimetry, water vapour and n-heptane adsorption, and Raman spectroscopy, respectively. The electrical conductivity, conduction mechanism, and percolation behavior of the composite ceramics are investigated by electrical impedance spectroscopy in the temperature range of 25–250 °C. Free-rising composite ceramic foams are generated, incorporating both nanofillers into the SiOC ceramic matrix. Both nanofillers show a positive effect on the thermal stability of the SiOC ceramics. The room temperature DC conductivity value of pure SiOC ceramics shows ∼2.97 × 10⁻⁹ S cm−1, which increases by three to four orders of magnitude after the incorporation of 5 wt% conductive nanofillers (∼2.5 × 10⁻⁶ S cm−1 for 5 wt% GO and ∼2.08 × 10⁻⁵ S cm−1 for 5 wt% MWCNT). The calculated activation energy from the Arrhenius plot for composite ceramics is found to be lower (0.10 eV for 5 wt% GO and 0.07 eV for 5 wt% MWCNT) compared to the same SiOC ceramics without nanofillers (0.22 eV). The conduction mechanism studies of composite ceramics suggest a non-Debye type distribution of relaxation in SiOC. Thus the nanofiller-enhanced SiOC ceramics are highly promising materials for rechargeable batteries, high-temperature fuel cells, gas sensors, display devices etc.
Introduction
Commercial energy storage and conversion technologies would greatly benefit from the discovery of a cheap and highly effective material with a unique structure.1,2 Recently, some special polymer-derived ceramics (PDC) have received considerable attention due to their peculiar properties, including high thermal and chemical stability, outstanding oxidation and corrosion resistance, unusual topologies, and pre-determinable pore size distribution. These properties make PDCs suitable candidates for various applications in biomedicine, information technology, aerospace and defense, and as high-temperature micro-sensors.3,4 However, PDCs have rarely been applied to the different energy applications5–9 and are still at an early stage of development due to their extremely low electrical conductivity at room temperature.3,4 The room-temperature DC (direct current) conductivity of PDCs can be improved by several orders of magnitude, by modifying the polymeric precursor, composition, pyrolysis temperature, pyrolysis atmosphere, and incorporation of conductive nanofillers.10–15 It has already been reported that the addition of different carbon allotropes, such as graphene oxide (GO) and multi-walled carbon nanotubes (MWCNT), to organic polymer matrices, improve the overall thermal, mechanical, and electrical properties of composite ceramics.16–18 Moreover, the added nanofillers influence the rheological behavior and the cross-linking of the PDCs, which further alter the physical and chemical properties of the ceramic matrix.18–21 In spite of the noticeable research on fillers incorporated PDCs, the electrical transport properties of the ceramics are only rudimentarily understood. Investigation of electrical transport properties is important to examine the viability of PDCs for electrochemical applications. In this context, numerous research reported that AC (alternating current) impedance spectroscopy is a very useful technique for exploring the hopping mechanisms and percolation thresholds for a number of materials;22–24 however, very limited data exist for polymer-derived ceramics.25–28 The AC impedance analysis of SiCN/CNT–ceramic nanocomposite shows the percolation thresholds for CNT loadings were lower than 1 vol% and a maximum conductivity of 7.6 × 10⁻² S cm−1 was observed at 5 vol% CNT.26 Using AC impedance technique, An et al. reported that the conduction mechanisms in SiOC, SiC, and SiCN based ceramics is generally governed by different hopping mechanisms with relaxation times at different phase (matrix and free carbon in series) present in the ceramics.25,28 Thus, it is deemed more pertinent to compare the frequency-dependent conductive behavior of different nanofillers (GO and MWCNT) incorporated SiOC ceramics.
Herein, we investigate the effects of different types of carbon-based nanofillers (in particular, GO prepared from graphite and commercial MWCNT) on the structure, morphology, porosity, surface characteristics, and thermal properties of polysiloxane derived ceramics. Further, we extend the systematic study of frequency and temperature-dependent conductivity behavior of nanofiller-incorporated SiOC ceramics at different temperatures (25–250 °C).
Experimental section
Preparation of composite ceramics
The nanofiller-incorporated (GO and MWCNT) SiOC composite ceramics were prepared using a roll-mixing method followed by thermal cross-linking and pyrolysis. A silicone resin poly(methyl phenyl silsesquioxane) (Silres®H44, WackerChemie AG), chemically modified graphene oxide (GO), and multi-walled carbon nanotubes (MWCNT) were used in this work. For the preparation of GO from graphite flakes (Sigma-Aldrich), a modified Hummer method was used. The stoichiometric amount of graphite, potassium persulfate, phosphorous oxide and sulphuric acid were mixed in a round bottom flask and refluxed at 80 °C for 4.5 h. Then DI water was added to the flask and continued the refluxing overnight followed by filtering and drying. The dried sample was transferred to ice bath with the slow addition of potassium permanganate with sulphuric acid, DI water and stirrer for 30 min. Then hydrogen peroxide was added to the solution followed by adding DI water. Finally, the solution was removed from ice bath and the powder was separated using centrifuging and drying. For better comparison, the commercial MWCNT (Nanochem) were used as purchased without any purification. In a typical preparation process, the silicone resin (H44) was mixed with different wt% (1, 3, 5, and 10 wt%) of nanofillers (GO and MWCNT) and milled in a universal roller for 6 h followed by cross-linking at 110 °C for 24 h (heating and cooling rate 20 °C h−1) on a Teflon sheet. The resulting solid cross-linked powders were taken in an alumina crucible and further pyrolysis at 1000 °C for 4 h in the nitrogen atmosphere with heating ramps of 120 °C h−1 until 900 °C and then 30 °C h−1 until 1000 °C. During pyrolysis the powder converted into a single piece of monolithic structure (Fig. S1†) what confirms that the solid cross-linked polymer is converted at least partially into a liquid via melting process during the pyrolysis before transferring into the ceramic monolith. For better comparison, the conductive fillers (GO and MWCNT) were thermally treated under same condition where GO was completely exfoliated and converted into reduced graphene oxide (rGO) sheets (Fig. S2†).
Characterization of composite ceramics
The decomposition behaviour of the cross-linked material under a nitrogen atmosphere and thermal stability of composite ceramics under an air atmosphere were measured with a thermogravimetric analyzer (STA 503 BÄHR) in the temperature range of 25–1000 °C using a heating rate of 10 °C min−1, and a nitrogen, air flow of 2 L h−1. The macrostructures of the monoliths were observed with a scanning electron microscope (SEM, Camscan Series 2, Obducat CamScan Ltd, 20 kV). Transmission electron microscope (TEM) measurements were performed using an FEI Titan 80, at 300 kV. The specific BET surface area of the powder sample (particle sizes ≤ 300 μm) was calculated after recording nitrogen adsorption/desorption isotherms with a Belsorp-Max (Bel Japan Inc.). Pore size distribution (meso-macro pore ranges from 0.01 to 100 micrometres) and open porosity were determined using mercury intrusion porosimetry (Pascal 140/440 POROTEC GmbH). The nature of the carbon phases in the composite ceramics was analyzed with a Raman microscope LabRam ARAMIS (Horiba Jobin Yvon) Horiba LabRam Aramis spectrometer equipped with a 532 nm laser. The elemental content (C and Si) in the composite ceramics was analyzed by elemental analysis (Mikroanalytisches Labor Pascher, Germany). Surface characteristics (water vapour and n-heptane adsorption) were measured by placing ∼0.5 g of dried sample in a glass vessel within a closed Erlenmeyer flask containing the liquid solvent at equilibrium with its vapour phase at room temperature for 24 h. The samples were weighed before and after the measurement in order to calculate the vapour uptake per m2 (via BET). For electrical conductivity measurements, the monolithic ceramic foams were crushed into powders which further pressed into form a pellet, and the both side of the pellets were coated with gold using a sputter coater (EMITECH K550). The AC impedance studies were carried out for the ceramic pellet sandwiched between highly polished stainless steel blocking electrodes by using an impedance analyzer (IM6ex Zahner® Elektrik) in the frequency range of 1 MHz to 10 mHz in the temperature range of 20–250 °C.22,24
Results and discussion
Thermal behavior
The thermogravimetric measurement was done in order to elucidate the influence of the nanofillers on the thermal behavior of the composite samples. Fig. 1(a and b) shows the decomposition behaviour of the nanofillers incorporated cross-linked samples (110 °C for 24 h) and compared with pure conductive fillers (GO and MWCNT) after the same treatment (110 °C for 24 h). In the temperature range of 400–600 °C the highest mass loss of approximately 15–30% is observed for cross-linked ceramic materials due to the decomposition of the organic groups.29 Samples then remain stable until 1000 °C. It was noticed that pure H44 have a higher mass loss than those incorporating nanofillers (GO and MWCNT) at various temperatures and different environments (Fig. 1a–d). Even though the GO shows poor thermal stability compared to bare H44 at 1000 °C, in the GO-containing ceramics the incorporated GO creates stronger chemical coupling with the ceramic matrix and combination of ceramics with GO shows the synergistic effect which makes them more stable one. The mass loss of GO-containing ceramics increased with increased GO content, due to the residual functional groups of GO being thermally reduced during the pyrolysis (for pure GO ∼60% loss without pre-treatment and ∼40% loss with pre-treatment done at 110 °C for 24 h). Whereas the mass loss of MWCNT-containing ceramics was not significantly affected even at a higher MWCNT content due to the incorporated MWCNT used, as purchased without any functionalization. The theoretical decomposition of the composite was calculated from the mass loss of each component measured separately and compared with the experimental mass loss of the compositions (Table 1). The experimental weight loss of ceramic matrix was much lower than the theoretical value calculated due to the incorporation of nanofillers, which significantly improve the overall thermal stability of the ceramic matrix by utilizing the synergistic effect.
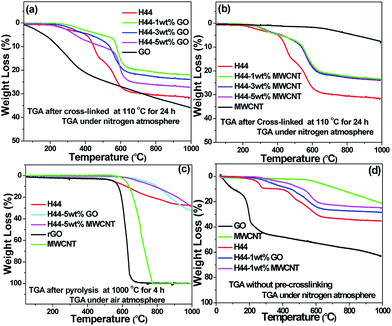 |
| | Fig. 1 (a and b) Thermograms of cross-linked (110 °C for 24 h) polymer H44 with different wt% ratios (1, 3, and 5) of fillers (GO and MWCNT) in a nitrogen atmosphere; (c) thermograms of pyrolyzed (1000 °C for 4 h) ceramic monoliths in an air atmosphere; (d) thermograms of all precursors without cross-linking steps. | |
Table 1 Calculated and experimental weight losses for cross-linked polymer H44 with different wt% ratios (1, 3, and 5) of fillers (GO and MWCNT)
| Filler incorporation |
Mass loss (%) |
| GO (%) |
MWCNT (%) |
| 1 |
3 |
5 |
1 |
3 |
5 |
| Experimental |
22 |
23.9 |
27.3 |
23.4 |
23.7 |
24 |
| Calculated |
31.8 |
32.3 |
32.7 |
31.6 |
31.4 |
31.2 |
For a better understanding of the influence of nanofillers on thermal stability of the composite ceramic monoliths, the decomposition behavior of the pyrolyzed samples (1000 °C for 4 h) are analyzed in the air atmosphere (Fig. 1c). The thermogram shows that thermally reduced graphene oxide (rGO) sheets and MWCNT were completely burned away at 800 °C.30 At 1000 °C, the weight loss of both GO and MWCNT-incorporated ceramic monoliths shows equal or little bit more than the bare H44 alone. The onset of the degradation of the bare SiOC started much earlier, whereas the composite material displays a delay in the onset of degradation and high thermal stability until it reaches 900 °C. Finally, the thermograms of the precursor are analyzed without cross-linking steps. The pure H44 precursor without cross-linking steps shows a higher mass loss of ∼4% than those of pure H44 after cross-linking due to the weight loss of OH groups which generally reacted during the cross-linking steps (Fig. 1a, b and d). Even in the filler incorporated composite precursors without cross-linking shows higher thermal stability than that of pure H44 (Fig. 1a, b and d). Overall, the thermal stability of the composite ceramics is much better than that of bare at different environment (before or after cross-linking process and after pyrolysis). The probable reasons for the improvement in the thermal stability of the composite ceramics are (i) that the incorporation of nanofillers possibly delay the onset of degradation and hinder the flux of degradation of organic product to some extent, (ii) thermal conductivity of composite ceramics was increased by adding nanofillers which could ease heat dissipation within the composite ceramic matrix, and (iii) the synergistic effect of covalent coupling between the nanofillers and ceramic matrix. Moreover, the added nanofillers influence the viscosity, rheological properties of the polymer matrix and the kinetics of the reaction, which further affected the decomposition behavior of ceramic matrix. A similar type of thermal stability trend was already noticed on nanofillers (GO and MWCNT) incorporated silicone foams by Miguel et al.18
Macrostructure and surface characteristics
The influence of nanofillers on morphology is shown in the SEM images (Fig. 2). The filler containing composite ceramics build foams with spherical, interconnected pores. The free rising of the foam was somewhat restricted for pure SiOC. With an increase in the content of both nanofillers, the isotropic structure with spherical cells was achieved with a high order of interconnected pores with pore diameter between 5 to 800 μm (Fig. 2 and 3). The viscosity and surface tension of the polymer matrix increased after the addition of both nanofillers, which considerably affecting the morphology of the composite matrix. Moreover, the added nanofillers act as additional cross-link points in the composite matrix which influence the rheological properties of the polymer and the cross-linking (degree of cross-linking) of the preceramic polymer, further affecting the formation of cellular structure.18,19 The added fillers exfoliated to certain extent under thermal treatment which will influence the surface property by altering the porosity. In the GO and MWCNT-incorporated SiOC ceramics, it is quite difficult to distinguish the nanofillers from the ceramic matrix. During the pyrolysis stage, the solid cross-linked powders were converted into a single piece of monolithic structure which confirms that the solid cross-linked polymer is converted into a liquid before transferring into the ceramic monolith. Being liquid, the ceramic matrix avoids the aggregation of nanofillers (GO and MWCNT) in the ceramic matrix and improve the effective embedding of conductive nanofillers to some extent (Fig. S1†). The MWCNT-incorporated composites showed few agglomerations of MWCNTs distributed on the surface may be due to the non-functionalized nature of MWCNT (Fig. 2f).
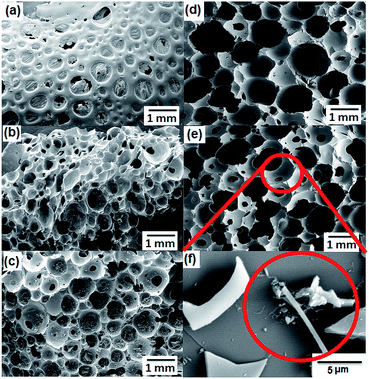 |
| | Fig. 2 SEM images of pyrolyzed H44 monoliths with different wt% ratios of fillers (GO and MWCNT). (a) Pure H44; (b) 1 wt% GO; (c) 5 wt% GO; (d) 1 wt% MWCNT; and (e and f) 5 wt% MWCNT; (f) magnified view with MWCNT distribution marked by red circle. | |
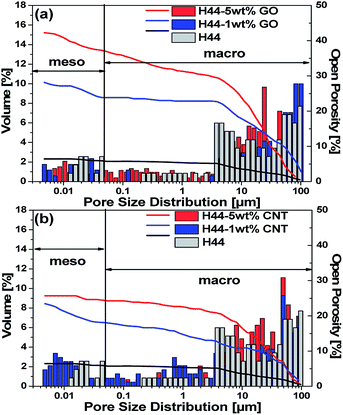 |
| | Fig. 3 Comparison of pore size distribution versus relative pore volume curves and open porosity obtained from Hg-porosimetry of pyrolyzed samples: (a) H44-(0, 1, 5) wt% GO; (b) H44-(0, 1, 5) wt% GO  where as represents the volume and; where as represents the volume and;  represents the open porosity. represents the open porosity. | |
With the increase in filler content, the open porosity and interconnectivity of cell windows increase, which was further characterized by mercury porosimetry measurements (the porosity between 0.01 to 100 micrometers can be detected using Hg-porosimetry) (Fig. 3).18,31 The big influence of the nanofillers on the macroscopic structure is confirmed by an increase in the sizes of the cell windows and an open porosity. The bare sample shows an open porosity of 6%, which has been increased by 45% for 5 wt% GO and 25% for 5 wt% MWCNT-incorporating composite ceramics. Thus, the filler shape affects the open porosity of the samples with a high open porosity of about 45% for 5 wt% GO, which can even be seen in the TGA with a higher mass loss for GO-containing ceramics. Furthermore, the addition of both nanofillers has a slight influence on mesoporosity, creating a wider pore distribution.
From the N2 adsorption–desorption isotherm curves, the composite ceramics show a typical type II isotherm, indicating a monolayer formation on a macroporous surface, which is even common for ceramics pyrolyzed at 1000 °C (Fig. 4). Among them, the sample with highest amount of nanofillers (GO and MWCNT) exhibit multi-monolayer formation (successive layers) may be due to a wide distribution of pore sizes which was even confirmed by Hg-porosimetry analysis. The sample H44-10 wt% GO exhibit hysteresis around 0.45 to 0.65 P/Po with less N2 adsorption due to the existence of significantly less meso-porous nature created by the incorporation of GO later converted to thermally exfoliated rGO (Fig. S2 and S3, Table S1†). A sharp increase of N2 adsorption in the higher relative pressure clearly indicates the macroporous behavior which is prominent in samples with a higher amount of nanofillers as a result of spherical, and interconnected pores (Fig. 2). The BET surface area of the bare SiOC samples was found to be 1.8 m2 g−1, which increased with increasing filler content and reaches 10.1 m2 g−1 for 10 wt% GO and 28.5 m2 g−1 for 10 wt% MWCNT incorporated SiOC. A slight increase in the surface areas of the composite ceramics with the addition of either nanofiller into the ceramic matrix can be attributed to the influence of nanofillers which thermally exfoliated and generated very high surface area (rGO 195 m2 g−1 and MWCNT 94 m2 g−1 at 1000 °C) on the macroporous ceramic structures (Fig. S3†).32 Finally, using the nanofillers allows not only for getting the free rising ceramic foams; but also for tailoring the pore size distribution.
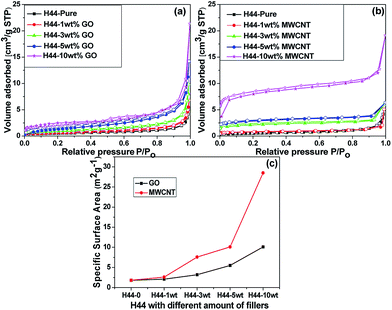 |
| | Fig. 4 (a and b) Comparison of N2 adsorption–desorption isotherms of pyrolyzed H44 ceramics with different wt% ratios (1, 3, 5 and 10) of fillers (GO and MWCNT); (c) and corresponding specific BET surface areas. | |
The influence of nanofillers in the disordered nature of the free carbon phase in the composite ceramics was characterized by Raman spectrum.33 The deconvoluted Raman spectrum shows two major peaks corresponding to the disorder peak (D-band), at 1350 cm−1 and the graphitic peak (G-band) at 1600 cm−1 (Fig. S4†). These are due to the A1g vibrational mode involving phonons near the K zone boundary, and the E2g vibrational mode, involving the in-plane bond-stretching motion of pairs of C sp2 atoms, respectively. Further, two minor peaks corresponding to the ν3 bond (1200 cm−1) and ν1 bond (1500 cm−1) of polyolefinic chains in the SiOC may be integrated into the aromatic domains by, e.g., a Diels–Alder reaction.26,34 The intensity ratio of the D and G bands (i.e. IG/ID ratio) helps to estimate the defects of the composite ceramics.35 The calculated IG/ID ratios of pure SiOC is 0.78 which is increased to 0.99 for 5 wt% GO-incorporated SiOC. The composite ceramics show an increase in the G-band/D-band ratio compared to pure SiOC, suggesting a high degree of graphitization with few defects. With the addition of nanofiller (GO) into the PDC matrix, the graphitization grade GG (i.e. IG/(IG + ID)) increases from 44% (pure SiOC) to 50% (5 wt% GO-incorporated SiOC) which further confirms the enhancement of graphitization nature. From the elemental analysis, the carbon content in the pure SiOC is 27.3 wt%, which increases to 38.6 wt% and 46.6 wt% for 5 wt% GO- and MWCNT-containing composite ceramics, respectively. Even with 5 wt% nanofillers, the carbon content increased significantly into the composite ceramic matrix. The higher carbon content in the SiOC matrix is possibly due to the incorporation of both nanofillers in the ceramic matrix which remarkably alters the viscosity, rheological properties of the polymer matrix and the kinetics of the reaction, which further affected the carbon decomposition behavior of ceramic matrix. Moreover, the incorporated nanofillers delay the onset of degradation and hinder the flux of degradation of carbon content to some extent from the ceramic matrix. Then the surface characteristics of nanofiller-containing SiOC ceramic materials were tested with the maximum adsorption of polar (H2O) and non-polar (heptane) vapors (Fig. 5). The pure SiOC ceramics pyrolyzed at 1000 °C showed higher water adsorption than heptane, indicating a higher degree of decomposition of methyl groups in the H44 precursor, resulting in a relatively higher amount of hydrophilic silica content.36 The heptane adsorption increased from 0.368 mmol m−2 for pure SiOC to 0.628 and 0.754 mmol m−2 for 5 wt% GO- and 5 wt% MWCNT-containing ceramics respectively. By contrast, the water adsorption drops strongly, from 0.878 mmol m−2 for pure SiOC to 0.244 and 0.179 mmol m−2 for 5 wt% GO- and 5 wt% MWCNT-containing ceramics, respectively. With the nanofiller incorporation, the hydrophilic silica content decreases comparatively compared with overall hydrophobic carbon content, resulting in an overall decrease of the water adsorption with increasing hydrophobic surface properties. The hydrophobic properties increased with increasing the nanofiller content. Compared to pure H44 samples with a carbon content of 27.3%, 5 wt% GO-incorporated ceramics samples with a carbon content of 38.6 wt% became a more hydrophobic nature. Even more increased the hydrophobic nature for 5 wt% MWCNT-incorporated ceramics with a carbon content of 46.6 wt%. The surface characteristics results indicate that the surface properties can be tuned by adding a different amount of carbon-based nanofillers in the ceramic matrix.
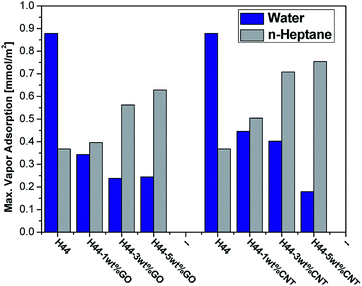 |
| | Fig. 5 Max. n-heptane and water vapor adsorption of composite ceramics measured at room temperature; the data were normalized using the specific BET surface area from N2 adsorption. | |
AC impedance analysis
Using impedance spectroscopy the sample is simply perturbed with an alternating current or voltage signal of small magnitude and the electrical response of the sample is measured in terms of resistive, capacitive, or inductive behavior in order to the study the dielectric and transport properties of the materials.22 The complex impedance quantity is better expressed as| |
Z(ω) = |Z|cos![[thin space (1/6-em)]](https://www.rsc.org/images/entities/char_2009.gif) ϕ − j|Z|sin ϕ − j|Z|sin![[thin space (1/6-em)]](https://www.rsc.org/images/entities/char_2009.gif) ϕ ϕ
| (1) |
where |Z| and ϕ are the magnitude and phase angle, Z′ and Z′′ are the real and imaginary parts of complex impedance, ω (ω = 2Ωf, where f is the frequency) is the angular frequency, and j = (−1)1/2.37 Fig. 6 shows the Nyquist (Cole–Cole) plots of bare and conductive filler incorporated ceramics in the frequency range of 1 mHz to 1 MHz measured in the temperature range of 25–250 °C. The ceramic samples show a single semicircle over frequency due to the parallel combination of bulk resistance (Rb) and bulk capacitance (Cb) of the material.38 The semicircles are depressed; the centers lying below the real axis are due to the distributed microscopic material properties. This indicates that the distributions of relaxation time follow a non-Debye pattern in the materials. Because of this, the bulk capacitance was replaced with constant phase element (CPE), and are represented in its equivalent circuit.38 The polycrystalline materials generally show two semicircles due to conductions via grain and via grain boundary; the polysiloxane derived ceramics pyrolyzed at 1000 °C shows a single semicircle due to its amorphous nature with no grain boundaries for conduction. In contrast to previous literature, where data were reported for SiOC materials prepared at T ≥ 1000 °C showing two semicircles resulting from the charge transport in the matrix and free carbon, whereas in this analysis observed a single semicircle.25 This difference was attributed to the addition of conductive nanofillers (GO and MWCNT) to the ceramic matrix. The uniform distribution of conductive nanofillers forms a percolation path for conduction in the ceramic matrix which shows the similar effect like free carbon phase exists in the ceramic matrix. As the measuring temperature and filler concentration were increased, it was observed that the intersection of the semicircle with the real axis shifts towards the origin, indicating a decrease in Rb. After adding nanofillers to the ceramic matrix, the Rb at room temperature decreases from 50 MΩ for pure SiOC to 80 kΩ and 7 kΩ for 5 wt% GO- and 5 wt% MWCNT-containing ceramics, respectively. The decrease in the resistance of the composite ceramics is possibly due to the formation of the nice percolation paths provided by the incorporated conductive fillers. At low-frequency region, the pure SiOC sample shows inductive behavior which is most probably due to the adsorption process at the electrode surface.
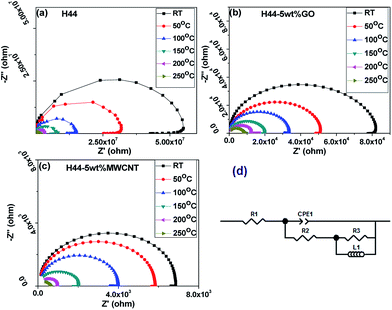 |
| | Fig. 6 Complex impedance spectra (Nyquist plots) of composite ceramics measured at various temperatures (RT–250 °C); (a) pure H44; (b) H44-5 wt% GO; (c) H44-5 wt% MWCNT and; (d) corresponding equivalent circuit. | |
Conduction and hopping mechanism
The frequency dependent conductivity for bare and fillers incorporated composite ceramic samples is shown in the Fig. 7. The corresponding electrical conductivity (σω) values were calculated using the formula,where R is the experimentally measured impedance, L is the sample thickness, and AC is the cross-sectional area of the measured pellet. The conductance spectrum exhibits two distinguishable regions; a low-frequency plateau followed by a high-frequency dispersion.38 In the low-frequency region, the conductivity is almost found to be frequency-independent, and the corresponding value is the DC conductivity of the material. In the high-frequency region, the conductivity increases with frequency, which indicates a relaxation process. Moreover, the transition from the frequency-independent region to the frequency-dependent region exists for almost all samples at different temperatures, which indicates the relaxation phenomenon exists for all samples. The frequency dependence of conductivity follows a Jonscher's power-law behavior, and the expression is given by39where σω is the AC conductivity, σdc is the DC conductivity, A is a pre-exponential constant, ω is the angular frequency, and n is the power law exponent; where 0 < n < 1. It can be seen that, as the conductivity increases with the addition and increment of both nanofillers and increasing the measuring temperature, which suggest that the composite SiOC ceramics exhibit semiconducting behavior.3 The DC conductivity value of pure SiOC ceramics, measured at room temperature, was found to be ∼2.97 × 10⁻⁹ S cm−1, which has been increased by three to four orders of magnitude with the incorporation of 5 wt% of conductive nanofillers (∼2.5 × 10⁻⁶ S cm−1 for 5 wt% GO- and ∼2.08 × 10⁻⁵ S cm−1 for 5 wt% MWCNT-incorporated ceramics). The pure hybrid ceramics prepared at 600 °C can be better termed as insulators, with a room temperature conductivity of ∼7.0 × 10⁻¹² S cm−1. The temperature-dependent conductivity results indicate that there is a one order of magnitude enhancement in the DC conductivity for all samples measured at 250 °C compared with room temperature conductivity.
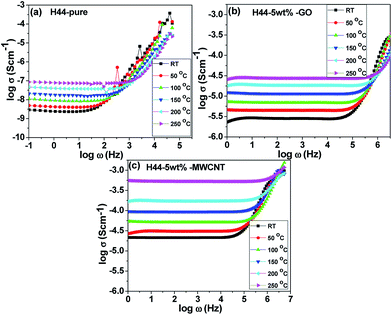 |
| | Fig. 7 Conductance spectrum of composite ceramics measured at various temperatures (RT–250 °C); (a) pure H44; (b) H44-5 wt% GO; (c) H44-5 wt% MWCNT. | |
Further, the temperature dependence of DC conductivity (σdc) is found to obey the Arrhenius equation,
| |
σdc = σ1![[thin space (1/6-em)]](https://www.rsc.org/images/entities/char_2009.gif) exp(−Ea/kT) exp(−Ea/kT)
| (5) |
where
σ1 is the pre-exponential factor,
T is the absolute temperature (in kelvin),
k is the Boltzmann constant, and
Ea is the activation energy.
Fig. 8a shows the temperature dependent DC conductivity of the composite ceramics and the linear fit to this graph yields the activation energy (
Ea). The corresponding energy of activation for pyrolyzed H44 ceramics with different wt% of nanofillers are shown in
Fig. 8b. The calculated activation energy for composite ceramics is found to be lower (0.10 eV for 5 wt% GO and 0.07 eV for 5 wt% MWCNT) compared to the pure SiOC ceramics (0.22 eV). It may be due to the creation of better percolation paths for conduction and increases in conductive carbon content after the addition of nanofillers.
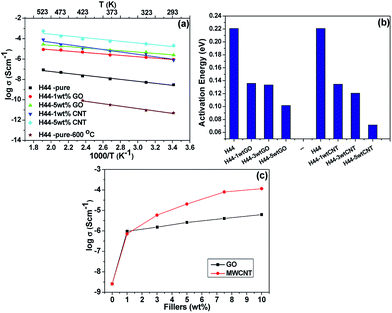 |
| | Fig. 8 (a) Arrhenius plot; (b) energy of activation of composite ceramics with different wt% ratios (1, 3, and 5) of fillers (GO and MWCNT); (c) AC conductivities of composite ceramics as function of conductive filler content at room temperature. | |
In order to understand the percolation threshold limit for filler concentration (as wt% of GO and MWCNTs) in SiOC ceramics, the electrical conductivity of composite ceramics is plotted with nanofiller concentrations and shown in Fig. 8c. Initially, the conductivity increases by up to three orders of magnitude when incorporating 1 wt% GO or MWCNT (0.72 vol% GO and 0.58 vol% MWCNT) in the polymer matrix.40 Further conductivity increases are moderate, with one order of magnitude in GO and two orders of magnitude in MWCNT by adding 5 wt% fillers. Afterwards, the conductivity can be increased by a further one order of magnitude by increasing the nanofiller content in the composites by up to 10 wt%. The major increase in conductivity at up to 1 wt% nanofillers, and moderate increases at higher nanofiller content, most likely shows that the percolation threshold is lower than 1 wt% of GO or MWCNT (less than 1 vol% of fillers). With further addition possibly tends to forms more agglomeration of nanofillers within the ceramic matrix.26,40–43
According to the percolation theory, the electrical conductivity of composite ceramics with a percolative system is generally described as a function of volume fraction.14,44 Composite ceramics should obey the scaling law
where
σdc is the DC conductivity of composite ceramics (S cm
−1),
σ2 is an adjustable parameter,
ρ is the volume fraction of the filler,
ρc is the percolation threshold, and
t is the critical exponent that reflects the dimensionality of transport within the composite ceramics, with values typically around 1.3 and 2.0 for two and three dimensions, respectively.
26,45 Fig. 9 represents the fitting of the scaling law with experimentally-measured conductivity data as a function of
ρ −
ρc (
ρc = 0.2 and 0.5) expressed as a function of volume fraction. When threshold limits
ρc = 0.2, the conductivity values are very well fit by the scaling law, which suggests that low concentrations of nanofillers in a polymer matrix yield high-performance composites by simply capitalizing the properties of the nanoscale fillers. The very low percolation thresholds have been attributed to both nanofillers (GO or MWCNT), which emphasizes the good dispersion of the nanofillers throughout the SiOC matrix and the high aspect ratio of the nanofillers. The calculated scaling exponent values are 1.39 and 1.89 for GO- and MWCNT-incorporating SiOC, respectively, which is higher than the theoretical value for two-dimensional transport (
t > 1.35). This suggests that incorporated nanofillers favor three-dimensional transport within the SiOC ceramic matrix.
42,46
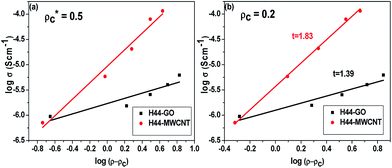 |
| | Fig. 9 DC conductivity as a function of ρ − ρc for composite ceramics (ρ is the volume fraction of the filler, ρc is the percolation threshold) with different filler (GO and MWCNT) ratios (a) ρc = 0.5 (approximate); (b) ρc = 0.2 (perfect fit). | |
Further, to investigate and understand the conduction mechanism of SiOC ceramics more clearly, the complex modulus and dielectric analysis were analyzed at different frequencies (Fig. S5 & S6†).47 The relaxation behavior is investigated using the complex electric modulus
| | |
M* = M′ + iM′′ = jωCoZ*
| (7) |
where
M′ and
M′′ are the real and imaginary components of the modulus spectrum.
Co is the vacuum capacitance of the empty measuring cell. The typical modulus spectrum (
M′′) shows a broad, asymmetric, non-Lorentzian type curve with a peak at the relaxation frequency (
fmax) showing the non-Debye type behavior (Fig. S5
†). Non-Debye type spectra can be a consequence of the distribution of relaxation times, themselves a result of distributions of different energy barriers.
48 With the addition and increment of nanofillers and increases in the measuring temperature, the peak frequencies shift forward, indicating a shorter relaxation time. At low frequency; the region left of the peak maximum (the long tail), is due to the charge carriers being mobile over long distances. At high frequency; the region right of the peak maximum, the charge carrier motion is generally confined well within the nearby potential with a shorter relaxation time.
24 The dielectric properties of composite ceramics may be characterized by frequency-dependent parameters, such as complex permittivity (
ε*), which may define the reciprocal of the electric modulus (
M*)
| | |
ε* = ε′ + iε′′ = 1/M*
| (8) |
where
ε′ and
ε′′ are the real and imaginary parts of the dielectric permittivity. At low frequency, the dielectric content for pure insulating SiOC ceramics is very low, due to negligible space-charge effects (Fig. S6
†). With the introduction and addition of nanofiller, the dielectric content of ceramics increases significantly. The addition of conductive fillers influences the hopping mechanism, which results in a high dielectric constant with large numbers of space-charge layers at the electrodes.
46,47 At high frequency, the dielectric constant stops changing, which might be due to the periodic reversal of the AC field, resulting in no charge accumulation at the interface.
Finally, it is more interesting to investigate the hopping mechanism used for SiOC ceramics at different measuring frequencies (lower and higher frequency regions) and temperatures (Fig. S7†). At lower frequency region, the conductivity is more independent of frequency, so the effect of measuring temperature influence on DC conductivity (σdc) is analyzed using the relation
| |
σdc = σ3![[thin space (1/6-em)]](https://www.rsc.org/images/entities/char_2009.gif) exp[(−T1/T)1/β] exp[(−T1/T)1/β]
| (9) |
where
σ3 is an exponential factor,
T1 is a characteristic temperature, and
β is a constant that represents the conduction mechanism at a lower frequency. From the DC conductivity plot, pure SiOC ceramics show the best conductance fit when
β = 4 (
vs. β = 1, 2, or 3) (Fig. S7a
†). This supports the idea that low frequency conduction is supported by a hopping mechanism where charge carriers are in between the localized states.
28,49,50 In the higher frequency region, conductivity is more dependent on frequency, so the effects of measuring temperature at characteristic frequencies (
ωc) are analyzed using the relation
| |
ωc = ωo![[thin space (1/6-em)]](https://www.rsc.org/images/entities/char_2009.gif) exp[(−T2/T)1/γ] exp[(−T2/T)1/γ]
| (10) |
where
ωo and
T2 are an exponential factor and characteristic temperature, and
γ is a constant that further explains the conduction mechanism in the higher frequency region. From the characteristic frequency, with the temperature plot at a higher frequency, a value of
γ = 4 provides the best overall fit, again indicating the existence of a hopping mechanism at higher frequencies (Fig. S7b
†).
28,49,50
Conclusions
The physical properties of polysiloxane-derived ceramic composites are discussed after incorporating GO and MWCNT into SiOC composite ceramics via roll-mixing method followed by thermally cross-linking and pyrolysis. The free-rising composite ceramic foams were generated by incorporating both nanofillers into a SiOC matrix. Both nanofillers had a positive effect on thermal stability by shifting the degradation temperature upwards. A notable increase in electrical conductivity has been observed by introducing very small amounts of both conductive nanofillers, which forms a percolation path for conduction in the insulating SiOC ceramics. The frequency-dependent conductance spectra reveal non-Debye type relaxation in SiOC with a distribution of the relaxation processes. The very low percolation threshold of 0.2 vol% has been observed for both nanofillers (GO or MWCNT), which emphasizes that a low concentration of nanofillers to polymer matrix yields high-performance composites, by simply capitalizing the properties of the nanoscale fillers. The calculated scaling exponent value (t) is higher than 1.35, which suggests that incorporated nanofillers favor three-dimensional transport within the insulating SiOC matrix. Thus the addition of both nanofillers has a strong influence on the morphology, porosity, surface characteristics, and thermal and electrical properties of polysiloxane-based ceramics. Finally, the impedance result suggests that the GO and MWCNT into SiOC composite ceramics is an efficient material for high-temperature fuel cells applications.
Acknowledgements
This work was supported by German Research Foundation (DFG) within the Research Training Group GRK 1860 “Micro-, meso- and macroporous nonmetallic Materials: Fundamentals and Applications” (MIMENIMA).
References
- L. Dai, Y. Xue, L. Qu, H.-J. Choi and J.-B. Baek, Chem. Rev., 2015, 115, 4823–4892 CrossRef CAS PubMed.
- X. Wang, Q. Weng, Y. Yang, Y. Bando and D. Golberg, Chem. Soc. Rev., 2016, 45, 4042–4073 RSC.
- P. Colombo, G. Mera, R. Riedel and G. D. Sorarù, J. Am. Ceram. Soc., 2010, 93, 1805–1837 CAS.
- B. V. Manoj Kumar and Y.-W. Kim, Sci. Technol. Adv. Mater., 2010, 11, 44303 CrossRef CAS PubMed.
- H. Fukui, Y. Harimoto, M. Akasaka and K. Eguchi, ACS Appl. Mater. Interfaces, 2014, 6, 12827–12836 CAS.
- J. Kaspar, M. Graczyk-Zajac and R. Riedel, J. Power Sources, 2013, 244, 450–455 CrossRef CAS.
- L. David, R. Bhandavat, U. Barrera and G. Singh, Nat. Commun., 2016, 7, 10998 CrossRef CAS PubMed.
- J.-F. Drillet, M. Adam, S. Barg, A. Herter, D. Koch, V. Schmidt and M. Wilhelm, in ECS The Electrochemical Society, 2010, vol. 28, pp. 13–24 Search PubMed.
- C. Harms, M. Adam, K. A. Soliman, M. Wilhelm, L. A. Kibler, T. Jacob and G. Grathwohl, Electrocatalysis, 2014, 5, 301–309 CrossRef CAS.
- K. Wang, X. Li, B. Ma, Y. Wang, L. Zhang and L. An, Appl. Phys. Lett., 2014, 104, 221902 CrossRef.
- K. Wang, B. Ma, X. Li, Y. Wang and L. An, J. Am. Ceram. Soc., 2014, 97, 2135–2138 CrossRef CAS.
- A. M. Hermann, Y. Wang, P. A. Ramakrishnan, D. Balzar, L. An, C. Haluschka and R. Riedel, J. Am. Ceram. Soc., 2001, 64, 2260–2264 Search PubMed.
- J. Wei, T. Vo and F. Inam, RSC Adv., 2015, 5, 73510–73524 RSC.
- J. Z. Kovacs, B. S. Velagala, K. Schulte and W. Bauhofer, Compos. Sci. Technol., 2007, 67, 922–928 CrossRef CAS.
- L. An, W. Xu, S. Rajagopalan, C. Wang, H. Wang, Y. Fan, L. Zhang, D. Jiang, J. Kapat, L. Chow, B. Guo, J. Liang and R. Vaidyanathan, Adv. Mater., 2004, 16, 2036–2040 CrossRef CAS.
- N. V. Godoy, J. L. Pereira, E. H. Duarte, C. R. T. Tarley and M. G. Segatelli, Mater. Chem. Phys., 2016, 175, 33–45 CrossRef CAS.
- Y. Zhang, X. Yin, F. Ye and L. Kong, J. Eur. Ceram. Soc., 2014, 34, 1053–1061 CrossRef CAS.
- R. Verdejo, C. Saiz-Arroyo, J. Carretero-Gonzalez, F. Barroso-Bujans, M. A. Rodriguez-Perez and M. A. Lopez-Manchado, Eur. Polym. J., 2008, 44, 2790–2797 CrossRef CAS.
- S. Kokott, L. Heymann and G. Motz, J. Eur. Ceram. Soc., 2008, 28, 1015–1021 CrossRef CAS.
- Y. Li, L. Fernandez-Recio, P. Gerstel, V. Srot, P. A. Van Aken, G. Kaiser, M. Burghard and J. Bill, Chem. Mater., 2008, 20, 5593–5599 CrossRef CAS.
- Y. Katsuda, P. Gerstel, J. Narayanan, J. Bill and F. Aldinger, J. Eur. Ceram. Soc., 2006, 26, 3399–3405 CrossRef CAS.
- M. Prabu, S. Selvasekarapandian, a. R. Kulkarni, S. Karthikeyan, G. Hirankumar and C. Sanjeeviraja, Solid State Sci., 2011, 13, 1714–1718 CrossRef CAS.
- E. Barsoukov and J. R. Macdonald, Impedance Spectroscopy, John Wiley & Sons, Inc., Hoboken, NJ, USA, 2005 Search PubMed.
- M. Prabu and S. Selvasekarapandian, Mater. Chem. Phys., 2012, 134, 366–370 CrossRef CAS.
- K. Wang, B. Ma, Y. Wang and L. An, J. Am. Ceram. Soc., 2013, 96, 1363–1365 CrossRef CAS.
- E. Ionescu, A. Francis and R. Riedel, J. Mater. Sci., 2009, 44, 2055–2062 CrossRef CAS.
- D. S. McLachlan, C. Chiteme, C. Park, K. E. Wise, S. E. Lowther, P. T. Lillehei, E. J. Siochi and J. S. Harrison, J. Polym. Sci., Part B: Polym. Phys., 2005, 43, 3273–3287 CrossRef CAS.
- B. Ma, Y. Wang, K. Wang, X. Li, J. Liu and L. An, Acta Mater., 2015, 89, 215–224 CrossRef CAS.
- M. Scheffler, T. Gambaryan-Roisman, T. Takahashi, J. Kaschta, H. Muenstedt, P. Buhler and P. Greil, Ceram. Trans., 2000, 239–250 CAS.
- M. Prabu, P. Ramakrishnan, H. Nara, T. Momma, T. Osaka and S. Shanmugam, ACS Appl. Mater. Interfaces, 2014, 6, 16545–16555 CAS.
- J. Shen, C. Zeng and L. J. Lee, Polymer, 2005, 46, 5218–5224 CrossRef CAS.
- D. Kim, D. W. Kim, W. G. Hong and A. Coskun, J. Mater. Chem. A, 2016, 4, 7710–7717 CAS.
- A. C. Ferrari and J. Robertson, Phys. Rev. B: Condens. Matter Mater. Phys., 2000, 61, 14095–14107 CrossRef CAS.
- F. Roth, C. Schmerbauch, E. Ionescu, N. Nicoloso, O. Guillon and R. Riedel, Journal of Sensors and Sensor Systems, 2015, 4, 133–136 CrossRef.
- Y. Ren, B. Yang, X. Huang, F. Chu, J. Qiu and J. Ding, Solid State Ionics, 2015, 278, 198–202 CrossRef CAS.
- H. Zhang, P. D'Angelo Nunes, M. Wilhelm and K. Rezwan, J. Eur. Ceram. Soc., 2016, 36, 51–58 CrossRef CAS.
- J. R. Macdonald, Electrochim. Acta, 1990, 35, 1483–1492 CrossRef CAS.
- M. Prabu, S. Selvasekarapandian, M. V. Reddy and B. V. R. Chowdari, J. Solid State Electrochem., 2012, 16, 1833–1839 CrossRef CAS.
- A. K. Jonscher, Nature, 1977, 267, 673–679 CrossRef CAS.
- T. N. Zhou, X. D. Qi and Q. Fu, eXPRESS Polym. Lett., 2013, 7, 747–755 CrossRef CAS.
- L. Fernández-García, M. Suárez, J. L. Menéndez, C. Pecharromán, R. Menéndez and R. Santamaría, Nanoscale Res. Lett., 2015, 10, 216 CrossRef PubMed.
- S. Rul, F. Lefèvre-schlick, E. Capria, C. Laurent and A. Peigney, Acta Mater., 2004, 52, 1061–1067 CrossRef CAS.
- F. Dalcanale, J. Grossenbacher, G. Blugan, M. R. Gullo, J. Brugger, H. Tevaearai, T. Graule and J. Kuebler, J. Eur. Ceram. Soc., 2015, 35, 2215–2224 CrossRef CAS.
- F. M. Blighe, Y. R. Hernandez, W. J. Blau and J. N. Coleman, Adv. Mater., 2007, 19, 4443–4447 CrossRef CAS.
- M. Basta, V. Picciarelli and R. Stella, Eur. J. Phys., 1994, 15, 97–101 CrossRef CAS.
- L. He and S. C. Tjong, Nanoscale Res. Lett., 2013, 8, 132 CrossRef PubMed.
- I. M. Hodge, M. D. Ingram and A. R. West, J. Electroanal. Chem. Interfacial Electrochem., 1976, 74, 125–143 CrossRef CAS.
- M. Ram and S. Chakrabarti, J. Phys. Chem. Solids, 2008, 69, 905–912 CrossRef CAS.
- K. Wang, X. Li, B. Ma, M. Zhang, J. Liu, Y. Wang, L. Zhang and L. An, J. Am. Ceram. Soc., 2015, 98, 2153–2158 CrossRef CAS.
- R. M. Hill, Phys. Status Solidi A, 1976, 34, 601–613 CrossRef CAS.
Footnote |
| † Electronic supplementary information (ESI) available. See DOI: 10.1039/c7ra01937h |
|
| This journal is © The Royal Society of Chemistry 2017 |
Click here to see how this site uses Cookies. View our privacy policy here.  Open Access Article
 a,
Michaela Wilhelm*a and
Kurosch Rezwanab

![[thin space (1/6-em)]](https://www.rsc.org/images/entities/char_2009.gif) ϕ − j|Z|sin
ϕ − j|Z|sin![[thin space (1/6-em)]](https://www.rsc.org/images/entities/char_2009.gif) ϕ
ϕ

![[thin space (1/6-em)]](https://www.rsc.org/images/entities/char_2009.gif) exp(−Ea/kT)
exp(−Ea/kT)
![[thin space (1/6-em)]](https://www.rsc.org/images/entities/char_2009.gif) exp[(−T1/T)1/β]
exp[(−T1/T)1/β]
![[thin space (1/6-em)]](https://www.rsc.org/images/entities/char_2009.gif) exp[(−T2/T)1/γ]
exp[(−T2/T)1/γ]


