 Open Access Article
Creative Commons Attribution 3.0 Unported Licence
Amorphous FeF3/C nanocomposite cathode derived from metal–organic frameworks for sodium ion batteries†
Liguo Zhanga,
Shaomin Ji*c,
Litao Yua,
Xijun Xub and
Jun Liu *b
*b
aSchool of Materials Science and Engineering, Xiangtan University, Xiangtan 411105, PR China
bSchool of Materials Science and Engineering, Guangdong Provincial Key Laboratory of Advanced Energy Storage Materials, South China University of Technology, Guangzhou, 510641, PR China. E-mail: msjliu@scut.edu.cn
cSchool of Chemical Engineering and Light Industry, Guangdong University of Technology, Guangzhou, 510006, China. E-mail: smji@gdut.edu.cn
First published on 3rd May 2017
Abstract
Amorphous FeF3/C nanocomposites, where FeF3 nanoparticles are intimately anchored into a highly-graphitized porous branch-like carbon framework, have been successfully designed and fabricated from the carbonized Fe–MOFs by a novel vapor-solid fluoridation reaction and dehydration reaction. Compared to the FeF3/C nanocomposites obtained from the precursors at various carbonization conditions, the one carried out at 700 °C for 3 h exhibits the most outstanding comprehensive sodium ion storage performance. It can deliver 302, 146, 73 mA h g−1 discharge capacities at current densities of 15, 150, 1500 mA g−1, respectively, exhibiting an excellent sodium ion capacity and rate performance. Moreover, it displays a good cycling performance with a discharge capacity of 126.7 mA h g−1 at 75 mA g−1 after 100 cycles. The outstanding electrochemical features of the FeF3/C nanocomposites could be attributed to its amorphous structure and highly-graphited porous carbon framework, which is beneficial to the ionic and electronic transport and the reaction kinetics of electrode materials.
1. Introduction
The past few decades have witnessed a huge development in lithium ion batteries (LIBs), owing to a great requirement of energy storage,1 generating some problems at the same time, such as the lack of lithium resource, and the battery capacities falling far short of practical demands.2 However, sodium resources are inexhaustible around the world. Sodium is located beneath lithium in the periodic table, which means that sodium has numerous similarities with lithium in chemical and physical properties. Given this background, sodium has emerged as a prospective charge-carrier material for chargeable batteries. To date, intercalated layered cathode materials, such as layered oxides (NaxMO2 (ref. 3)), polyanions (NaMPO4 (ref. 4 and 5)), fluoro-poly-anions (NaMPO4F (ref. 6)) and pyrophosphates (Na2MP2O7 (ref. 7)) (M = transition metal) have already been explored. However, their reversible capacities are limited by the mechanism of a one-electron redox reaction (1 e− per formula unit). In comparison with these types of cathode materials, conversion reaction compounds,8 such as MXn (M = transition metal, X= F, S), exhibit even higher theoretical specific capacities, which benefit from their advantage of having the ability to transfer multiple electrons per formula unit. Among these candidates, iron trifluoride (FeF3) has attracted considerable interest in cathode materials for LIBs and sodium ion batteries (SIBs) due to its high theoretical specific capacity (∼712 mA h g−1) and higher operational voltage (average ∼2.74 V vs. Na/Na+), which results from the higher ionicity of Fe–F bonds.9–12 However, its commercial application as a high-capacity cathode material in LIBs and SIBs has been hampered by its low electronic conductivity,13 resulting from its large band gap (about 5.96 eV)14 and very poor capacity fading as the cycling proceeds, which results from the pulverization of this material due to a 41–57% volume expansion upon discharging (lithiation).15In order to overcome these problems of FeF3, different types of carbonaceous materials,16 such as graphite,17 acetylene black,18,19 reduced graphene oxide,20 carbon nanotube,21,22 and graphene,23–26 have been used to obtain composites with FeF3 nanostructures, which can accelerate the reaction kinetics due to shortened electron and iron diffusion distances, and relieve pulverizations due to volume expansion.15 Chung et al. used FeF3·0.5H2O composited reduced graphene oxide (RGO) as a cathode material for SIBs with outstanding rate performances, in which the cathode material is an open-framework iron fluoride,11,27–30 the structure of which favors the transportation of alkali ions.28–32 Liu et al. reported iron fluoride/graphene with a good charge/discharge reversibility for LIBs.26,33 Although considerable progress has been made in the research of FeF3 modification,10,25 a method in which the highly-graphitized intimately contacted carbon coating layer on the FeF3 surface can be synthesized in situ has scarcely been reported. In comparison with the amorphous carbon,18 graphitic carbon could lead to more apparent improvement in the conductivity performances of FeF3. Nowadays, metal–organic frameworks (MOFs), used as precursors to generate a nano-porous carbon network with metal oxides through a thermal process, have attracted considerable interest.34 For example, Wang et al. used porous NixFe3−xO4 nanotubes as anode materials for LIBs with outstanding rate performances, in which the anode material was prepared from the carbonization of an FeNi metal–organic framework (FeNi–MOF).35 This type of oxide material used as a precursor of fluorides can achieve the effect of nanoparticles with an intimate coating of carbon. Furthermore, in order to be more suitable for sodium ion batteries, some researchers used open framework as a strategy to prepare iron fluoride cathode materials due to better performances.11,28,29 Several others have also prepared amorphized iron fluoride densified from its open parent phase showing good lithium storage performance.32 This implies that fluoride amorphization, along with defect generation or strain relief is of importance for improving the ion storage performance,32 which may result from a new structure being reconstructed from the amorphous structure during the charge/discharge process, with this new structure being more in favor of ion diffusion in the electrode materials. Herein, we have successfully designed and prepared amorphous iron trifluoride nanoparticles anchored in a highly-graphitized porous carbon framework via a novel vapor-solid fluoridation reaction and dehydration reaction, using carbonized Fe–MOFs as a precursor.36 The synthesized amorphous FeF3 composite with graphitic carbon framework exhibited significantly improved electrochemical performance, showing high reversible capacity, capacity retention, and rate capability. The current synthesis strategy of using the carbonized Fe–MOFs as a precursor can be applied to other materials synthesis.
2. Experimental
2.1. Synthesis of FeF3/carbon composites
The FeF3/C nanocomposites at various carbonization conditions were prepared according to the above experimental process: FeF3/C-500-3 h from the precursor of 500 °C carbonization for 3 h, FeF3/C-600-3 h from the precursor of 600 °C carbonization for 3 h, FeF3/C-700-3 h from the precursor of 700 °C carbonization for 3 h, FeF3/C-700-5 h from the precursor of 700 °C carbonization for 5 h.
2.2. Material characterization
XRD patterns were characterized using a PANalytical B.V. Lelyweg 1, 7602 EA X-ray diffractometer (Cu Kα 426 radiation source). The morphologies and particle sizes of the sample were investigated by field emission scanning electron microscopy (FESEM JSM-6610) and transmission electron microscopy (TEM JEM-2100). The sample carbon content was quantified by thermogravimetric analysis (TGA). TGA was conducted in air between 40 °C and 700 °C at a heating rate of 10 °C min−1 using a NETZSCH TG 209 F3 instrument.2.3. Electrochemical measurement
CR2032-type coin cells were assembled in an argon-filled glovebox. Positive electrodes were fabricated by mixing FeF3/C composites, carbon black (Super P, Timcal), and polyvinylidene fluoride (PVDF) binder in a 7![[thin space (1/6-em)]](https://www.rsc.org/images/entities/char_2009.gif) :
:![[thin space (1/6-em)]](https://www.rsc.org/images/entities/char_2009.gif) 1.5
1.5![[thin space (1/6-em)]](https://www.rsc.org/images/entities/char_2009.gif) :
:![[thin space (1/6-em)]](https://www.rsc.org/images/entities/char_2009.gif) 1.5 weight ratio in N-methylpyrrolidone (NMP, Aldrich) as the solvent. The electrode material mixtures were coated onto aluminum foil, dried at 80 °C for 12 h under vacuum, and then punched. The slurry was coated onto Al foil with mass a loading of about 1.5–2.0 mg cm−2. Celgard 2400 polypropylene membranes and sodium metal were used as the separator and reference electrode, respectively. A 1.0 M solution of NaClO4 in ethylene carbonate (EC)/dimethyl carbonate (DEC) (EC
1.5 weight ratio in N-methylpyrrolidone (NMP, Aldrich) as the solvent. The electrode material mixtures were coated onto aluminum foil, dried at 80 °C for 12 h under vacuum, and then punched. The slurry was coated onto Al foil with mass a loading of about 1.5–2.0 mg cm−2. Celgard 2400 polypropylene membranes and sodium metal were used as the separator and reference electrode, respectively. A 1.0 M solution of NaClO4 in ethylene carbonate (EC)/dimethyl carbonate (DEC) (EC![[thin space (1/6-em)]](https://www.rsc.org/images/entities/char_2009.gif) :
:![[thin space (1/6-em)]](https://www.rsc.org/images/entities/char_2009.gif) DEC, 1
DEC, 1![[thin space (1/6-em)]](https://www.rsc.org/images/entities/char_2009.gif) :
:![[thin space (1/6-em)]](https://www.rsc.org/images/entities/char_2009.gif) 1 v/v) with 10% fluoroethylene carbonate (FEC) (Aldrich) was used as an electrolyte. Galvanostatic charging/discharging measurements were estimated at different current densities in voltage ranges of 1.5–4.5 V at 30 °C using a battery test system (CT2001A, LAND). Cyclic voltammetry (CV) was performed at a scan rate of 0.1 mV s−1 on an Interface 1000 electrochemical workstation.
1 v/v) with 10% fluoroethylene carbonate (FEC) (Aldrich) was used as an electrolyte. Galvanostatic charging/discharging measurements were estimated at different current densities in voltage ranges of 1.5–4.5 V at 30 °C using a battery test system (CT2001A, LAND). Cyclic voltammetry (CV) was performed at a scan rate of 0.1 mV s−1 on an Interface 1000 electrochemical workstation.
3. Results and discussion
3.1. Structural and morphological characterization
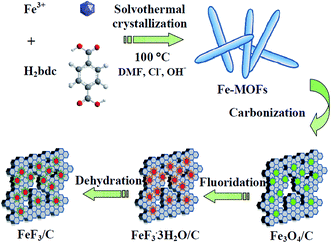
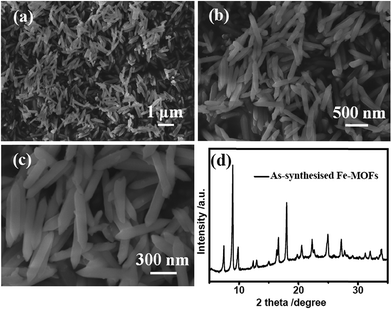
Scheme 1 illustrates the detailed synthesis process of FeF3/C composites. First, Fe–MOFs were prepared by a solvothermal route using FeCl3·6H2O, NaOH, 1,4-benzenedicarboxylic acid (H2bdc) and N,N-dimethyl formamide (DMF). Second, the as-fabricated Fe–MOFs nanocrystals were carbonized by a calcination route in Ar atmosphere and formed the Fe3O4/C nanocomposite. Third, the obtained nanocomposite powder was heat treated with 48% HF solution vapor at 120 °C for 3 h, and the obtained iron trifluorides were treated with crystal water. Finally, the FeF3/C nanocomposite was obtained from these iron trifluorides/carbon nanocomposites with crystal water through a dehydration process at 170 °C for 3 h. In this case, H2bdc was employed as a carbon source to generate a nanoporous carbon framework for hosting the FeF3 nanoparticles (NPs). This can avoid the nanoparticle aggregation and is beneficial to the cycle and rate performance of electrode materials.Fig. 1a–c show the scanning electron microscopy (SEM) images of the hydrothermally as-prepared Fe–MOFs. As is clearly shown in these SEM images at low magnification, these needle-shaped Fe–MOFs have a good dispersibility (Fig. 1b) and uniformity (Fig. 1a). In addition, from the SEM image at high magnification (Fig. 1c), the size of Fe–MOFs was observed to be about 500 nm long and 80 nm wide. Therefore, we can see that the morphology and size of the as-prepared Fe–MOFs are very similar to that of the materials presented in previous studies.35 Furthermore, the crystal structure of the Fe–MOFs was examined by X-ray diffraction (XRD) (Fig. 1d). It can be seen that the XRD patterns of Fe–MOFs can be consistent with MIL-88B-Fe (MIL = Materials from the Lavoisier Institute), which could be indexed to the hexagonal space group as P-62c.35 The formula of MIL-88B-Fe is Fe3O(H2O)2Cl(BDC)3·nH2O. In the MIL-88B frameworks, the iron ions are located in an octahedral coordination environment, which is made up of four oxygen atoms from the bidentate dicarboxylates of benzenedicarboxylic acid. The chain of the MOF net was formed by alternately connecting the iron ions with the benzenedicarboxylic acid, as shown in Fig. S1a (ESI†).
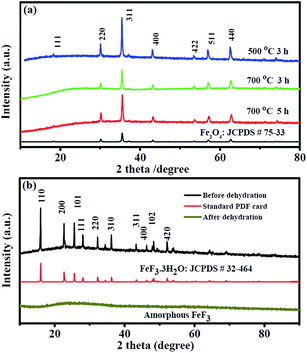
The structural characterizations and phase purity of the obtained Fe3O4 precursors at different annealing temperatures were confirmed by X-ray diffraction (XRD), as shown in Fig. 2a. The XRD profiles of three materials can be consistently indexed to the crystal structure of Fe3O4 (JCPDS no. 26-1136), which is the cubic space group Fd-3m. The sharp peaks imply the well-crystallized nature of the precursors, and no other significant peaks were found, demonstrating a complete transformation from Fe–MOFs to metal oxides. Pure Fe3O4 phase was well obtained by carbonization for 3 h at temperatures of 500–700 °C, even at 700 °C for 5 h. However, when the carbonization temperature was raised to 730 °C, we obtained the phase of Fe (JCPDS no. 65-4899) (Fig. S1b, ESI†). This carbonization regularity is consistent with previous literature.35 Through the carbonization process, the morphology of Fe–MOFs precursors underwent some changes. The fundamental morphology of the obtained Fe3O4/C precursors at 700 °C annealing for 3 h was characterized by SEM analysis, as shown in Fig. S2 (ESI†). It can be seen that the primary needle-shaped morphology was destroyed and a new structure was formed, which may be attributed to structure contraction and reconstitution during a high-temperature carbonization process. However, the initial frame structure of Fe–MOFs can be maintained, as is clearly shown in the TEM and SEM images of its counterpart iron fluoride nanocomposites (Fig. 3). Fig. S2b (ESI†) shows a typical high-magnification SEM image of FeF3/C-700-3 h nanocomposites. Combined with the counterpart TEM images of FeF3·3H2O/C-700-3 h (Fig. 3), there is clearly a large number of little particles anchored in the porous carbon framework, generated from the carbonization of the organic carbon chain, which can constitute a good conductive network.
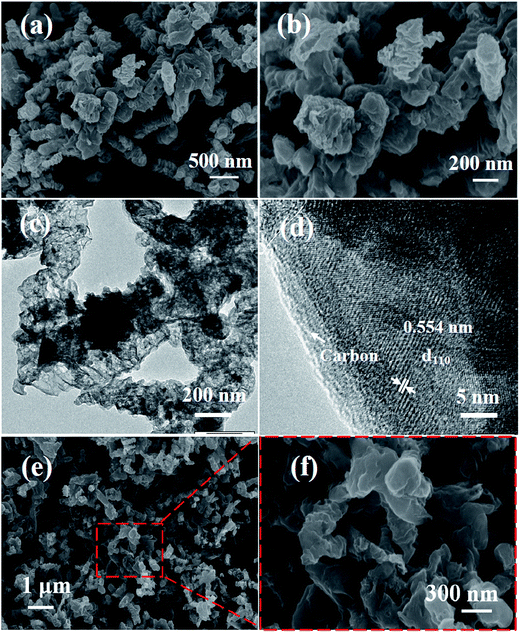
The Fe3O4/C nanocomposites changed into iron trifluoride with crystal water nanocomposites after the fluoridation process. The constitution of these products can be determined by XRD measurement. The typical XRD pattern (Fig. 2b) identified the iron trifluoride with crystal water as the tetragonal phase (P4/n space group) of FeF3·3H2O (JCPDS no. 32-0464). Afterward, through a dehydration process, the FeF3·3H2O/C nanocomposite turned into amorphous FeF3/C nanocomposite, which can be confirmed from XRD patterns (Fig. 2b).37 In order to reveal the particle size and morphology of the products, SEM measurements were also carried out, as shown in Fig. 3a and b. It can be seen from SEM images that FeF3·3H2O/C-700-3 h nanocomposites show a branch-like morphology, resulting from the carbonization reconstitution of the needle-shaped Fe–MOFs, the structure of which can favor the improvement of electrochemical performance of the electrode materials. This unique structure is expected to improve the electrochemical performance of FeF3 as cathode materials for SIBs from three aspects: first, the highly-graphitized carbon framework can construct a conductive network for the insulated FeF3 nanoparticles to improve its electrochemical performance;21 second, the porous structure of the carbon framework favors the permeation of electrolyte,38 thus promoting the reaction kinetics of the FeF3 electrode;39 finally, the branch-like framework can buffer the volume change during the charge/discharge process.36,40,41
The detailed structures of typical samples were further studied using the TEM technique. In view of the morphology being invariable after dehydration (Fig. 3e and f) and the amorphous structure of the final product FeF3, we only studied the TEM images of FeF3·3H2O/C nanocomposite before dehydration, as shown in Fig. 3c and d. Fig. 3c reveals the branch-like highly-graphitized porous carbon frameworks embedded with FeF3 nanoparticles, which were derived from the carbonization of Fe–MOFs. It can be seen that some FeF3 nanoparticles aggregated and formed nanoclusters in the carbon framework, and the others dispersed into the carbon framework. The high-resolution TEM (HRTEM) image shown in Fig. 3d more clearly displays that the porous carbon presents a very high degree of graphitization, and FeF3 nanoparticles are perfectly encapsulated by the framework of carbon. This HRTEM image clearly shows lattice fringes with a d-spacing of 0.55 nm, which are assigned to the (110) phase of the FeF3·3H2O crystal structure, in agreement with the XRD result. It can be noted that there are some other narrow lattice fringes, which cannot be assigned to the phase of FeF3·3H2O, which may result from the crystal water being broken away and the crystal structure being reconstructed when the transmission electrons are passing through the FeF3·3H2O crystals. As shown in Fig. S3a (ESI†), the HRTEM image of FeF3·3H2O/C-700-3 h nanocomposites showed the distribution of iron fluoride particles in the carbon framework and the crystallization state of graphitized carbon. It can be seen that the framework carbon has a high crystallinity and uniformity.
The carbon mass content of the as-synthesized FeF3/C-700-3 h nanocomposites was measured by thermogravimetric analysis (TGA), as shown in Fig. S3b (ESI†). In detail, the small weight loss below 120 °C could be attributed to the evaporation of moisture or gaseous content in the sample. The weight loss took place mainly between 120 °C and 500 °C, which should be ascribed to the combustion of carbon and the conversion reaction from FeF3 to Fe2O3.37 The total weight loss is observed to be 51.50%. According to the TG curve and the final residue (Fe2O3), the weight percentage of FeF3 active materials in the sample was estimated to be about 67.53%. To confirm the oxidation states of iron, X-ray photoelectron spectroscopy (XPS) spectra were recorded, confirming the presence of the main four elements (Fe, F, and C). The XPS spectrum of F 1s is illustrated in Fig. S3c (ESI†). It is clear that the peak is located at about 685.0 eV, which suggests the presence of the Fe3+–F bond.37 As shown in Fig. S3d (ESI†), the XPS spectrum of the Fe 2p3/2 region shows a peak at about 713.6 eV, which suggests the +3 oxidation states of iron in the materials.37 These results confirm the products as FeF3 and further ascertain the composition of the amorphous sample.
3.2. Electrochemical performance
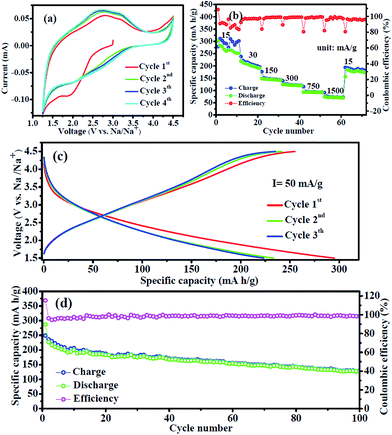
Fig. 4a shows the first four cyclic voltammetry (CV) curves of the FeF3/C-700-3 h nanocomposite electrode at room temperature between 1.25 V and 4.5 V at a scan rate of 0.1 mV s−1. It is clear that the CV curve of the first cycle is quite different from those of subsequent cycles, particularly for the discharge part, which is likely to be ascribed to the occurrence of a side reaction on the electrode surfaces and interfaces. Moreover, it can be seen that there are no obviously sharp peaks, which may be attributed to the no precise oxidizing and reduction potential of the electrode materials. The electrochemical reaction mechanism of the FeF3 electrode for SIBs involves two types of mechanisms:21 intercalation reaction (where the reaction occurs above 1.8 V and Fe3+ is reduced to Fe2+, delivering a capacity of 237 mA h g−1) and conversion reaction (where the reaction occurs below 1.8 V and Fe3+ is reduced to Fe0 with a capacity of 712 mA h g−1). Rate performance of FeF3/C-700-3 h nanocomposites was estimated at various current densities at 1.5–4.5 V (Fig. 4b). These FeF3/C-700-3 h nanocomposites showed discharge capacities of 302.2, 213.1, 146.1, 124.4, 93.4 and 73.2 mA g−1 at current densities of 15, 30, 150, 300, 750, 1500 mA g−1, respectively. When the current density returned to the initial current density of 15 mA g−1, the FeF3/C-700-3 h was restored to 185 mA g−1, which reached 74% of its initial steady capacity. From these results, we can see that the FeF3/C-700-3 h delivered a high sodium storage capacity of 302.2 mA h g−1 at the first discharge process. Furthermore, it showed a discharge capacity of 73.2 mA h g−1 and a stable coulombic efficiency (near 100%) at a large current density of 1500 mA g−1. At the same time, it should be noted that the charge/discharge cycles at low current density show a high capacity but an unsteady coulombic efficiency, which may result from the reconstitution of amorphized FeF3 electrode materials during a low current charge/discharge process. Fig. S4a (ESI†) shows representative rate charge/discharge voltage profiles of FeF3/C-700-3 h at various current densities between 1.5 V and 4.5 V. It can be seen that the charge/discharge profiles have no significant voltage platform, which is in agreement with the CV results, which show that there are no prominent redox peaks in the charge/discharge process. It can also be seen that the average charge/discharge voltage values (approximately equal to the voltage value of the intersection of the charge/discharge curve every cycle) increased along with the increase in current densities. As shown in the cycled charge/discharge voltage profiles of FeF3/C-700-3 h (Fig. 4c), we confirm that the sample delivers a very high sodium storage capacity of 280 mA h g−1 at a current density of 75 mA g−1 during the initial discharge process, but a relatively abnormal coulombic efficiency, which is caused by the irreversible capacity loss, including inevitable formation of SEI and other side reactions. This characteristic also agrees well with the CV results that the first cycle curve is quite different from those of subsequent cycles. To further highlight the superiority of the FeF3/C-700-3 h for cathode materials of SIBs, we tested the cycle performance of the sample at a current density of 75 mA g−1 in the range of 1.5–4.5 V, as shown in Fig. 4d. The initial and the second discharge capacities of the FeF3/C electrodes were 286 and 227 mA h g−1, respectively. The FeF3/C-700-3 h composites kept a high discharge capacity of 163 mA h g−1 after 50 cycles, and a capacity of 126.7 mA h g−1 after 100 cycles with a fading rate of about 0.45% per cycle, suggesting that the Na+ insertion/extraction process was quite reversible.To confirm the most optimal performance materials, we also prepared and tested the FeF3/C nanocomposites from the precursors at various other carbonization conditions, such as FeF3/C-500-3 h from the precursor of 500 °C carbonization for 3 h, FeF3/C-600-3 h from the precursor of 600 °C carbonization for 3 h, and FeF3/C-700-5 h from the precursor of 700 °C carbonization for 5 h. The electrochemical performances of these electrode materials are shown in Fig. S4b and S5 (ESI†). It can be seen that the FeF3/C-500-3 h electrode showed an obviously poorer electrochemical performance than that of FeF3/C-700-3 h materials (Fig. S5a, ESI†); this poor performance resulted from the graphitizing degree of the precursor being insufficient. Though the FeF3/C-600-3 h cathode delivered a higher sodium storage capacity of 178 mA h g−1 at a current density of 30 mA g−1, a relatively poor rate and cycling performance (Fig. S5b, ESI†) were achieved. The FeF3/C-700-5 h electrode delivered an excellent sodium storage capacity of 290 mA h g−1 at a current density of 30 mA g−1 compared to the FeF3/C-700-3 h one. However, it showed a poor coulombic efficiency, poor rate performance (Fig. S5c, ESI†) and poor cycle steady performance (Fig. S5d, ESI†), which resulted from the Fe nanoparticles aggregating and from the porous carbon framework being destroyed at the excessive carbonization time. The above results can be verified from the SEM and TEM images of FeF3·3H2O/C-700-5 h nanocomposites (Fig. S6c–f, ESI†) as well as from the SEM images of its precursor Fe3O4/C-700-5 h (Fig. S6a and b, ESI†). From the above discussion, it can be observed that the FeF3/C-700-3 h nanocomposites had the best comprehensive electrochemical performance for sodium ion storage.
In order to intuitively reveal the electrochemical performance improvements of FeF3/C-700-3 h nanocomposites, the electrochemical performance of the FeF3/C-700-3 h cathode is also comparable to that of the previously reported FeF3 electrodes [such as iron fluoride/graphenes, RGOs, multi-walled carbon nanotubes (MWNTs), and single-walled carbon nanotubes (SWCNTs) composites] as summarized in Table S1 (ESI†). These results indicate that the electrochemical performance of FeF3/C-700-3 h nanocomposites is remarkably improved. The outstanding electrochemical performance of the FeF3/C-700-3 h electrode benefits from the unique porous carbon coating framework and its amorphous structural nature. Due to the intimate contact of FeF3 nanoparticles with the conductive carbon coating layers, the electrical conductivity of the FeF3 electrode is largely improved.37 The porous carbon layers can also hamper the growth and aggregation of FeF3 particles and buffer the volume change during the charge/discharge process, providing short pathways for the transportation of sodium ions in the crystal structure of FeF3.37
4. Conclusion
To summarize, amorphous FeF3/C nanoparticles composited with a highly-graphitized porous branch-like carbon framework have been successfully fabricated from the precursors of uniform Fe–MOFs nanocrystals. The FeF3/C-700-3 h nanocomposites exhibit exceptional electrochemical performance with a high sodium ion storage capacity at low current density, an excellent rate performance at a current density of 1500 mA g−1 and good capacity retention over 100 cycles. The outstanding electrochemical features of the FeF3/C-700-3 h nanocomposite are attributed to its amorphous structure and highly-graphited porous carbon framework, which favors the ionic and electronic transport and the reaction kinetics of electrode materials. This study is expected to be useful for other energy storage materials.Acknowledgements
The authors gratefully acknowledge the financial support of the Start-up Foundation of South China University of Technology and the Start-up Foundation of The Guangdong University of Technology (220413129).References
- J. Liu, X. Xu, R. Hu, L. Yang and M. Zhu, Adv. Energy Mater., 2016, 6, 1600256 CrossRef.
- J. Liu, L. Yu, C. Wu, Y. Wen, K. Yin, F. Chiang, R. Hu, J. Liu, L. Sun, L. Gu, J. Maier, Y. Yu and M. Zhu, Nano Lett., 2017, 17, 2034–2042 CrossRef CAS PubMed.
- T. Shibata, Y. Fukuzumi, W. Kobayashi and Y. Moritomo, Sci. Rep., 2015, 5, 9006 CrossRef CAS PubMed.
- M. Avdeev, Z. Mohamed, C. D. Ling, J. Lu, M. Tamaru, A. Yamada and P. Barpanda, Inorg. Chem., 2013, 52, 8685–8693 CrossRef CAS PubMed.
- J. Kim, D.-H. Seo, H. Kim, I. Park, J.-K. Yoo, S.-K. Jung, Y.-U. Park, W. A. Goddard Iii and K. Kang, Energy Environ. Sci., 2015, 8, 540–545 CAS.
- D. L. Smiley and G. R. Goward, Chem. Mater., 2016, 25, 3480–3487 Search PubMed.
- P. Barpanda, G. Liu, C. D. Ling, M. Tamaru, M. Avdeev, S.-C. Chung, Y. Yamada and A. Yamada, Chem. Mater., 2013, 25, 3480–3487 CrossRef CAS.
- L. Liu, M. Zhou, L. Yi, H. Guo, J. Tan, H. Shu, X. Yang, Z. Yang and X. Wang, J. Mater. Chem., 2012, 22, 17539 RSC.
- R. Chen, R. Luo, Y. Huang, F. Wu and L. Li, Adv. Sci., 2016, 3, 2198–3844 Search PubMed.
- J. Jiang, L. Li, M. Xu, J. Zhu and C. M. Li, ACS Appl. Mater. Interfaces, 2016, 8, 16240–16247 CAS.
- G. Ali, S. H. Oh, S. Y. Kim, J. Y. Kim, B. W. Cho and K. Y. Chung, J. Mater. Chem. A, 2015, 3, 10258–10266 CAS.
- F. Wang, S. W. Kim, D. H. Seo, K. Kang, L. Wang, D. Su, J. J. Vajo, J. Wang and J. Graetz, Nat. Commun., 2015, 6, 6668 CrossRef CAS PubMed.
- Z. Long, W. Hu, L. Liu, G. Qiu, W. Qiao, X. Guan and X. Qiu, Electrochim. Acta, 2015, 151, 355–362 CrossRef CAS.
- L. Li, Y. Yu, F. Meng, Y. Tan, R. J. Hamers and S. Jin, Nano Lett., 2012, 12, 724–731 CrossRef CAS PubMed.
- X. Fan, Y. Zhu, C. Luo, L. Suo, Y. Lin, T. Gao, K. Xu and C. Wang, ACS Nano, 2016, 307, 435–442 CAS.
- R. Prakash, A. K. Mishra, A. Roth, C. Kübel, T. Scherer, M. Ghafari, H. Hahn and M. Fichtner, J. Mater. Chem., 2010, 20, 1871–1876 RSC.
- T. Li, L. Li, Y. L. Cao, X. P. Ai and H. X. Yang, J. Phys. Chem. C, 2010, 114, 3190–3195 CAS.
- X. Fan, Y. Zhu, C. Luo, T. Gao, L. Suo, S.-C. Liou, K. Xu and C. Wang, J. Power Sources, 2016, 307, 435–442 CrossRef CAS.
- N. Yabuuchi, M. Sugano, Y. Yamakawa, I. Nakai, K. Sakamoto, H. Muramatsu and S. Komaba, J. Mater. Chem., 2011, 21, 10035–10041 RSC.
- H. Jung, H. Song, T. Kim, J. K. Lee and J. Kim, J. Alloys Compd., 2015, 647, 750–755 CrossRef CAS.
- S. W. Kim, D. H. Seo, H. Gwon, J. Kim and K. Kang, Adv. Mater., 2010, 22, 5260–5264 CrossRef CAS PubMed.
- G. Ali, J.-H. Lee, B. W. Cho, K.-W. Nam, D. Ahn, W. Chang, S. H. Oh and K. Y. Chung, Electrochim. Acta, 2016, 191, 307–316 CrossRef CAS.
- Y. Shen, X. Wang, H. Hu, M. Jiang, X. Yang and H. Shu, J. Power Sources, 2015, 283, 204–210 CrossRef CAS.
- T. Bao, H. Zhong, H. Zheng, H. Zhan and Y. Zhou, Mater. Lett., 2015, 158, 21–24 CrossRef CAS.
- D.-l. Ma, H.-g. Wang, Y. Li, D. Xu, S. Yuan, X.-l. Huang, X.-b. Zhang and Y. Zhang, Nano Energy, 2014, 10, 295–304 CrossRef CAS.
- J. Liu, Y. Wan, W. Liu, Z. Ma, S. Ji, J. Wang, Y. Zhou, P. Hodgson and Y. Li, J. Mater. Chem. A, 2013, 1, 1969–1975 CAS.
- Y. Han, J. Hu, C. Yin, Y. Zhang, J. Xie, D. Yin and C. Li, J. Mater. Chem. A, 2016, 4, 7382–7389 CAS.
- C. Li, C. Yin, L. Gu, R. E. Dinnebier, X. Mu, P. A. van Aken and J. Maier, J. Am. Chem. Soc., 2013, 135, 11425–11428 CrossRef CAS PubMed.
- C. Li, C. Yin, X. Mu and J. Maier, Chem. Mater., 2013, 25, 962–969 CrossRef CAS.
- S. Wei, X. Wang, M. Jiang, R. Zhang, Y. Shen and H. Hu, J. Alloys Compd., 2016, 689, 945–951 CrossRef CAS.
- C. Li, L. Gu, J. Tong, S. Tsukimoto and J. Maier, Adv. Funct. Mater., 2011, 21, 1391–1397 CrossRef CAS.
- C. Li, X. Mu, P. A. van Aken and J. Maier, Adv. Energy Mater., 2013, 3, 113–119 CrossRef CAS.
- J. Liu, W. Liu, S. Ji, Y. Wan, M. Gu, H. Yin and Y. Zhou, Chem.–Eur. J., 2014, 20, 5815–5820 CrossRef CAS PubMed.
- L. Wang, Y. Han, X. Feng, J. Zhou, P. Qi and B. Wang, Coord. Chem. Rev., 2016, 307, 361–381 CrossRef CAS.
- Y. Xia, B. Wang, G. Wang, X. Liu and H. Wang, ChemElectroChem, 2016, 3, 299–308 CrossRef CAS.
- R. Ma, M. Wang, P. Tao, Y. Wang, C. Cao, G. Shan, S. Yang, L. Xi, J. C. Y. Chung and Z. Lu, J. Mater. Chem. A, 2013, 1, 15060–15067 CAS.
- T. Kim, W. J. Jae, H. Kim, M. Park, J. M. Han and J. Kim, J. Mater. Chem. A, 2016, 4, 14857–14864 CAS.
- T. Yoon, C. Chae, Y.-K. Sun, X. Zhao, H. H. Kung and J. K. Lee, J. Mater. Chem., 2011, 21, 17325–17330 RSC.
- J. Liu, M. Gu, L. Z. Ouyang, H. Wang, L. Yang and M. Zhu, ACS Appl. Mater. Interfaces, 2016, 8, 8502–8510 CAS.
- L. Yu, J. Liu, X. Xu, L. Zhang, R. Hu, J. Liu, L. Yang and M. Zhu, ACS Appl. Mater. Interfaces, 2017, 9, 2516–2525 CAS.
- J. Liu, C. Wu, D. Xiao, P. Kopold, L. Gu, P. A. van Aken, J. Maier and Y. Yu, Small, 2016, 12, 2354–2364 CrossRef CAS PubMed.
Footnote |
| † Electronic supplementary information (ESI) available. See DOI: 10.1039/c7ra03592f |
| This journal is © The Royal Society of Chemistry 2017 |

