 Open Access Article
Fabrication optimization of polyethersulfone (PES)/polyvinylpyrrolidone (PVP) nanofiltration membranes using Box–Behnken response surface method
Mohammad Peydayesh a,
Maryam Bagheria,
Toraj Mohammadi
 *a and
Omid Bakhtiarib
aResearch and Technology Center of Membrane Processes, Faculty of Chemical Engineering, Iran University of Science and Technology (IUST), Narmak, Tehran, Iran. E-mail: torajmohammadi@iust.ac.ir; Fax: +98 21 77 240 051; Tel: +98 21 77 240 051
bDepartment of Chemical Engineering, Razi University, Kermanshah, Iran
First published on 10th May 2017
Abstract
Herein response surface methodology (RSM) is employed to optimize the fabrication of polyethersulfone (PES) nanofiltration (NF) membranes via phase inversion. The Box–Behnken design matrix is applied to develop predictive regression models, minimize the number of experiments, and investigate the effects of parameters on the response. Four important parameters, including PES polymer concentration (18–22% w/w), PVP concentration (0–2% w/w), evaporation time (0–3 min) and coagulation bath temperature (0–50 °C), were chosen as independent variables and the optimization objectives were water flux and rejection. Consequently, 27 experiments were conducted to construct a quadratic model. The fabricated NF membranes were characterized via scanning electron microscopy (SEM) and water contact angle measurements. The performance of the fabricated membranes was evaluated using a bench scale cross-flow filtration unit. According to analysis of variance (ANOVA), all four independent parameters are statistically significant and the final model is reasonably accurate. Response surfaces and contours are plotted to represent the regression equations and their interpretation. Furthermore, the optimal experimental conditions for both water permeation flux and rejection were separately evaluated. The maximum permeation flux of 159.84 kg m−2 h−1 and rejection of 78.41% were achieved under the optimal fabrication parameters. Deviations between the predicted and actual responses of permeation flux and rejection were within 10% and 3%, respectively, which confirm the accuracy and validation of the model.
1 Introduction
In the past few years, the growing world population and industrial progress have had a number of negative effects on the environment such as shortage and contamination of water resources. One of the most effective solutions to overcome the resulting water scarcity and crisis in the near future is to treat wastewater. Among the various methods used for wastewater treatment, such as reclamation and desalination, membrane separation is one of the most effective processes.1 Different membrane filtration processes such as microfiltration (MF),2 ultrafiltration (UF),3,4 nanofiltration (NF)5,6 and reverse osmosis (RO)7 have been widely used for water and wastewater treatment. In 1980, NF was introduced as a pressure-driven membrane process with attributes similar to both UF and RO. This process is the most popular for lower operating pressures and higher water flux compared to RO and higher rejection compared to UF.8,9 The combination of size exclusion and Donnan exclusion as separation and transport mechanisms of NF membranes, respectively, resulted in various applications, including water softening10 and removal of dyes11 and heavy metals such as nickel,12 copper,13 chromium,14 and arsenic15 from industrial wastewater. Two major methods are used for the fabrication of NF membranes. The first method is based on UF membranes as support layers and thin film composites on top of them as selective layers which can be formed via various methods such as interfacial polymerization16 or spin coating.17 The second method is based on the fabrication of membranes with a pore radius in the range of 1 nm to 9 nm via the phase inversion method.18 In this procedure, the solvent in polymeric solution film exchanges with the non-solvent in the coagulation bath and the demixing speed controls the porosity and pore size of the membrane.19 Various polymeric materials such as polysulfone (PS),20 polyethersulfone (PES),21 polyacrylonitrile (PAN),22 polyvinylidene fluoride (PVDF),23 polyvinyl alcohol (PVA),24 polyimide (PI)25 and cellulose acetate (CA)26 have been used to prepare filtration membranes for water and wastewater treatment. Among them, PES, which has an excellent separation performance and high thermal, chemical, hydraulic and mechanical stability, has been used in a wide range of membrane applications.27–30 Furthermore, it can be used achieve asymmetric structures with various pore size ranges by controlling the chemical and physical conditions applied in the phase inversion process. The most important and effective parameters in the fabrication of NF membranes are polymer concentration, type of solvent and non-solvent, pore-forming agent, temperature of the coagulation bath and solvent evaporation time.31,32 Many reports in the literature on MF, UF and NF used a hydrophilic homopolymer, such as poly ether glycol (PEG) and polyvinylpyrrolidone (PVP), as the pore forming agent and structure controlling agent to achieve membranes with well-defined pores that are less prone to fouling.33 PVP is a non-toxic polymer which is miscible with many polymeric materials. This polymer is soluble both in water and organic solvents which makes it one of the best polymeric additives for the fabrication of phase inversion membranes.34Generally, improving the separation performance of NF membranes, i.e. obtaining higher water flux and rejection without increasing time and cost, can be performed by optimization. One of the methods for the optimization of effective parameters is the response surface methodology (RSM).35 RSM is a combination of mathematical and statistical techniques which generates a mathematical model to define the behavior of experimental data and also investigates the effects of independent variables and their interactions. RSM is conducted by graphical viewpoint of the mathematical model.36
There are very few studies on the optimization of effective parameters in the fabrication of NF membranes via the phase inversion method. In this study, the effects of the most important parameters such as polymer concentration, additive concentration, solvent evaporation time and coagulation bath temperature on the fabrication of PES/PVP NF membranes are investigated. Mathematical models for system behavior determination are also evaluated using RSM and the optimum conditions for obtaining an NF membrane with an asymmetric structure and high rejection for multivalent ions and high water flux are proposed.
2 Material and methods
2.1. Chemicals
Polyethersulfone (Ultrason E6020P, Mw = 58![[thin space (1/6-em)]](https://www.rsc.org/images/entities/char_2009.gif) 000 g mol−1 and glass transition temperature Tg = 225 °C) was supplied by BASF. Dimethylacetamide (DMAc), polyvinylpyrrolidone (PVP, Mw = 100
000 g mol−1 and glass transition temperature Tg = 225 °C) was supplied by BASF. Dimethylacetamide (DMAc), polyvinylpyrrolidone (PVP, Mw = 100![[thin space (1/6-em)]](https://www.rsc.org/images/entities/char_2009.gif) 000 g mol−1) and magnesium sulfate (MgSO4) were supplied from Merck. The coagulation medium was deionized water.
000 g mol−1) and magnesium sulfate (MgSO4) were supplied from Merck. The coagulation medium was deionized water.
2.2. Membrane preparation
Asymmetric flat sheet PES nanofiltration (NF) membranes were fabricated via the phase inversion induced immersion precipitation technique. A multi-component dope solution, which consisted of PES, PVP and DMAc, was cast on a 180 μm thick clean glass plate using a self-made casting knife at ambient temperature. The membrane surface was exposed to air at ambient temperature for free convection evaporation of the solvent for a certain time. After the solvent evaporation step, the membranes were immersed in an aqueous bath at certain temperatures according to the experimental design. After primary phase separation and membrane formation, to ensure the complete removal of residual solvent, the membranes were stored in fresh deionized water for 24 h to ensure complete phase separation. Finally the membranes were sandwiched between two sheets of filter paper and dried at room temperature for a day.2.3. Ternary phase diagram construction
The miscibility of the quaternary system of PES/PVP/DMAc/water was evaluated by cloud point measurements via the usual titration method.40 Different homogeneous polymeric solutions with PES concentrations of 1, 3, 5, 10, 15, 20, 25 and 30 wt% and PVP concentrations of 0, 1 and 3 wt% in DMAc were prepared in sealed glass bottles at the constant temperature of 25 °C. The polymer solution was titrated with double-distilled water as the non-solvent under agitation. The addition of non-solvent was continued until the clear polymer solution visually turned to a permanent cloudy solution. The non-solvent volumes at the cloud point were determined using the reduced level of the burette. The cloud point composition of the system was then calculated from the mass balance corresponding to the added amount of water to plot the ternary phase diagram.2.4. Cross-flow filtration
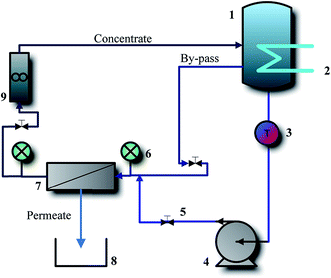
The performance of the fabricated membranes was evaluated using a bench scale cross-flow filtration unit, as shown in Fig. 1. The cross-flow cell housed rectangular shaped flat sheet membranes with an effective surface area of 37 cm2. The performance of the membranes was evaluated under the pressure of 10 bar with a cross flow velocity of 3.79 m s−1. MgSO4 feed solution with concentration of 100 ppm was prepared by dissolving an appropriate amount of the salt in distillated water. The retentate flow was recycled to the feed tank at the constant temperature of 33 ± 2 °C and due to the limited amount of permeate stream the feed concentration of was considered constant. Before starting the experiments, the membranes were first subjected to pre-compaction at a pressure of 15 bar for 30 min using pure water.2.5. Experimental design
In this study, to screen the important parameters and determine the experimental domain for the fabrication of PES/PVP nanofiltration membranes, preliminary experiments were carried out. Finally, the four most important parameters, which are PES concentration (PES conc.), PVP concentration (PVP conc.), evaporation time (EVP time) and coagulation bath temperature (CBT), were chosen as the independent variables and designated as X1, X2, X3, and X4, respectively.The operating factor range and the levels of variables are given in actual and coded values, as presented in Table 1. The low, middle, and high levels of each variable were appointed as −1, 0, and 1, respectively.
| Variable | Factor | Level | ||
|---|---|---|---|---|
| X | Low (−1) | Middle (0) | High (+1) | |
| PES concentration (%) | X1 | 18 | 20 | 22 |
| PVP concentration (%) | X2 | 0 | 1 | 2 |
| Evaporation time (min) | X3 | 0 | 1.5 | 3 |
| Coagulation bath temperature (°C) | X4 | 0 | 25 | 50 |
The Design-Expert 8.0.7.1 software was used to develop the statistical design, RSM modeling and data analysis. The number of experimental runs was optimized using the Box–Behnken statistical design in order to verify the interactions between the major operating variables and their influences on permeation flux and rejection. According to the Box–Behnken statistical design, 27 experimental runs are required to investigate four parameters at three levels. All experiments were repeated twice, and the center point in the design (PES conc. = 20 (% w/w), PVP conc. = 1 (% w/w), EVP time = 1.5 min and CBT = 25 °C in uncoded form) was repeated three times for the estimation of errors and curvature. The generated experimental plan for the Box–Behnken statistical design is shown in Table 2.
| Exp. name | Std. order | PES (% w/w) | PVP (% w/w) | EVP time (min) | CTB (°C) | Permeation flux (kg m−2 h−1) | Rejection (%) | Porosity (%) | Pore radius (nm) |
|---|---|---|---|---|---|---|---|---|---|
| N1 | 19 | 18 | 1 | 3 | 25 | 37.41 | 45.83 | 60.30 | 3.54 |
| N2 | 12 | 22 | 1 | 1.5 | 50 | 10.66 | 63.14 | 46.29 | 2.10 |
| N3 | 21 | 20 | 0 | 1.5 | 0 | 1.35 | 73.21 | 40.46 | 0.78 |
| N4 | 11 | 18 | 1 | 1.5 | 50 | 91.24 | 26.74 | 84.45 | 5.13 |
| N5 | 23 | 20 | 0 | 1.5 | 50 | 2.19 | 62.54 | 43.80 | 0.91 |
| N6 | 15 | 20 | 0 | 3 | 25 | 3.24 | 75.26 | 41.23 | 1.27 |
| N7 | 3 | 18 | 2 | 1.5 | 25 | 123.29 | 18.33 | 92.65 | 6.07 |
| N8 | 25 | 20 | 1 | 1.5 | 25 | 16.83 | 62.32 | 51.83 | 2.48 |
| N9 | 14 | 20 | 2 | 0 | 25 | 45.15 | 33.63 | 61.48 | 4.14 |
| N10 | 7 | 20 | 1 | 0 | 50 | 27.44 | 44.63 | 53.19 | 3.16 |
| N11 | 16 | 20 | 2 | 3 | 25 | 84.43 | 41.02 | 76.65 | 5.53 |
| N12 | 17 | 18 | 1 | 0 | 25 | 70.01 | 50.66 | 73.72 | 4.41 |
| N13 | 26 | 20 | 1 | 1.5 | 25 | 16.43 | 62.66 | 47.66 | 2.69 |
| N14 | 4 | 22 | 2 | 1.5 | 25 | 6.55 | 55.27 | 45.60 | 1.78 |
| N15 | 2 | 22 | 0 | 1.5 | 25 | 0.61 | 77.26 | 38.15 | 0.50 |
| N16 | 24 | 20 | 2 | 1.5 | 50 | 34.76 | 20.21 | 57.21 | 3.66 |
| N17 | 18 | 22 | 1 | 0 | 25 | 8.28 | 64.08 | 46.31 | 1.83 |
| N18 | 20 | 22 | 1 | 3 | 25 | 12.60 | 73.00 | 49.09 | 2.22 |
| N19 | 22 | 20 | 2 | 1.5 | 0 | 103.40 | 47.38 | 90.65 | 5.28 |
| N20 | 1 | 18 | 0 | 1.5 | 25 | 5.81 | 66.60 | 46.29 | 1.45 |
| N21 | 9 | 18 | 1 | 1.5 | 0 | 26.59 | 59.35 | 53.84 | 3.07 |
| N22 | 27 | 20 | 1 | 1.5 | 25 | 16.12 | 62.74 | 49.54 | 2.45 |
| N23 | 8 | 20 | 1 | 3 | 50 | 30.93 | 48.16 | 58.63 | 3.39 |
| N24 | 13 | 20 | 0 | 0 | 25 | 0.18 | 72.27 | 37.97 | 0.27 |
| N25 | 5 | 20 | 1 | 0 | 0 | 40.23 | 62.00 | 61.06 | 3.68 |
| N26 | 10 | 22 | 1 | 1.5 | 0 | 6.43 | 64.21 | 45.04 | 1.53 |
| N27 | 6 | 20 | 1 | 3 | 0 | 8.96 | 63.80 | 45.98 | 1.88 |
The responses of the experiments are permeation flux and rejection which are defined by eqn (1) and (2), respectively:
 | (1) |
 | (2) |
The membrane overall porosity was determined via the gravimetric method using the following equation:
 | (3) |
The membrane mean pore radius was calculated using the Guerout–Elford–Ferry equation:
 | (4) |
Regression analysis was performed to estimate the response function and the response model was expressed as the following quadratic equation:38
 | (5) |
Statistical analysis of the results and the model adequacy evaluation were carried out via analysis of variance (ANOVA). ANOVA includes some statistic factors such as F-value, R2, adjusted R2 and P-value that properly identify the significance of the main effects, interactions of factors and the produced model adequacy.34 Statistical significance was identified using the F-test in the program which was constructed by dividing the mean squares of each effect by the mean square of error. Model terms were obtained or rejected based on the probability value with a 95% confidence limit.39 Finally, in order to visualize the main and the interactive effects of the independent variables, response surfaces and contour plots were generated.
2.6. Characterization
Scanning electron microscopy (SEM, A VEGA, TESCAN, Czech Republic) was used to characterize the cross-section morphology of the membranes. The cleaned membranes were fractured in liquid nitrogen and sputtered with gold before analysis. To evaluate the hydrophilicity of the membranes, water contact angles were measured via the sessile drop method at 25 °C and relative humidity of 50%. Magnified images of 5 μL deionized water droplets that reached constant values, i.e. 10 s after the drops were placed on the membrane surface, were recorded using a Nikon D300 digital camera. Static contact angles were determined from these images using the automated ImageJ software. To minimize experimental error, the measurements were performed at least at five random locations and the mean values reported.3 Results and discussion
3.1. Thermodynamic phase diagram of PES/PVP/DMAc/water
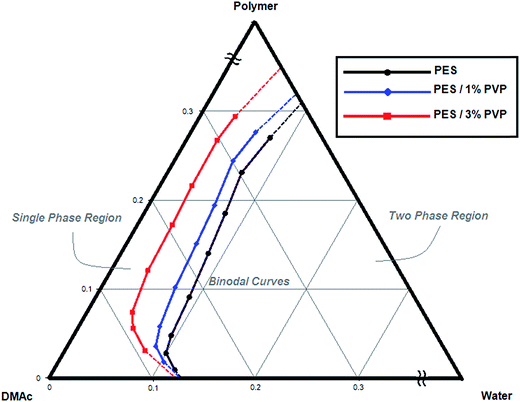
The experimental cloud point data for different PES/PVP/DMAc/water systems are presented in the ternary phase diagram in Fig. 2. As reported by other researchers, due to the good interaction between PES and PVP, these polymers are regarded as one constituent in the ternary phase diagram.18,41 The binodal curve divides the phase diagram into two regions. Inside the binodal curve (single phase region) all the constituents are miscible and outside the curve (two phase region) the system is separated into two phases, polymer rich (solid) and polymer lean (liquid). The binodal curve location can be determined by cloud point measurements, as shown in Fig. 2.42 Generally, during phase inversion, systems undergo two types of demixing: instantaneous and delayed. When a system enters the immiscibility gap, instantaneous demixing occurs. When a system remains in the single phase region for a longer time before passing the binodal curve, delayed demixing occurs. As a general rule, instantaneous demixing results in more porous structures with more macrovoids, whereas delayed demixing results in denser and spongy structures.18 The effects of instantaneous and delayed demixing on membrane structure and performance are discussed in detail in the following sections.As observed for all the systems, by increasing the PES concentration (especially in the PES concentration range of DOE), the system enters later into the immiscibility gap and more water is needed for precipitation. The effect of PVP on the thermodynamic equilibrium of the system can also be seen in Fig. 1. By introducing PVP, the binodal curve shifts left closer to the polymer/DMAc axis. The addition of PVP results in an increase in the casting solution immiscibility with water and decrease in thermodynamic stability. Therefore, less water is needed for precipitation in the quaternary system compared to the PES/DMAc/water system.43
3.2. Modeling
The fabrication variables of PES NF membranes were evaluated using RSM with Box–Behnken statistical design. The experiments were verified using statistical analysis. The modified regression quadratic model equation for permeation flux and rejection are expressed as eqn (6) and (7) in terms of actual factors, respectively.| Y1 = 842 − 87.3X1 + 298.0X2 − 81.2X3 + 5.85X4 + 2.28X12 + 10.57X22 + 2.36X32 + 0.0116X42 − 13.94X1 × X2 + 3.08X1 × X3 − 0.302X1 × X4 + 6.04X2 × X3 − 0.695X2 × X4 + 0.232X3 × X4 | (6) |
| Y2 = −132.9 + 23.98X1 − 69.42X2 − 20.82X3 − 2.844X4 − 0.688X12 − 5.438X22 − 0.675X32 − 0.010221X42 + 3.285X1 × X2 + 1.146X1 × X3 + 0.1577X1 × X4 + 0.734X2 × X3 − 0.1649X2 × X4 + 0.0115X3 × X4 | (7) |
The adequacy, fitness and significance of both models were evaluated by ANOVA, as presented in Table 3. As observed, for both models the F-values are large, which confirms that the models are significant. P-values less than 0.05 are considered to be significant. Thus according to the P-values, for the permeation flux model, PES conc. and PVP conc. are the most effective parameters in comparison with CBT and EVP time. However, in the rejection model all parameters are effective and none can be ignored. Interactions between the factors exist in both models. For the permeation flux model, interaction exists only between PES conc. and PVP conc., whereas for the rejection model, interactions exist between all parameters except for EVP time and PVP conc. and EVP time and CBT. R2 for the rejection model is 99.72% and that for the permeation flux model is 88.92% which means that only 0.28% and 11.08% of variation in the experimental data cannot be explained by each model, respectively. Furthermore, the R2-adjusted values are 99.39% and 76.00% for the rejection and permeation flux models, respectively, which are sufficiently high and in good agreement with the R2 values.
| Analysis of variance | |||||||||
|---|---|---|---|---|---|---|---|---|---|
| Source | DF | Permeation flux | Rejection | ||||||
| Sum of squares | Mean square | F-Value | P-Value | Sum of squares | Mean square | F-Value | P-Value | ||
| Model | 14 | 27![[thin space (1/6-em)]](https://www.rsc.org/images/entities/char_2009.gif) 310.9 310.9 |
1950.8 | 6.88 | 0.001 | 6899.07 | 492.79 | 304.33 | 0 |
| Linear | 4 | 20![[thin space (1/6-em)]](https://www.rsc.org/images/entities/char_2009.gif) 292.4 292.4 |
5073.1 | 17.89 | 0 | 6060.19 | 1515.05 | 935.64 | 0 |
| X1 | 1 | 7967.1 | 7967.1 | 28.1 | 0 | 1396.22 | 1396.22 | 862.26 | 0 |
| X2 | 1 | 12![[thin space (1/6-em)]](https://www.rsc.org/images/entities/char_2009.gif) 300.8 300.8 |
12![[thin space (1/6-em)]](https://www.rsc.org/images/entities/char_2009.gif) 300.8 300.8 |
43.39 | 0 | 3720.67 | 3720.67 | 2297.76 | 0 |
| X3 | 1 | 15.7 | 15.7 | 0.06 | 0.818 | 32.7 | 32.7 | 20.19 | 0.001 |
| X4 | 1 | 8.8 | 8.8 | 0.03 | 0.863 | 910.61 | 910.61 | 562.36 | 0 |
| Square | 4 | 818.4 | 204.6 | 0.72 | 0.594 | 296.58 | 74.15 | 45.79 | 0 |
| X12 | 1 | 445 | 445 | 1.57 | 0.234 | 40.42 | 40.42 | 24.96 | 0 |
| X22 | 1 | 595.6 | 595.6 | 2.1 | 0.173 | 157.73 | 157.73 | 97.41 | 0 |
| X32 | 1 | 150.2 | 150.2 | 0.53 | 0.481 | 12.32 | 12.32 | 7.61 | 0.017 |
| X42 | 1 | 278.1 | 278.1 | 0.98 | 0.342 | 217.63 | 217.63 | 134.4 | 0 |
| 2-Way interaction | 6 | 6200.1 | 1033.4 | 3.64 | 0.027 | 542.3 | 90.38 | 55.82 | 0 |
| X1 × X2 | 1 | 3110.4 | 3110.4 | 10.97 | 0.006 | 172.71 | 172.71 | 106.66 | 0 |
| X1 × X3 | 1 | 340.7 | 340.7 | 1.2 | 0.294 | 47.31 | 47.31 | 29.22 | 0 |
| X1 × X4 | 1 | 912.4 | 912.4 | 3.22 | 0.098 | 248.67 | 248.67 | 153.57 | 0 |
| X2 × X3 | 1 | 328 | 328 | 1.16 | 0.303 | 4.85 | 4.85 | 3 | 0.109 |
| X2 × X4 | 1 | 1206.7 | 1206.7 | 4.26 | 0.061 | 68 | 68 | 42 | 0 |
| X3 × X4 | 1 | 301.9 | 301.9 | 1.06 | 0.322 | 0.75 | 0.75 | 0.46 | 0.509 |
| Error | 12 | 3402.3 | 283.5 | 19.43 | 1.62 | ||||
| Lack-of-fit | 10 | 3402.1 | 340.2 | 2685 | 0 | 19.33 | 1.93 | 38.34 | 0.026 |
| Pure error | 2 | 0.3 | 0.1 | 0.1 | 0.05 | ||||
| Total | 26 | 30![[thin space (1/6-em)]](https://www.rsc.org/images/entities/char_2009.gif) 713.2 713.2 |
6918.5 | ||||||
| Model summary | |||||||||
| S | R-sq | R-sq (adj) | S | R-sq | R-sq (adj) | ||||
| 16.8382 | 88.92% | 76.00% | 1.27250 | 99.72% | 99.39% | ||||
Therefore, the results indicate that the rejection model is statistically valid and can be used for excellent prediction of the performance of PES/PVP nanofiltration membranes. The regression value of the permeation flux model shows that the data represented can be fitted satisfactorily by the model with moderate accuracy.
3.3. Effect of polymer concentration on permeation flux and rejection
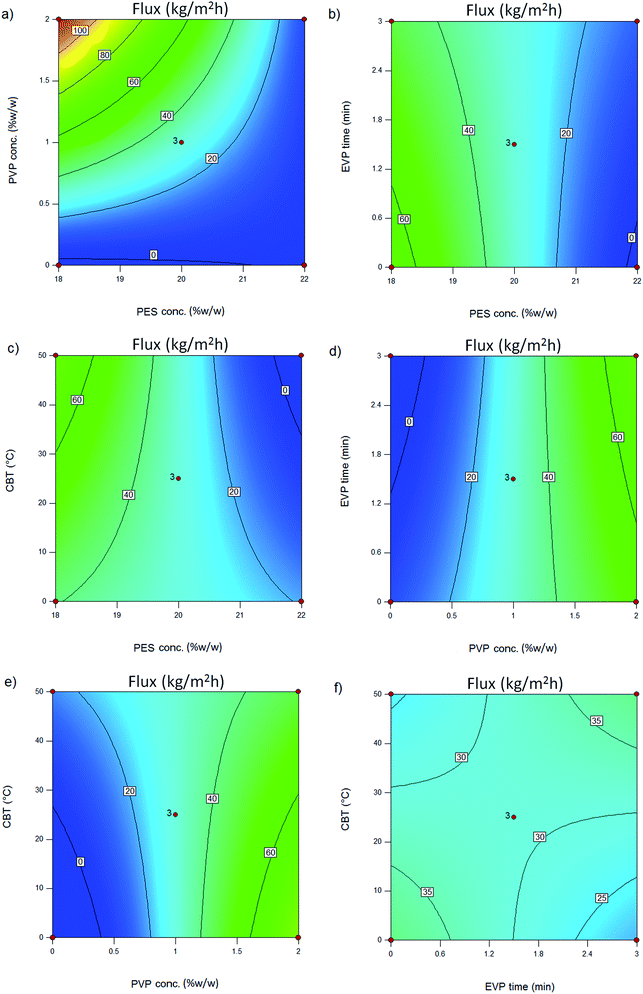
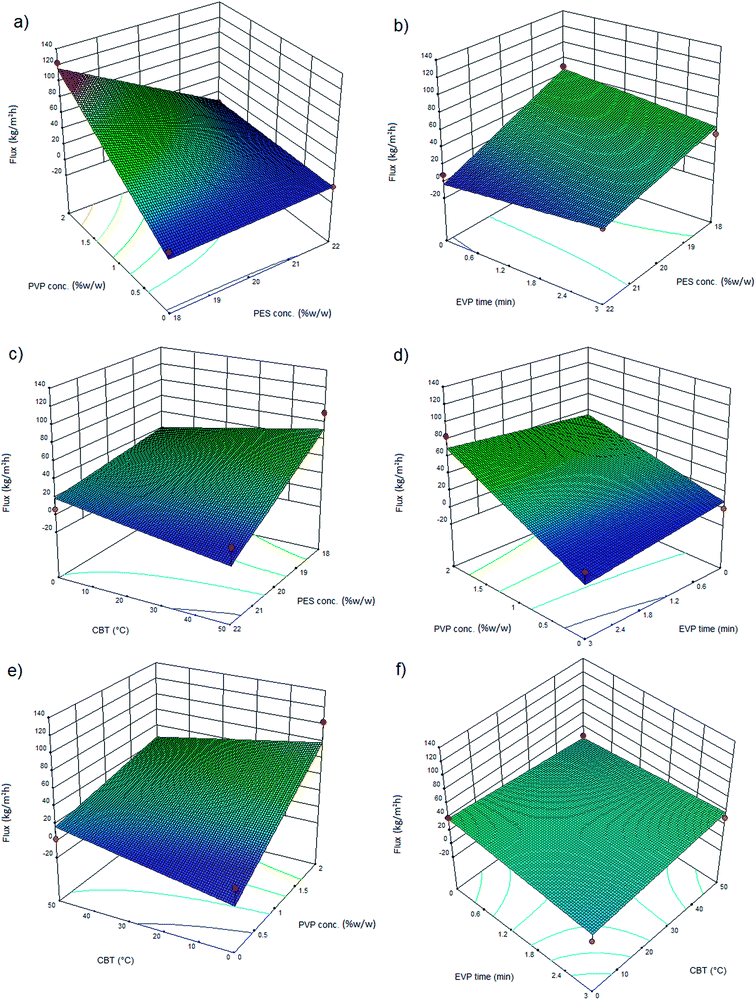
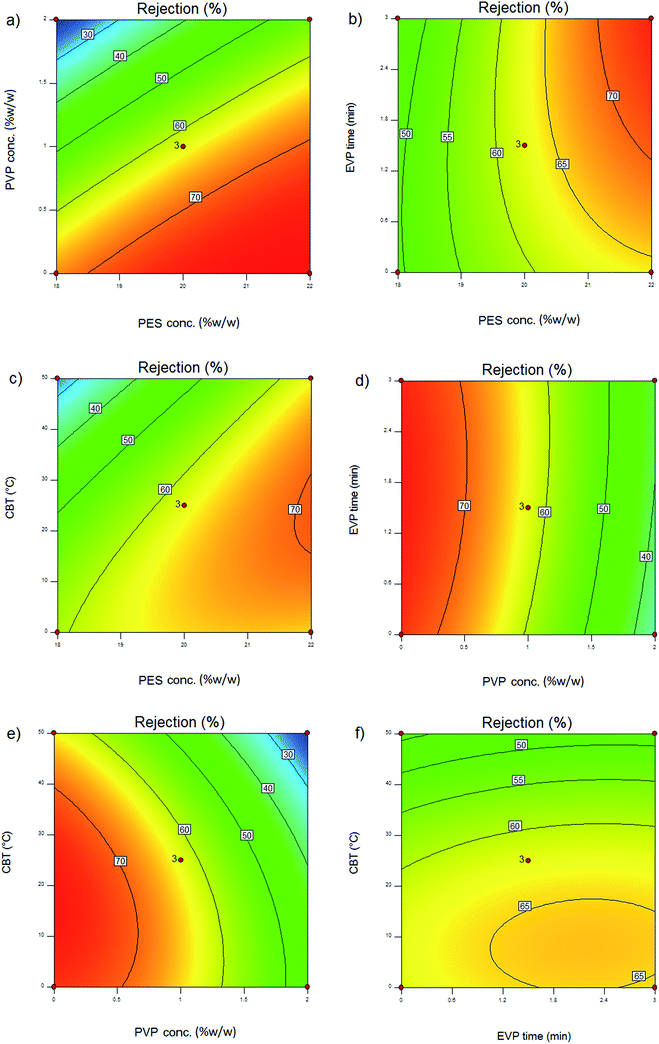
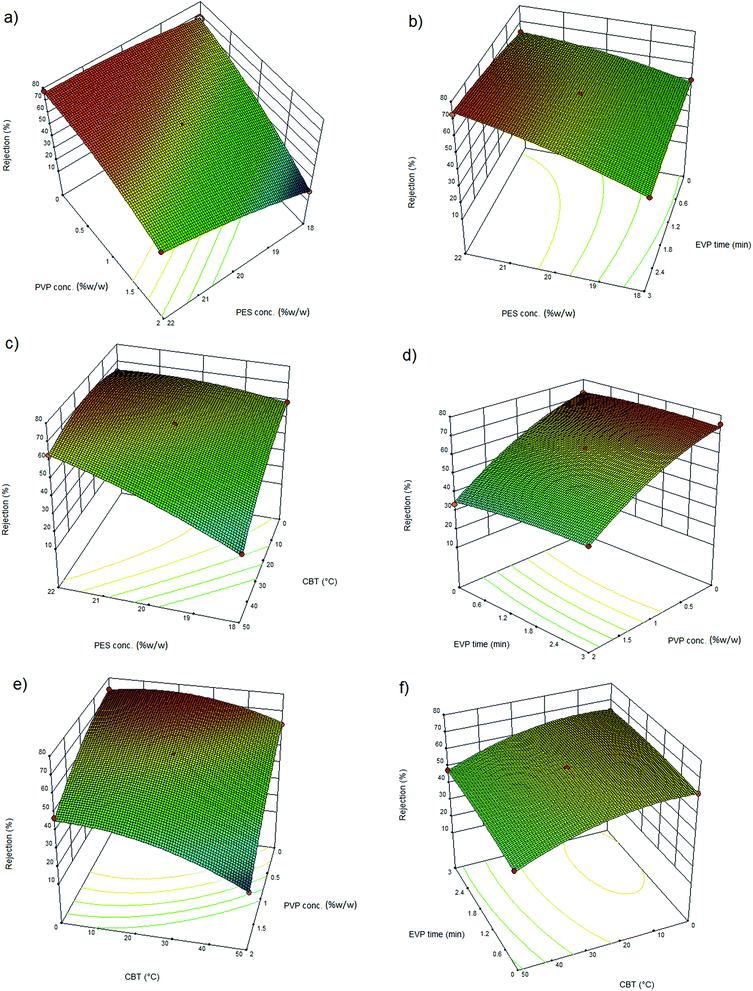
The effect of polymer concentration in the dope solution on water flux and salt rejection of the PES NF membranes is shown in Fig. 3(a–c), 4(a–c), 5(a–c) and 6(a–c). As observed, the effect of polymer concentration on the NF membrane separation performance is considerable. With an increase in polymer concentration, the water flux and salt rejection of the nanofiltration membranes decreases and increases, respectively. This phenomenon can be attributed to the fact that the increase in polymer concentration leads to the formation of smaller macrovoids and increases the membrane top layer thickness. The dope solution viscosity increases with an increase in the polymer concentration and this reduces the solvent and non-solvent exchange rate and consequently increases the polymer concentration at the interphase of the solvent and non-solvent. Therefore, delayed demixing occurs, the coagulation rate decreases and a lower amount of non-solvent penetrates into the dope solution. Fig. 7 shows the cross section structure of the fabricated NF membranes fabricated using different polymer concentrations. As observed, the membranes formed with a lower concentration of PES exhibit a porous structure with finger-like macrovoids (instantaneous demixing), whereas those formed with a higher PES concentration exhibit a sponge-like porous structure with a denser and thicker upper layer (delayed demixing).44 Similar results with other polymeric membranes have been reported elsewhere.34,44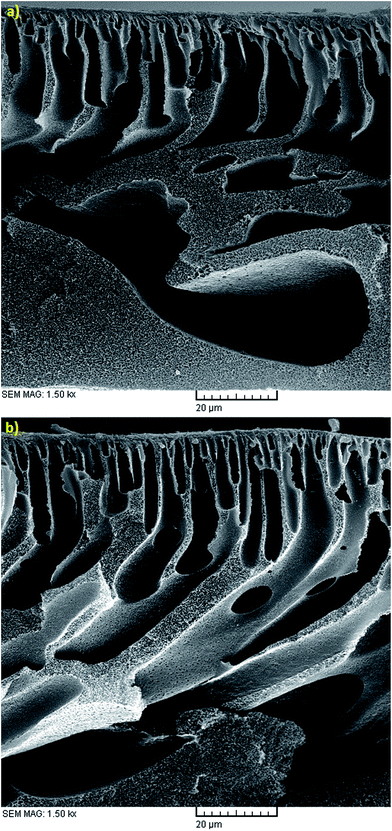 | ||
| Fig. 7 Cross sectional SEM images of the membranes fabricated with 1 wt% PVP, EVP time of 0 min, CBT of 25 °C and PES conc. of (a) 18 wt% and (b) 22 wt%. | ||
3.4. Effect of PVP concentration on permeation flux and rejection
The effects of additives on membrane structure and performance are indicated by two mechanisms during phase inversion: thermodynamic enhancement and kinetic hindrance;18 however, rationalization and certain prediction of this highly complex thermodynamic/kinetic tradeoff is not easy.45 As observed in Fig. 2 and discussed in Section 3.2, by introducing PVP into the casting solution, thermodynamic enhancement tends to enhance the solvent–non-solvent demixing rate, whereas kinetic hindrance tends to reduce due to increased viscosity and subsequently decreased diffusion coefficient.46 The effect of PVP concentration on the separation performance of the PES NF membranes is presented in Fig. 3(a, d and e), 4(a, d and e), 5(a, d and e) and (a, d and e). As observed, with an increase in PVP concentration, the permeation flux and rejection of the membranes increases and decreases, respectively, which shows the influence of thermodynamic enhancement. As observed in Fig. 8, by the addition of 2% PVP, the water contact angle of the membranes reduces from 75° to 64°. PVP improves the hydrophilicity of the membranes which increases permeation flux.33 Moreover during the phase inversion, the hydrophilic PVP increases the water–DMAc exchange rate and thus acts as pore forming agent. As observed in the cross section SEM images (Fig. 9), the membranes fabricated with a higher PVP concentration exhibit a porous structure with wider finger-like macrovoids, which results in a higher permeation flux and lower rejection of the PES nanofiltration membranes.33,34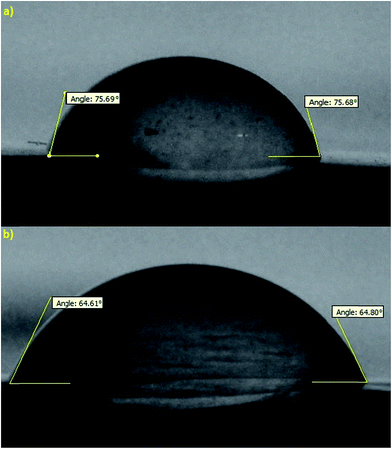 | ||
| Fig. 8 Effect of PVP conc. on the hydrophilicity of the fabricated membranes: (a) 0 wt% and (b) 2 wt%. | ||
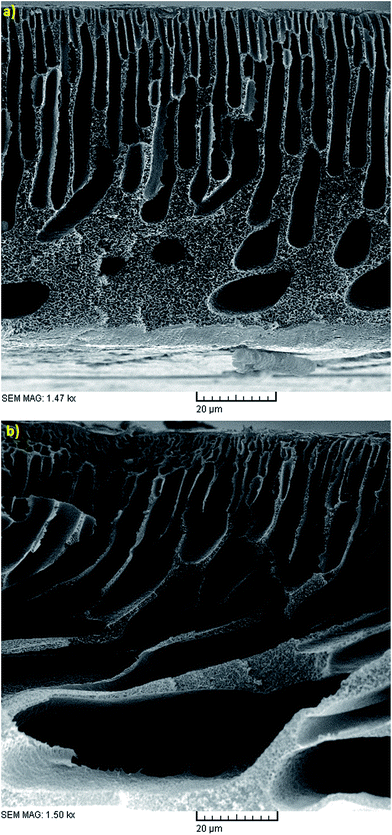 | ||
| Fig. 9 Cross sectional SEM images of the membranes fabricated with 18 wt% PES, EVP time of 1.5 min, CBT of 25 °C and PVP conc. of: (a) 0 wt% and (b) 2 wt%. | ||
3.5. Effect of evaporation time on permeation flux and rejection
Evaporation (EVP) time, which is defined as the time interval between polymeric dope solution casting and immersion in the coagulation bath, affects the structure of the skin layer in asymmetric membranes. As observed in Fig. 3(b, d and f), 4(b, d and f), 5(b, d and f) and 6(b, d and f), although this effect is not tangible in the formation of the PES NF membranes in comparison with the two previously mentioned effects, i.e. PES conc. and PVP conc., the permeation flux and rejection decreases and increases, respectively, by increasing the EVP time from 0 to 3 min. The longer EVP time allows more solvent evaporation and as a consequence the polymer concentration in the top layer increases, which leads to delayed demixing and the formation of a dense and thicker top layer. This dense layer in the coagulation bath acts as a barrier against solvent and non-solvent exchange and finally membranes with lower porosity are formed (Fig. 10). These less porous membranes exhibit a lower permeation flux and higher rejection compared with that immersed in the coagulation bath immediately.34,44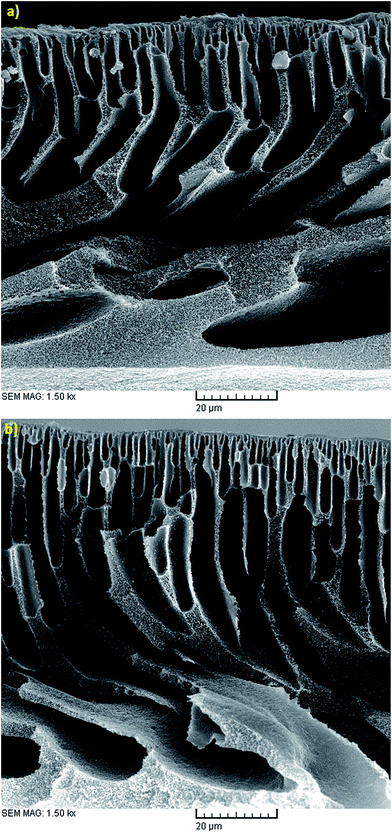 | ||
| Fig. 10 Cross sectional SEM images of the membranes fabricated with 22 wt% PES, 1 wt% PVP, CBT of 25 °C and EVP time of (a) 0 min and (b) 3 min. | ||
3.6. Effect of coagulation bath temperature on permeation flux and rejection
The effect of coagulation bath temperature (CBT) on the separation performance of the PES NF membranes is presented in Fig. 3(c, e and f), 4(c, e and f), 5(c, e and f) and 6(c, e and f). As observed, with an increase in CBT from 0 °C to 50 °C, the rejection and permeation flux decreases and increases, respectively. In general, during the coagulation process, demixing is faster at a higher temperature. Instantaneous demixing leads to the formation of macrovoids and porous structures. At a lower temperature during delayed demixing on the top layer, inhibition of the free growth of nuclei occurs and only many small nuclei are formed. Thus, the formation of macrovoids is suppressed and denser PES NF membranes are formed (Fig. 11).44 As observed in Fig. 11, a reduction in permeation flux occurs by increasing the CBT from 25 °C to 50 °C. This phenomenon can be attributed to the fact that thicker membranes are formed at a higher CBT, which lead to a reduction in permeation flux. This observation has been also reported by other researchers.47–49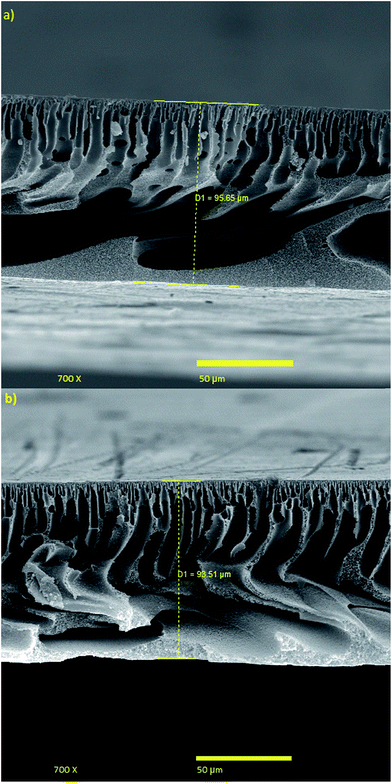 | ||
| Fig. 11 Cross sectional SEM images of the membranes fabricated with 18 wt% PES, 1 wt% PVP, EVP time of 1.5 min and CBT of: (a) 50 °C and (b) 0 °C. | ||
3.7. RSM optimization
The final polynomial models proposed by RSM can predict the permeation flux and rejection of non-experimented points in reasonable limits and also the optimized conditions. As observed in Table 4, using a response optimizer, the maximum permeation flux of 159.84 kg m−2 h−1 is achieved at a PES conc. of 18 (% w/w), PVP conc. of 2 (% w/w), EVP time of 0 min and CBT of 50 °C. Also, the maximum rejection of 78.41% is obtained at a PES conc. of 22 (% w/w), PVP conc. of 0 (% w/w), EVP time of 3 min and CBT of 0 °C. As observed, a trade-off between permeation flux and rejection exists i.e. at conditions where permeation flux is highest, rejection is lowest and vice versa. Therefore, if simultaneously acceptable values of permeation flux and rejection are considered, the membrane fabricated at a PES conc. of 18 (% w/w), PVP conc. of 1 (% w/w), EVP time of 0 min and CBT of 25 °C is a good candidate. The values of permeation flux and rejection in this condition are 70.01 kg m−2 h−1 and 50.66%, respectively.| PES (% w/w) | PVP (% w/w) | EVP Time (min) | CTB (°C) | Permeation flux (kg m−2 h−1) predicted | Permeation flux (kg m−2 h−1) experimental | Residual | Error (%) | Rejection (%) predicted | Rejection (%) experimental | Residual | Error (%) |
|---|---|---|---|---|---|---|---|---|---|---|---|
| 18 | 2 | 0 | 0 | 145.76 | 159.84 | 14.08 | 9.65 | 33.50 | 32.64 | 0.86 | 2.63 |
| 22 | 0 | 3 | 25 | 10.64 | 9.89 | 0.74 | 7.53 | 78.97 | 78.41 | 0.56 | 0.71 |
| 18 | 1 | 0 | 25 | 67.20 | 70.01 | 2.81 | 4.01 | 49.55 | 50.66 | 1.11 | 2.19 |
Furthermore, in order to validate the adequacy of the model, the experimental data and predicted values were compared by means of residual and percentage of error. As observed in Table 4, the experimental and predicted values of permeation flux and rejection are mathematically in good agreement and the percentages of error fall within 10% and 3%, respectively.
These results indicate the high potential of this model for the prediction and optimization of permeation flux and rejection of PES/PVP NF membranes.
4 Conclusion
Polyethersulfone (PES)/polyvinylpyrrolidone (PVP) NF membranes were fabricated successfully via phase inversion. RSM using the Box–Behnken statistical model was used to examine the effects of four important fabricating parameters, including PES concentration, PVP concentration, evaporation time and coagulation bath temperature, on the membrane morphology, permeation flux and rejection. The results reveal that among the studied parameters, PES concentration and PVP concentration are significant parameters affecting the performance of the membranes. This study shows that RSM is a suitable approach to optimize the fabrication of PES/PVP NF membranes to achieve maximum permeation flux and rejection. The small deviations between the predicted and experimental values confirm the accuracy and validity of the model.References
- C. V. Bart Van Der Bruggen, T. V. Gestel, W. Doyen and R. Leysen, Environ. Prog., 2003, 22, 46–56 CrossRef.
- N. B. Darwish, V. Kochkodan and N. Hilal, Desalination, 2017, 403, 161–171 CrossRef.
- T. M. Abdolhamid Salahia, R. M. Behbahanib and M. Hemmatic, J. Environ. Chem. Eng., 2015, 3, 170–178 CrossRef.
- S. D. Zhikan Yao, Y. Zhang, B. Zhu, L. Zhu and A. Ebanezar John Key, Journal of Water Process Engineering, 2015, 8, 99–107 CrossRef.
- L.-X. B. Tian-Yin Liu, H.-G. Yuan, B. Pang, Y.-K. Lin, Y. Tong, B. Van der Bruggen and X.-L. Wang, J. Membr. Sci., 2015, 478, 25–36 CrossRef.
- F. E. Ahmed, B. S. Lalia, N. Hilal and R. Hashaikeh, Desalination, 2017, 406, 60–66 CrossRef CAS.
- K. K. Davor Dolar and B. Vučić, Desalination, 2011, 265, 237–241 CrossRef.
- Y. H. T. A. W. Mohammad, W. L. Ang, Y. T. Chung, D. L. Oatley-Radcliffe and N. Hilal, Desalination, 2015, 365, 226–254 CrossRef.
- L. Z. Dong Zhou, Y. Fu, M. Zhu and L. Xue, Desalination, 2015, 376, 109–116 CrossRef.
- L. S. Wangxi Fang and R. Wang, J. Membr. Sci., 2013, 430, 129–139 CrossRef.
- P. Y. Qing Chen, W. Huang, S. Yu, M. Liu and C. Gao, J. Membr. Sci., 2015, 492, 312–321 CrossRef.
- J. M. Oluranti Agboola, R. Mbaya, A. Kolesnikov, R. Sadiku, A. Verliefde and A. D'Haese, Korean J. Chem. Eng., 2015, 32, 731–742 CrossRef.
- D. J. J. B. A. M. Al-Rashdi and N. Hilal, Desalination, 2013, 315, 2–17 CrossRef.
- J.-f. W. Hong-mei Xu and X.-l. Wang, Desalination, 2014, 346, 122–130 CrossRef.
- C. Z. Yang Yu, Y. Wang, W. Fan and Z. Luan, J. Environ. Sci., 2013, 25, 302–307 CrossRef.
- W.-D. S. Quan-Fu An, Q. Zhao, Y.-L. Ji and C.-J. Gao, J. Membr. Sci., 2013, 431, 171–179 CrossRef.
- N. P. Tiara Puspasari and K.-V. Peinemann, J. Membr. Sci., 2015, 491, 132–137 CrossRef.
- S. B. Mohtada Sadrzadeh, J. Membr. Sci., 2013, 441, 31–44 CrossRef.
- I. F. J. V. Agnieszka and K. Hołda, J. Appl. Polym. Sci., 2015, 132, 1–17 Search PubMed.
- W. J. L. G. S. Lai, P. S. Goh, A. F. Ismail, N. Yusof and Y. H. Tan, Desalination, 2016, 387, 14–24 CrossRef.
- X. S. Li Wang, T. Wang, S. Wang, Z. Wang and C. Gao, Appl. Surf. Sci., 2015, 330, 118–125 CrossRef.
- D. W. Bing Zhang, Y. Wu, Z. Wang, T. Wang and J. Qiu, Desalination, 2015, 357, 208–214 CrossRef.
- Y. H. G. Zeng, Y. Zhan, L. Zhang, Y. Pan, C. Zhang and Z. Yu, J. Hazard. Mater., 2016, 317, 60–72 CrossRef PubMed.
- R. Z. Jing Miao and R. Bai, J. Membr. Sci., 2015, 493, 654–663 CrossRef.
- K. S. Jianqiang Wang, B. Cao, L. Li and K. Pan, J. Chem. Technol. Biotechnol., 2016, 91, 777–785 CrossRef.
- S. H. Sonawane, A. Terrien, A. S. Figueiredo, M. Clara Gonçalves and M. N. De Pinho, Polym. Compos., 2017, 38, 32–39 CrossRef CAS.
- C.-D. L. Tao Xiang, R. Wang, Z.-Y. Han, S.-D. Sun and C.-S. Zhao, J. Membr. Sci., 2015, 476, 234–242 CrossRef.
- Y. S. Yanan Liu, X. Zhao, Y. Li, R. Zhang and Z. Jiang, J. Membr. Sci., 2015, 486, 195–206 CrossRef.
- L. Z. Dongzhu Wu, V. K. Vakharia, W. Salim and W. S. Winston Ho, J. Membr. Sci., 2016, 510, 58–71 CrossRef.
- P. S. G. Muhammad Nidzhom Zainol Abidin, A. F. Ismail, M. H. Dzarfan Othman, H. Hasbullah, N. Said, S. H. Sheikh Abdul Kadir, F. Kamal, M. S. Abdullah and B. C. Ng, Mater. Sci. Eng., C, 2016, 68, 540–550 CrossRef PubMed.
- B. A. Agnieszka, K. Hołda, W. Saeys and I. F. J. Vankelecom, J. Membr. Sci., 2013, 442, 196–205 CrossRef.
- G. K. Katrien Hendrix and I. F. J. Vankelecom, J. Membr. Sci., 2014, 452, 241–252 CrossRef.
- B. Vatsha, J. C. Ngila and R. M. Moutloali, Physics and Chemistry of the Earth, 2014, 67–69, 125–131 CrossRef.
- S. S. Madaeni, N. Arast, F. Rahimpour and Y. Arast, Desalination, 2011, 280, 305–312 CrossRef CAS.
- İ. H. B. Deniz Baş, J. Food Eng., 2007, 78, 836–845 CrossRef.
- I. N. Abdolhamid Salahi, R. Badrnezhad, B. Kanjilal and T. Mohammadi, J. Environ. Chem. Eng., 2013, 1, 218–225 CrossRef.
- S. Zinadini, A. A. Zinatizadeh, M. Rahimi, V. Vatanpour and H. Zangeneh, J. Membr. Sci., 2014, 453, 292–301 CrossRef CAS.
- N. Ghaemi, S. S. Madaeni, P. Daraei, H. Rajabi, T. Shojaeimehr, F. Rahimpour and B. Shirvani, J. Hazard. Mater., 2015, 298, 111–121 CrossRef CAS PubMed.
- T. Mohammadi, P. Kazemi and M. Peydayesh, Desalin. Water Treat., 2015, 56, 2306–2315 CrossRef CAS.
- J. Barzin and B. Sadatnia, Polymer, 2007, 48, 1620–1631 CrossRef CAS.
- R. M. Boom, H. W. Reinders, H. H. W. Rolevink, T. van den Boomgaard and C. A. Smolders, Macromolecules, 1994, 27, 2041–2044 CrossRef CAS.
- I. M. Wienk, R. M. Boom, M. A. M. Beerlage, A. M. W. Bulte, C. A. Smolders and H. Strathmann, J. Membr. Sci., 1996, 113, 361–371 CrossRef CAS.
- M.-J. Han and S.-T. Nam, J. Membr. Sci., 2002, 202, 55–61 CrossRef CAS.
- M. A. Alaei Shahmirzadi, S. S. Hosseini, G. Ruan and N. R. Tan, RSC Adv., 2015, 5, 49080–49097 RSC.
- P. Vandezande, L. E. M. Gevers and I. F. J. Vankelecom, Chem. Soc. Rev., 2008, 37, 365–405 RSC.
- M. Sadrzadeh and S. Bhattacharjee, J. Membr. Sci., 2013, 441, 31–44 CrossRef CAS.
- E. Saljoughi, M. Amirilargani and T. Mohammadi, Desalination, 2010, 262, 72–78 CrossRef CAS.
- X. Hu, C. Xiao and M. Liu, Fibers Polym., 2014, 15, 1429–1435 CrossRef CAS.
- X. Wang, L. Zhang, D. Sun, Q. An and H. Chen, J. Appl. Polym. Sci., 2008, 110, 1656–1663 CrossRef CAS.
| This journal is © The Royal Society of Chemistry 2017 |

