 Open Access Article
Liquefaction of waste pine wood and its application in the synthesis of a flame retardant polyurethane foam†
Dizhu Yuea,
Oluwasola Oribayoa,
Garry L. Rempelb and
Qinmin Pan *a
*a
aCollege of Chemistry, Chemical Engineering and Materials Science, Soochow University, Suzhou 215123, Jiangsu, P. R. China. E-mail: qpan@suda.edu.cn
bDepartment of Chemical Engineering, University of Waterloo, Waterloo, Ontario N2L 3G1, Canada
First published on 12th June 2017
Abstract
The utilization of sustainable forestry waste resources in the production of polyurethane (PU) foam is a promising green alternative to the use of un-sustainable resources. In this work, we report the liquefaction of waste pine wood at different reaction temperatures and its application in synthesizing a melamine phosphate modified wood type polyurethane foam (designated as MWPU). Our strategy was to obtain liquefied pine-based polyol at an optimum reaction temperature and apply the polyol in synthesizing a flame retardant (MWPU) foam via the incorporation of a melamine phosphate (MP) filler. Spectroscopic and microscopic analyses were conducted to investigate the structure characteristics and the morphology of the liquefied waste pine wood polyol and the synthesized (MWPU) foam. An optimum liquefaction temperature of 160 °C was obtained and the glass transition temperature (Tg) for 10 wt% incorporated MP foam was 43.8 °C. The as-prepared (MWPU) foam showed higher glass transition temperature and storage modulus than pine wood based PU foam without MP. The MWPU foam withstood heating at 300 °C without significant degradation and also exhibited a higher thermal stability and limited oxygen index (LOI) value than pine wood based PU foam. These results provided an insight into the physical and structural properties of the as-prepared bio-based foam and paved the way toward preparing bio-based PU foam, which could further expand its potential applications.
Introduction
Polyurethanes are a broad class of polymeric materials with urethane moieties as the main linkage and polyurethane (PU) foam represents one of its most important three dimensional products with regard to versatile applications. It is widely used in various applications such as home furnishings (i.e. bedding and carpet underlay), insulating material in building construction, thermal insulation systems in refrigerators and freezers, packaging and fitting cushioning for the transportation of goods.1–3 Presently, the synthesis of conventional PU foam is heavily petroleum dependent because the two main raw materials, isocyanates and polyols, are largely petroleum derived and the flammability issue associated with PU foam can result in fire related casualties and loss of property.2,4,5 However, with the global depletion of oil production in oil fields, increasing rise in oil prices and environmental concerns such as global warming, the production of PU foam from renewable resource (bio-based polyols) has generated much interest and the need for fire retardant properties in PU foam is imperative.6–8Lignocellulosic biomass also referred to as plant dry matter (i.e. waste wood) is an important renewable resource for the production of fine chemical such as bio-based polyol. It is composed of three major constituents namely cellulose, hemicelluloses and lignin, as well as smaller amounts of pectin, protein, extractives and ash, which together form its rigid structure. The agriculture and forestry industry regularly generate waste such as wood, wheat straw, corn bran and cornstalks, which are bio-resources. The wood resources are the quickly renewable bio-resources. They contain a large variety of lignocellulosic biomass having more than two hydroxyl groups per molecule, but its solid characteristics restrict its utilization as wood-based polyol.9,10 One of the approaches of obtaining polyols from these renewable resources is through liquefaction. Liquefaction of wood is a chemical processes in which the macromolecular components of wood are depolymerized and converted into a liquid.11,12 These obtained liquefied wood contains highly reactive aromatic and aliphatic hydroxyl groups which can be used as substitutes to the polyol produced from crude oil for the preparation of PU foams.11 Therefore, this calls for the development of greener cost-effective techniques to prepare PU foam from renewable sources composed of biomass, such as liquefied wood-based polyols.
D'Souza et al.13 synthesized bark-based polyols through solvent liquefaction of wood bark in a polyethylene glycol/glycerol co-solvent. Their results showed that the liquefied biomass induced a high degree of modification to the bark components and provided an insight into the physical and structural properties of the produced bark-based polyols. However, their studies mainly focus only on the liquefaction behaviour and characterization of the bark-based polyols without considering its application as a substitute for petroleum based polyols in producing PU foam.
Kosmela et al.14 synthesized bio-polyols via crude glycerol-based liquefaction of cellulose. They concluded that the optimal parameters for the bio-polyol production with a 94% yield could be achieved at 150 °C for 6 h liquefaction reaction duration. However, the liquefied bio-polyol was not further utilized for the production of any bio-based material.
Luo et al.15 prepared the lignin/soy oil-based polyurethane bio-foam by using lignin powder as a reactive reinforcing filler via a free-rising method. The dynamic mechanical analysis (DMA) results show that the mechanical property of the samples with 10% lignin was the best. However, their works mainly focus on using lignin powder as reactive reinforcing filler without considering using liquid lignin as polyol.
Zhang et al.16 investigated the biodegradation of a wood-based PU foam produced by utilizing liquefied wood polyol and polymethylene polyphenylisocyanate, through a one-shot method. The biodegradability of the synthesized PU foam was studied by soil burial for a period of 12 months. Their result showed that the use of liquefied wood polyol in the foam formulation aids the accelerated degradation of the PU foam. However, there was very limited information about the liquefaction temperature effect on the obtained liquefied wood polyol used in producing the PU foam. The use of an optimum liquefaction condition will improve the properties of the produced PU foams and in turn could further enhance the foam degradation.
Jasiukaitytë et al.11 studied the liquefaction of wood at 150 °C and found that at this temperature, its lignin composition was modified by glycols undergoing condensation reactions with the phenolic hydroxyls to produce aliphatic hydroxyl groups. However, their work only studied the liquefaction behaviour of the wood at 150 °C. However, since the molecular structures and properties of the polyols determine the properties of PU foams, it is necessary to investigate how liquefaction temperature affects the characteristics of polyol.
On the other hand, PU foam is easily ignited and has caused an increasing number of fire-related casualties and property losses in recent years.17,18 The development of PU foam with fire-protection properties should be of upmost important to decrease the fire-related casualties and property loss. One of the most expeditious methods to prevent fire-related casualties from PU foam is to incorporate flame-retardants into the foam.19 In the last few years, halogen-containing flame-retardant compounds have been extensively studied.20,21 But the thermal degradation or burning of a flame retardant polymer with halogen-containing compounds releases toxic gases.22 In addition, the density and toxicity of smoke are considered to be important factors for evaluating the fire safety of materials.23 Therefore, recent developments are geared toward flame retardant polymers without halogen-containing compounds, such as melamine phosphate (MP). This compound, a halogen-free flame-retardant made from a reaction product of melamine and phosphoric acid has also been applied for various uses, such as fire proof coatings and flame-retardant plastics, for its low toxicity and high flammable retardant efficiency.24–26 Therefore, due to its effectiveness and non-toxic gas release when burnt in comparison to halogen containing compound, MP was incorporated into wood type polyurethane foam in this study.
In this present study, PU foam was synthesized from liquefied waste pine wood polyol. The idea was to obtain a liquefied pine-based polyol at optimum reaction temperature and apply it to synthesize melamine phosphate modified wood type polyurethane (designated as MWPU) foam via the incorporation of MP filler. This liquefaction reaction condition is aimed to increase the reactivity of the hydroxyl functional groups in the pine-based polyol, which in turn enhance the poly-condensation process during the synthesis of the bio-based polyurethane foam. Furthermore, since the molecular structure and properties of polyol affect the structure of the synthesized PU foam, the effect of the liquefaction reaction temperature on the liquefied pine-based polyol was investigated. In addition, the thermal stability, mechanical properties and flammability of the MWPU foams were also elucidated.
Experimental section
Materials
Pine wood powders (80 mesh) were supplied by Chinese Jieda Wood Powder Industry (Linyi, China). Poly(ethylene glycol)-400 (PEG-400), 1,4-dioxane, pyridine and ethylene glycol were obtained from Jiangsu Qiangsheng Chemistry Co. Ltd (Suzhou, China). Dibutyltin dilaurate was purchased from Macklin Biochemical Co. Ltd (Shanghai, China). Melamine phosphate was purchased from Kangfei Chemical Co. Ltd (Zhengzhou, China). Silicon oil was purchased from Aladdin Industrial Corporation (Shanghai, China). Sulphuric acid was purchased from Sinopharm Chemical Regent Co. Ltd (Shanghai, China). Phthalic anhydride was obtained from Shanghai Ling Feng Chemical Regent Co. Ltd. Imidazole was purchased from Energy Chemical Co. Ltd (Shanghai, China). Polyphenylmethanepolyisocyanate (PMDI) was purchased from Wanhua Chemical Group Co. Ltd (Yantai, China). Water used in this study was deionized in the laboratory.Liquefaction process
The liquefaction of the waste pine wood was carried out in a 250 mL three-neck flask under nitrogen atmosphere with constant stirring. Dried pine wood powder, liquefaction solvents (PEG-400/glycol: 4/1, w/w) and 98 wt% sulphuric acid (3 wt%) were added into the flask. The flask was kept at liquefaction temperature of 120–180 °C in an oil bath for 120 min and nitrogen gas purge was used to remove the generated water. Once the reaction was completed, the resulting mixture was dissolved in a binary solvent of 1,4-dioxane and water (8/2, v/v) and filtered subsequently. The obtained dioxane-insoluble product was then oven dried and weighed to determine the amount of un-liquefied pine wood residue. The percent of insoluble residue was determined by:| D = W2/W1 × 100% | (1) |
Preparation of MWPU foams
20 g of liquefied products with 4 mL of solvent (1,4-dioxane) was added to a beaker and kept at 70 °C in an oil bath for 10 minutes. After the content in the beaker was cooled down to room temperature, 0.65 g of surfactant (silicon oil), 0.47 g of catalyst (dibutyltin dilaurate) and 0.5 mL bowling agent (de-ionized water) and different amount of MP fillers (5 wt% to 10 wt%) were added into the beaker. The mixture was stirred for 3 minutes and pre-weighted PMDI (16.7 g) was added into the beaker with vigorous stirring for another 15–20 s. Afterwards, the resultant foaming mixture was quickly transferred into a mould (11.5 cm × 7.5 cm × 4.5 cm), where it was allowed to rise freely (free-rise process). Finally, the foam was allowed to cure at ambient conditions for a minimum of 2 days to ensure it was fully cured. The foams were then cut into specimens of desired dimensions for further testing and measurements.Determination of hydroxyl number of polyols
Standard esterification method (ASTM D4274) was used in determining the polyol hydroxyl value. Specifically, the polyols sample was weighed and added into a 250 mL Erlenmeyer flask, followed by the addition of 25 mL of esterification reagent (phthalic anhydride and imidazole in pyridine). The flask was capped with aluminium foil and pre-warmed in a water bath and swirled to ensure that the polyols were dissolved completely. The flask was then placed in an oil bath maintained at 100 °C for 15 min. After that, the flask was removed from the oil bath and cooled to ambient temperature before titration. Titration was conducted using a 0.5 N standard NaOH solution and the end point was determined by a digital pH meter. The hydroxyl value (OH) in milligrams of KOH per gram of the sample was determined by:
 | (2) |
Characterisation
Fourier transform infrared spectrometer (Thermo Scientific Nicolet IS10) was used to confirm the functional group in the liquefied polyol and synthesized (MWPU) foam. The FTIR spectrum was recorded in wavenumbers in the range of 4000–400 cm−1 with signal averaging of 32 scans at a resolution of 4 cm−1. Thermogravimetric analysis (TGA) of the foam samples were performed on a thermal analyser (Discovery TGA, USA TA instruments) with a dynamic temperature scan from 30 °C to 700 °C at a constant heating rate of 10 °C min−1. The TGA analysis was performed with about 4–5 mg of the sample placed in a platinum crucible in an inert atmosphere of nitrogen gas with a flow rate of 10 mL min−1. LOI was performed with ASTM D2863 limited oxygen index test meter (FTT0080, UK). The internal geometrical structure and surface morphology of the bio-based PU foam were studied using a (HitachiS-4700, Japan) scanning electron microscope operating at 15 kV. The elemental analysis of the char residue was studied by SEM-EDS (ZEISS EVO18, Germany). The carbon and proton NMR analysis was performed to obtain structures of liquefied wood polyol. The carbon and proton NMR spectra were recorded on a Bruker 300 Fourier transform spectrometer at 300.13 MHz in DMSO-d6 with tetramethylsilane (TMS) as internal standard. The dynamic mechanical analysis (DMA) of the (MWPU) foam was obtained using DMA (Q-800 TA, USA). The storage modulus, loss modulus and tan![[thin space (1/6-em)]](https://www.rsc.org/images/entities/char_2009.gif) δ were recorded at a frequency of 1 Hz over the temperature range from −60 °C to 100 °C. The temperature ramp rate was controlled at 2 °C min−1.
δ were recorded at a frequency of 1 Hz over the temperature range from −60 °C to 100 °C. The temperature ramp rate was controlled at 2 °C min−1.
Results and discussion
Liquefaction yield and hydroxyl value of liquefied wood products
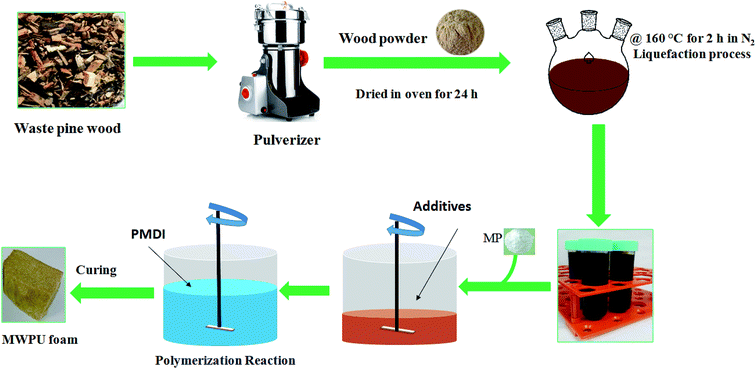
The primary objective of this work was to synthesize bio-based melamine phosphate polyurethane foam (designated as MWPU) utilizing green sustainable forestry waste resources. Shown in Fig. 1 are the schematic diagram for the waste pine wood liquefaction and the fabrication process for producing MWPU foam. As illustrated, waste pine wood powder was obtained and liquefied to transform it as the primary wood-based polyol used for the synthesis of the MWPU foam.In this study, the liquefied residue content was used as an indicator of the liquefaction extent. Shown in Table 1 is the change in the liquefied residue content as a function of different liquefaction temperatures. These results show that the residue degree decreased from 78 wt% to 23.1 wt% as liquefaction temperature increased from 120 °C to 180 °C, indicating accelerated liquefaction reactions with increasing temperatures. At 120 °C, less than half of the pine wood powder was liquefied. This might be because at low temperatures, only accessible polysaccharides such as hemicelluloses and amorphous cellulose can be liquefied.27 At 160 °C, the residue degree was decreased, which is consistent with literature that lignin was modified by glycols undergoing a condensation reactions with the phenolic hydroxyls to produce aliphatic hydroxyl functional groups.13
It should be noted that the residue amounts are relatively higher than those reported in the literature for other types of biomass. This could be attributed to the phenolic compounds which were easily re-condensed into insoluble large molecular weight lignin-based polymers, thereby increasing the amount of residues.28 In addition, the liquefaction reaction at temperatures more than 160 °C resulted in substantial degradation of cellulose.29–31 Therefore, liquefaction reaction temperature of 160 °C was seen an optimum liquefaction temperature in obtaining pine wood-based polyol for the fabrication of (MWPU) foam.
The hydroxyl value of the bio-based polyol is an important factor in the properties of PU foams produced. As shown in Table 1, the OH value increased as liquefaction temperature increased. The OH value range of 287 mg g−1 KOH to 472 mg g−1 KOH was obtained. It should be noted that the obtained OH value for the liquefied polyol was greater than that of PEG400. Thus, it can be used with PEG400 to decrease the cost of producing foam.
FTIR analysis of liquefied waste pine wood and synthesized foams
FTIR analysis was conducted to investigate the structure characteristics of the liquefied waste pine wood polyol and the MP was incorporated in the pine wood PU foam. Shown in Fig. 2(i) is a comparison of the liquefied wood at different liquefaction temperature. The prominent peaks were found at 3384 cm−1 (O–H stretching) and 2876 cm−1 (C–H stretching) in all of three polyols. It was also observed that there were peaks at 1954 cm−1 and 1718 cm−1, which can be attributed to the C![[double bond, length as m-dash]](https://www.rsc.org/images/entities/char_e001.gif) C stretching and C
C stretching and C![[double bond, length as m-dash]](https://www.rsc.org/images/entities/char_e001.gif) O stretching originating from fatty acid and hemicelluloses, respectively.32,33 It can also be inferred that hemicelluloses are peeled off from adjacent lignin or cellulose into solution and there is also presence of levulinate and formic esters in these polyols.34,35 However, the intensity of both peaks in L120 is very low, which means glucose would not have been degraded under 120 °C reaction conditions. The peak at 1646 cm−1 is an indication of a conjugated carbonyl.36 These conjugated carbonyls are common feature in the oxidation products of lignin.13 Furthermore, a very weak intensity peak, attributed to the skeleton vibration of the benzene ring in lignin, is observed at 1503 cm−1. Compared to the intensity of this peak in L180 and L120, the peak in L160 is also more prominent, which could be due to the higher concentration of the lignin fragment in L160. In addition, the peak at 1250 cm−1 indicated that the phenol hydroxyl groups of the phenylpropane structure in the lignin reacted with the liquefied solvents in the final product.37,38 The strong absorption peaks at 1455 cm−1 and 1113 cm−1 were originally from co-solvent of PEG400 and glycerol.39
O stretching originating from fatty acid and hemicelluloses, respectively.32,33 It can also be inferred that hemicelluloses are peeled off from adjacent lignin or cellulose into solution and there is also presence of levulinate and formic esters in these polyols.34,35 However, the intensity of both peaks in L120 is very low, which means glucose would not have been degraded under 120 °C reaction conditions. The peak at 1646 cm−1 is an indication of a conjugated carbonyl.36 These conjugated carbonyls are common feature in the oxidation products of lignin.13 Furthermore, a very weak intensity peak, attributed to the skeleton vibration of the benzene ring in lignin, is observed at 1503 cm−1. Compared to the intensity of this peak in L180 and L120, the peak in L160 is also more prominent, which could be due to the higher concentration of the lignin fragment in L160. In addition, the peak at 1250 cm−1 indicated that the phenol hydroxyl groups of the phenylpropane structure in the lignin reacted with the liquefied solvents in the final product.37,38 The strong absorption peaks at 1455 cm−1 and 1113 cm−1 were originally from co-solvent of PEG400 and glycerol.39
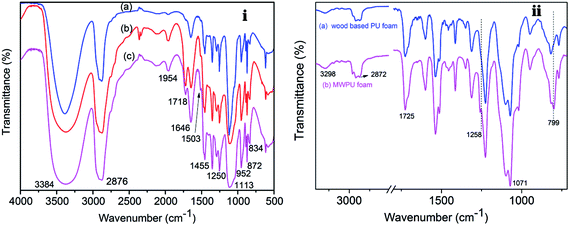 | ||
| Fig. 2 (i) The FTIR spectra of liquefied products (a) L120, (b) L160 and (c) L180, and (ii) the FTIR spectra of (a) wood based PU foam, (b) MWPU foam. | ||
The FTIR spectra of wood type PU foam without MP filler and MWPU foam with MP filler are shown in Fig. 2(ii). The bands around 3298 cm−1 (O–H stretching), 2872 cm−1 (C–H stretching), 1071 cm−1 (–COO– stretching) exist in both wood based PU and MWPU foam. The adsorption band at 1725 cm−1 were attributed to the stretching vibration at the hydrogen-bonded carbonyl group between the N–H and C![[double bond, length as m-dash]](https://www.rsc.org/images/entities/char_e001.gif) O groups of the urethane structure.9 After the MP filler was incorporated into the foam, some new peaks like 1258 cm−1 and 799 cm−1 could be observed. The peaks at 1258 cm−1 and 799 cm−1 were assigned to P
O groups of the urethane structure.9 After the MP filler was incorporated into the foam, some new peaks like 1258 cm−1 and 799 cm−1 could be observed. The peaks at 1258 cm−1 and 799 cm−1 were assigned to P![[double bond, length as m-dash]](https://www.rsc.org/images/entities/char_e001.gif) O stretching and the triazine rings, respectively.40–42 The FTIR spectra showed that MP filler was incorporated in the pine wood PU foam.
O stretching and the triazine rings, respectively.40–42 The FTIR spectra showed that MP filler was incorporated in the pine wood PU foam.
Carbon and proton NMR analysis of the liquefied wood products
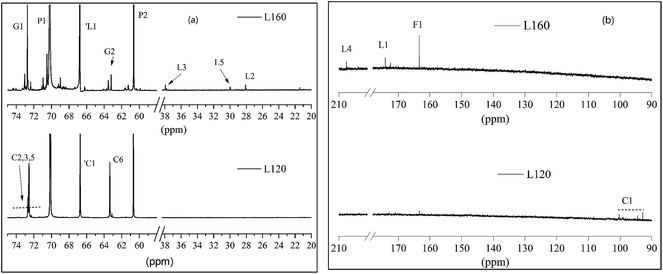
The 13C NMR spectra of the liquefied products are shown in Fig. 3. Comparing the three polyols, it was found that the L160 and L180 polyol were similar, while the peak intensity in the region 20–40 ppm and 90–210 ppm of L180 was very weak. The assignments of secondary carbons (P1) and primary carbons (P2) (Fig. 4) within PEG are 70.2 ppm and 60.6 ppm, respectively. The peaks intensity at 72.7 ppm and 63.1 ppm are attributed to the primary carbons (G1) and secondary carbons (G2) of glycerol, respectively.13,43 Only the liquefaction temperature at 120 °C shows the presence of glucose. Due to the anomeric effect, there were numerous peaks. The peak assignments made for 1C1, C1, C6 are shown in Fig. 3. The peaks in the region typical of C2, C3, C4 and C5 can also be observed. At 160 °C and 180 °C, the glucose had degraded into levulinate and formic esters and this result was well in accordance with the analysis results of FTIR. The assignments of carboxyl peaks of a levulinate ester (L1, L4) and a formic ester (F1) can be seen in Fig. 3b, as well as the methylene (L2, L3) and methyl (L5) carbons.13,29 Carbon NMR chemical shift of liquefied polyol is shown in Table S1 (ESI†). Furthermore, these results are corroborated by the proton NMR spectra.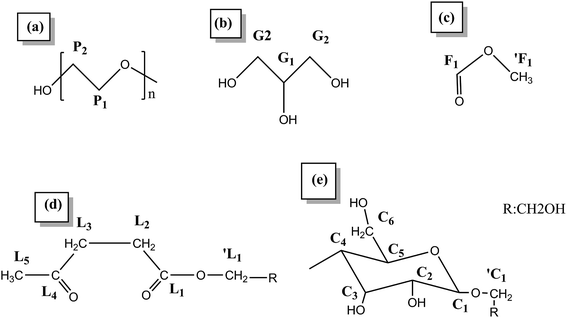 | ||
| Fig. 4 The structure nomenclature for NMR assignments of (a) PEG, (b) glycerol, (c) formic ester, (d) levulinate, and (e) glucose. | ||
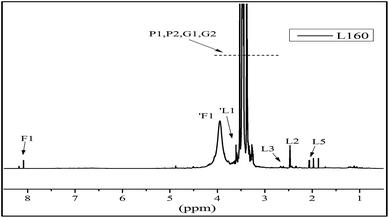
The 1H NMR spectra of the liquefied products are shown in Fig. 5. In the region of chemical shift from 2.0 ppm to 3.0 ppm are the proton peaks of the levulinate ester methylene L2 and L3 and the methyl proton peak L5, the aldehydic proton (1F1) from a formic ester, and the methylene protons (L1 and F1) from the alcohol side of the respective esters. In the region from 0.5 ppm to 2.0 ppm, the peaks are attributed to the methyl and methylene from the structure of PEG and glycerol.13 Furthermore, the liquefaction process of the wood at 160 °C could convert the sterically-hindered phenolic hydroxyls into an accessible aliphatic hydroxyl. This is favoured by industries because it could react readily with polyphenylmethanepolyisocyanate (PMDI) in producing more temperature stable urethane linkages, compared to phenolic-based polyols.43 Therefore, in our present study, the optimal condition for liquefaction of wood was to carry out at 160 °C for 2 hours.
Morphology of foams
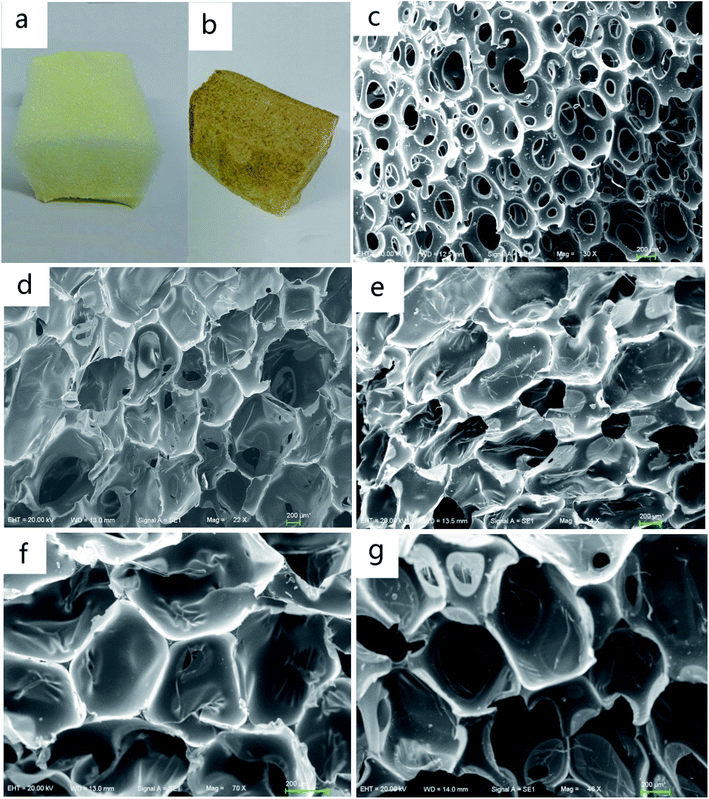
The MWPU foams prepared using liquefied pine wood without MP filler incorporation (0 wt% MP) are designated as P2 and those prepared with MP filler incorporation are designated as P3, P4 and P5 respectively. The PU foam synthesized without liquefied wood biomass and MP is designated as P6. Fig. 6a and b shows the digital photograph of PU foam (P6) and MWPU foam (P2) respectively. Although the color of MWPU foam (P2) is much darker than the PU foam (P6) without liquefied wood biomass, the distribution of the pine wood based MWPU foam (P2) cells appears similar to that of the PU foam (P6) as shown in Fig. 6c and d. Fig. 6d–g shows the SEM morphology of the pine wood based MWPU foams containing 0 wt%, 5 wt%, 7.5 wt%, and 10 wt% of MP, respectively.As observed from morphology of the PU foam (P6), the foam consists of open cells and wide cell walls. MWPU foams (P2–P5), they are mostly closed compared to PU foam (P6). The thermal conductivity of PU foam depends on the ratio of closed-cell to open-cell content.44–46 Thus, the MWPU foams (P2–P5) are better than PU foams (P6) for material thermal insulation due to its lower thermal conductivity. Additionally, it can be observed that the cells of 0 wt% MWPU foam (P2) are broken and collapsed. Furthermore, with the addition of MP, the overall cell structure became more uniform and well-defined, and the cell walls became thinner. Alteration in the cell morphology is due to the presence of MP, which affects the process of cell nucleation.47 The uniform cells and thinner cell walls are important in controlling the mechanical properties of PU foam,48 which is consistent with the results shown in Table 3.
Thermal behaviour and flammability properties of MWPU foams
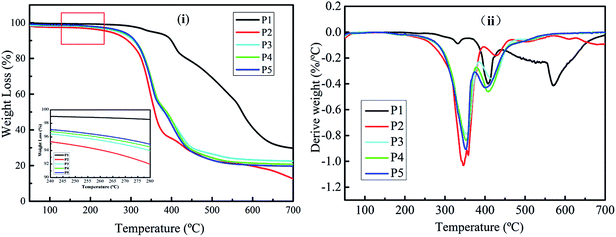
The thermal properties of the foam were investigated by TGA, using five independent sample measurement as shown in Fig. S1 (ESI†) and its average value is tabulated in Table 2. As shown in Fig. 7, the temperature where there is an initial 5% weight loss is defined as the decomposition onset temperature (Tonset), and the temperature at which the degradation rate reaches a maximum is defined as Tmax. The results show that the Tonset of the MP is 351.5 °C, which is mainly due to the dehydration of MP.49,50 Furthermore, there are two Tmax for MP at 408 °C and 570 °C, which could be assigned to the decomposition of melamine pyrophosphate and melamine polyphosphate produced during the dehydration process.51–53 The decomposition of melamine pyrophosphates and melamine polyphosphates occured during the dehydration proceeds with the evolution of ammonia due to deamination and some water as confirmed by the evolved gas analysis (Fig. S3A and B†).24,54,55 Finally, the amount of MP char left is about 29.74 wt% at 700 °C under N2 atmosphere as stated in Table 2. On the other hand, the Tonset of 0 wt% MWPU foam is 242.0 °C and only one Tmax at 346.6 °C was found. The weight loss of the first degradation stage is due to the pyrolysis of the urethane bond; urethanes are known to be relatively thermally unstable materials, primarily due to the presence of urethane bonds.5 At temperatures above 346.6 °C, the amount of 0 wt% MWPU foam loss could be assigned to the pyrolysis of the liquefied wood polyol which contain cellulose and lignin as the soft segment in the PU foam.43 Ultimately, only 12.74 wt% of the residue is left at 700 °C, indicating that 0% MWPU foam is a flammable material with poor thermal resistant. However, as the results show, the Tonset of 5 wt% to 10 wt% MWPU foam is higher than that of 0 wt% MWPU foam because the MP was introduced in the foam. As the amount of MP increased, the Tonset of the foam is also increased. This is because the Tonset of MP is much higher than the original PU foam, thus, improving the thermal stability of the PU foam. Although it is degraded at temperatures above 350 °C, the Tmax1 and Tmax2 of the different MWPU foams (5 wt% to 10 wt%) were similar, but still higher than 0 wt% MWPU foam. Additionally, the residues of the MWPU foams (5 wt% to 10 wt%) were higher than the 0 wt% MWPU foam at 700 °C under a N2 atmosphere, implying an enhancing effect on thermal stability by MP. An increase in the residue amount is an important sign that means the improvement in the thermal stability and flammability performance of polymeric materials.56| Sample | MP contents (wt%) | Tonsetb (°C) | Tmaxc (°C) | Residue at 700 °C (wt%) | LOI/vol% | |
|---|---|---|---|---|---|---|
| 1st stage | 2nd stage | |||||
| a Under an inert atmosphere of nitrogen gas with a flow rate of 10 mL min−1, the temperature sweep ranged from 30 °C to 700 °C.b Tonset: initial degradation temperature (temperature at 5% weight loss).c Tmax: maximum weight loss rate temperature. | ||||||
| P1 | MP | 351.5 | 408.0 | 570.0 | 29.74 | — |
| P2 | 0 | 242.0 | 346.6 | — | 12.74 | 18.5 |
| P3 | 5 | 268.5 | 352.4 | 416.7 | 22.56 | 19.0 |
| P4 | 7.5 | 275.3 | 352.0 | 408.1 | 20.73 | 19.6 |
| P5 | 10 | 279.3 | 351.4 | 402.6 | 19.68 | 21.7 |
The burning behaviours of MWPU foams were analysed by the LOI test and the LOI values of MWPU foams are listed in Table 2. In the LOI test, each foam specimen was placed vertically using a sample holder in a mixture of oxygen and nitrogen flowing upwards through a glass column. Each foam specimen was ignited with a flame and was burned downward into the unheated foam material. By testing a series of specimens in different oxygen concentrations, the minimum concentration of oxygen that will support the flaming combustion of the specimens were determined.57–59 For pine wood type PU foam (0 wt% MWPU foam), the LOI value is around 18.5 vol% and serious bending deformation of the material was seen after 28 seconds of burning. This suggests that it is easy to ignite during the combustion process. However, after adding the MP, the LOI value increased as the amount of MP increased. For the 10 wt% MWPU foam, the oxygen concentration was 21.7 vol%. Meanwhile, when the sample was ignited, flame propagation clearly slowed down compared to the wood type foam without MP. Then the flame gradually became smaller, and finally extinguished within 12 seconds (Fig. S4†). Therefore, the produced MWPU foam is non-flammable in comparison with the bio-based PU foam.
Morphological characterization of the char residues
The morphology and elemental analysis of the char residues from P2 and P5 foam were characterized by SEM-EDS as shown in Fig. 8, to further elucidate the anti-flaming performance of the foam char layer. It could be observed from the microstructures of P2 that its outer char has holes (Fig. 8a) and its inner char is loose (Fig. 8b). In contrast, there is continuous and compact structure in both the outer and inner char of P5 (Fig. 8c and d respectively). This loose and permeable nature of P2 char residue, indicate that P2 does not possess any flame shield for its polymeric substrate. In contrast, P5 possesses flame shield for its polymeric substrate and it has lots of bubble pack closely together on the inner surface and plenty of rugged creases on its outer surface. This char layer of P5 could slow down heat which thereby prevents the underlying polymeric substrate of the foam from further attack by heat flux. The formations of this efficient char from P5 aid prevent the heat transfer between the flame zone and the burning P5 foam substrate, thus illustrating its flame retardant property. Also, the decomposition of the MP in the foam produces some non-combustible gases which dilute the oxygen in the air, resulting in an enhancement of flame retardancy.1,2,60 The elemental mapping technique of SEM-EDS (Fig. S5†), shows clearly the spatial distributions of C, O, P and N elements in the char residue of P5. This elemental analysis indicate that about 4.6 wt% of element P still remain in the residue char.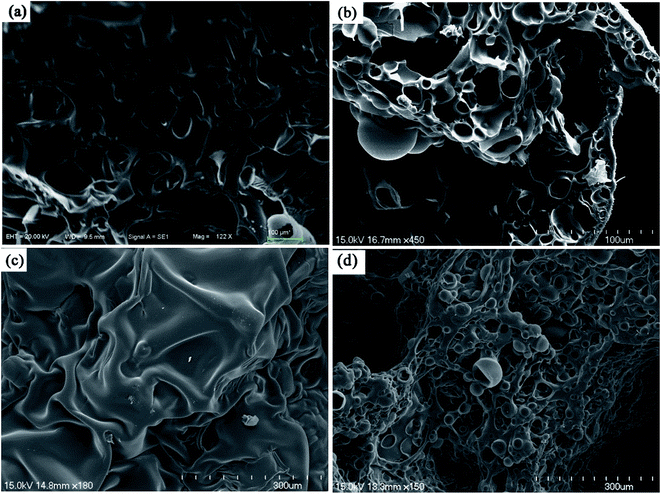 | ||
| Fig. 8 The SEM micrographs of the char residues after LOI test: outer (a) and inner (b) of P2; outer (c) and inner (d) of P5, respectively. | ||
Dynamic mechanical analysis and density of MWPU foam
In general, foam density is an important parameter that influences the properties and performances of polyurethane foams.48 In Table 3, the values of density of prepared MWPU foams are presented. The density of 0 wt% MWPU foam is lower than any other MWPU foam. In addition, with the increase of MP from 5 wt% to 10 wt%, the densities of MWPU foams are slightly increased from 0.084 g cm−3 to 0.116 g cm−3. This might be due to the increase of viscosity of the reactant mixtures and the formation of closed and uniform cell structure after the addition of the MP filler.41 The tensile property was measured by microcomputer control electronic universal testing machine (WDT-20 KQL, China), the result is shown in the Fig. S6.†| Sample | MP content (wt%) | Storage modulus/MPa | Loss modulus/MPa | Tan![[thin space (1/6-em)]](https://www.rsc.org/images/entities/char_2009.gif) δ δ |
Tg/°C | Density/(g cm−3) |
|---|---|---|---|---|---|---|
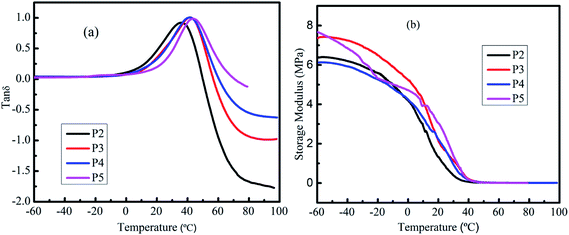
| P2 | 0 | 6.359 | 0.621 | 0.92 | 36.2 | 0.082 |
| P3 | 5 | 7.344 | 0.773 | 1.00 | 41.6 | 0.084 |
| P4 | 7.5 | 6.117 | 0.728 | 1.02 | 41.3 | 0.092 |
| P5 | 10 | 7.903 | 0.639 | 0.99 | 43.8 | 0.116 |
Since PU foams are often used as packaging materials, such as pipe coatings, the damping performance of PU foam is significant. The mechanical damping factor is defined as the ratio of loss and storage modulus (tan delta).61 The damping properties of the material give the balance between the elastic phase and viscous phase in a polymeric structure.62 The dynamic mechanical properties of MWPU foams have been examined in this work. The tan![[thin space (1/6-em)]](https://www.rsc.org/images/entities/char_2009.gif) δ curves of MWPU foams are shown in Fig. 9a. The temperature corresponding to the maxima of the tan
δ curves of MWPU foams are shown in Fig. 9a. The temperature corresponding to the maxima of the tan![[thin space (1/6-em)]](https://www.rsc.org/images/entities/char_2009.gif) δ is generally considered the glass transition temperature (Tg). It was observed that only one peak maximum existed in the MWPU foams. This implies that the present MWPU foam can be considered as a homogeneous blend.63 In addition, with the increase of MP content, the Tg also increased. Generally, on the molecular scale, Tg represents the mobility level of polymer chains/networks in the material and an increased Tg corresponds to decreased segmental mobility of the polymer chains.64,65 On the other hand, materials which have a tan
δ is generally considered the glass transition temperature (Tg). It was observed that only one peak maximum existed in the MWPU foams. This implies that the present MWPU foam can be considered as a homogeneous blend.63 In addition, with the increase of MP content, the Tg also increased. Generally, on the molecular scale, Tg represents the mobility level of polymer chains/networks in the material and an increased Tg corresponds to decreased segmental mobility of the polymer chains.64,65 On the other hand, materials which have a tan![[thin space (1/6-em)]](https://www.rsc.org/images/entities/char_2009.gif) δ value beyond 0.3 can be considered to have the damping effect.66–69 Therefore, the temperature range for each formulation having a damping effect is from 14.59 °C to 47.09 °C for P2, 17.72 °C to 53.35 °C for P3, 18.60 °C to 55.84 °C for P4 and 24.90 °C to 60.82 °C for P5. This improvement of the temperature range for damping effect is attributed to the limit in molecular motion because of the incorporation of MP into the foam.70 Also, the maximal tan
δ value beyond 0.3 can be considered to have the damping effect.66–69 Therefore, the temperature range for each formulation having a damping effect is from 14.59 °C to 47.09 °C for P2, 17.72 °C to 53.35 °C for P3, 18.60 °C to 55.84 °C for P4 and 24.90 °C to 60.82 °C for P5. This improvement of the temperature range for damping effect is attributed to the limit in molecular motion because of the incorporation of MP into the foam.70 Also, the maximal tan![[thin space (1/6-em)]](https://www.rsc.org/images/entities/char_2009.gif) δ values listed in Table 3 are similar. Since the tan
δ values listed in Table 3 are similar. Since the tan![[thin space (1/6-em)]](https://www.rsc.org/images/entities/char_2009.gif) δ provides information on the relative contributions of the viscous and elastic components of a viscoelastic material,69 MWPU foams have the almost same elastic nature.
δ provides information on the relative contributions of the viscous and elastic components of a viscoelastic material,69 MWPU foams have the almost same elastic nature.
Fig. 9b shows the storage modulus as a function of temperature for MWPU foams. It was observed that the storage modulus of the MWPU foams decreased with the increase in temperature. This is because of the softening of polymers at higher temperatures as the chain mobility increases at higher energies.71 It should be noted that two factors can affect the storage modulus. The first factor is the crosslinking degree of composites. With high cross-linking, the storage modulus of all formulations is also comparatively higher.72 Secondly, the addition of MP particles increases the storage modulus of the MWPU foams by restricting the molecules mobility. In addition, the MP particles may decrease the crosslinking degree of the foam. Interestingly, both in the glass region and rubbery region, the storage modulus of P3 and P5 are higher than P2. This can be described by the facts that the addition of MP filler restricts the movements of the PU polymer chains. The storage modulus of P4 is lower than for P2 in the glass region, which might be because the effect of the MP can not compensate for its effect on the decrease of the cross-linking degree. Furthermore, above 10 °C (rubbery region), it was observed that the storage modulus of MWPU foams increased significantly with increasing the percentage of MP filler. While being heated, the polymer chain segments moves easily and this induces the decrease of the storage modulus. The loss modulus is listed in the Table 3. It can be found that the loss modulus of the sample P3 to P5 is improved compared to the sample P2. This is consistent with the literature, in that the filler particles added into the MWPU foams enhances the internal friction and thus results in the improvement of the dissipation of energy.73
Conclusions
Waste pine wood was liquefied at different reaction temperature and the effect of the liquefaction on the structure and composition of the produced polyols was studied. The optimal liquefaction temperature of 160 °C, produced bio-based polyols with aliphatic groups, which has better reactivity with isocyanate to produces more temperature stable urethane linkages, compared to phenolic-based polyols.Furthermore, the polyol was applied to synthesize MWPU foam via incorporating MP fillers. In comparison to the bio-based PU foam (0 wt% MWPU foam), the MWPU foams showed improved mechanical properties and thermal stability. The Tg of 10 wt% MWPU foam was 43.8 °C higher than that of the 0 wt% MWPU foam. The MWPU foam (5 wt% to 10 wt%) could withstand heating at 300 °C without significant degradation and it was found to have higher thermal stability than the MWPU foam (0 wt%). Also, the incorporated MP caused the LOI value to increase by 21.7 vol%. Moreover, the MP fillers improved the storage modulus and loss modulus of the resultant MWPU foam. This as-prepared MWPU foam is greener and more environmentally friendly, which is expected to pave the way toward expanding the potential application of PU foams.
Acknowledgements
Financial supports from the National Natural Science Foundation of China (NSFC, No. 21176163; No. 21576174), Suzhou Industrial Park, the Priority Academic Program Development of Jiangsu Higher Education Institutions, the Program of Innovative Research Team of Soochow University and Natural Sciences and Engineering Research Council of Canada (NSERC) are gratefully acknowledged.References
- H. Zhu, Z. Peng, Y. Chen, G. Li, L. Wang, Y. Tang, R. Pang, Z. U. H. Khan and P. Wan, RSC Adv., 2014, 4, 55271–55279 RSC.
- M. Xue, X. Zhang, Z. F. Wu, H. Wang, Z. Gu, C. Bao and X. Y. Tian, J. Appl. Polym. Sci., 2014, 131, 39772 CrossRef.
- H. W. Engels, H. G. Pirkl, R. Albers, R. W. Albach, J. Krause, A. Hoffmann, H. Casselmann and J. Dormish, Angew. Chem., Int. Ed., 2013, 52, 9422–9441 CrossRef CAS PubMed.
- B. Käbisch, U. Fehrenbacher and E. Kroke, Fire Mater., 2014, 38, 462–473 CrossRef.
- S.-H. Lee, Y. Teramoto and N. Shiraishi, J. Appl. Polym. Sci., 2002, 83, 1482–1489 CrossRef CAS.
- H. Singh and A. K. Jain, J. Appl. Polym. Sci., 2009, 111, 1115–1143 CrossRef CAS.
- Y. Kurimoto, K. Shirakwawa, M. Yoshioka and N. Shiraishi, FRI Bulletin – Forest Research Institute, New Zealand Forest Service, 1992 Search PubMed.
- H. Pan, Z. Zheng and C. Y. Hse, Eur. J. Wood Wood Prod., 2011, 70, 461–470 CrossRef.
- R. Mori, Wood Sci. Technol., 2015, 49, 507–516 CrossRef CAS.
- W.-J. Lee and M.-S. Lin, J. Appl. Polym. Sci., 2008, 109, 23–31 CrossRef CAS.
- E. Jasiukaitytė, M. Kunaver and C. Crestini, Catal. Today, 2010, 156, 23–30 CrossRef.
- A. Kržan and M. Kunaver, J. Appl. Polym. Sci., 2006, 101, 1051–1056 CrossRef.
- J. D'Souza and N. Yan, ACS Sustainable Chem. Eng., 2013, 1, 534–540 CrossRef.
- P. Kosmela, A. Hejna, K. Formela, J. T. Haponiuk and Ł. Piszczyk, Cellulose, 2016, 23, 2929–2942 CrossRef CAS.
- X. Luo, A. Mohanty and M. Misra, Ind. Crops Prod., 2013, 47, 13–19 CrossRef CAS.
- H. Zhang, H. Pang, L. Zhang, X. Chen and B. Liao, J. Polym. Environ., 2012, 21, 329–334 CrossRef.
- Y. S. Kim, Y. C. Li, W. M. Pitts, M. Werrel and R. D. Davis, ACS Appl. Mater. Interfaces, 2014, 6, 2146–2152 CAS.
- S. Bourbigot and S. Duquesne, J. Mater. Chem., 2007, 17, 2283–2300 RSC.
- W. Wang, S. Zhang, F. Wang, Y. Yan, J. Li and W. Zhang, Polym. Compos., 2016, 37, 666–673 CrossRef CAS.
- W. Jiang, J. Hao and Z. Han, Polym. Degrad. Stab., 2012, 97, 632–637 CrossRef CAS.
- F. Gao, L. Tong and Z. Fang, Polym. Degrad. Stab., 2006, 91, 1295–1299 CrossRef CAS.
- Y.-j. Chung, Y. Kim and S. Kim, J. Ind. Eng. Chem., 2009, 15, 888–893 CrossRef CAS.
- W. J. Wang, K. He, Q. X. Dong, N. Zhu, Y. Fan, F. Wang, Y. B. Xia, H. F. Li, J. Wang, Z. Yuan, E. P. Wang, Z. F. Lai, T. Kong, X. Wang, H. W. Ma and M. S. Yang, J. Appl. Polym. Sci., 2014, 131, 39936 CrossRef.
- Z. Wang, P. Lv, Y. Hu and K. Hu, J. Anal. Appl. Pyrolysis, 2009, 86, 207–214 CrossRef CAS.
- A. R. Horrocks, Polym. Degrad. Stab., 2011, 96, 377–392 CrossRef CAS.
- Y. Zhang, Y. Liu and Q. Wang, J. Appl. Polym. Sci., 2010, 116, 45–49 CrossRef CAS.
- X. Lu, Y. Wang, Y. Zhang, X. Cheng, Y. Yu and Y. Jin, J. Wuhan Univ. Technol., Mater. Sci. Ed., 2016, 31, 918–924 CrossRef CAS.
- Y. Yao, M. Yoshioka and N. Shiraishi, Mokuzai Gakkaishi, 1993, 39, 930–938 CAS.
- T. Yamada and H. Ono, J. Wood Sci., 2001, 47, 458–464 CrossRef CAS.
- T. Yamada, M. Aratani, S. Kubo and H. Ono, J. Wood Sci., 2007, 53, 487–493 CrossRef CAS.
- E. Jasiukaitytė, M. Kunaver and M. Strlič, Cellulose, 2009, 16, 393–405 CrossRef.
- W. Hoareau, W. G. Trindade, B. Siegmund, A. Castellan and E. Frollini, Polym. Degrad. Stab., 2004, 86, 567–576 CrossRef CAS.
- F. C. Mao, J. Wood Chem. Technol., 2005, 24, 239–262 CrossRef.
- O. Chaikumpollert, Carbohydr. Polym., 2004, 57, 191–196 CrossRef CAS.
- F. Xu, J. X. Sun, C. F. Liu and R. C. Sun, Carbohydr. Res., 2006, 341, 253–261 CrossRef CAS PubMed.
- J. Coates, presented in Part at the Encyclopedia of Analytical Chemistry, Coates Consulting, Newtown, USA, 2000 Search PubMed.
- Y. Jin, X. Ruan, X. Cheng and Q. Lu, Bioresour. Technol., 2011, 102, 3581–3583 CrossRef CAS PubMed.
- A. Sequeiros, L. Serrano, R. Briones and J. Labidi, J. Appl. Polym. Sci., 2013, 130, 3292–3298 CrossRef CAS.
- Y. Zhang, A. Ikeda, N. Hori, A. Takemura, H. Ono and T. Yamada, Bioresour. Technol., 2006, 97, 313–321 CrossRef CAS PubMed.
- H. Yang, L. Song, Q. Tai, X. Wang, B. Yu, Y. Yuan, Y. Hu and R. K. K. Yuen, Polym. Degrad. Stab., 2014, 105, 248–256 CrossRef CAS.
- W. Y. Xing, H. X. Yuan, P. Zhang, H. Y. Yang, L. Song and Y. Hu, J. Polym. Res., 2013, 20, 234 CrossRef.
- Y. Yu, S. Fu, P. a. Song, X. Luo, Y. Jin, F. Lu, Q. Wu and J. Ye, Polym. Degrad. Stab., 2012, 97, 541–546 CrossRef CAS.
- B.-L. Xue, J.-L. Wen and R.-C. Sun, Materials, 2015, 8, 586–599 CrossRef.
- M. Thirumal, N. K. Singha, D. Khastgir, B. S. Manjunath and Y. P. Naik, J. Appl. Polym. Sci., 2010, 116, 2260–2268 CAS.
- M. Thirumal, D. Khastgir, N. K. Singha, B. S. Manjunath and Y. P. Naik, Cell. Polym., 2009, 28, 145–158 CAS.
- R. Yang, W. Hu, L. Xu, Y. Song and J. Li, Polym. Degrad. Stab., 2015, 122, 102–109 CrossRef CAS.
- V. Dolomanova, J. C. M. Rauhe, L. R. Jensen, R. Pyrz, A. B. Timmons, V. Dolomanova, R. Pyrz and A. B. Timmons, J. Cell. Plast., 2011, 47, 81–93 CrossRef CAS.
- M. Thirumal, D. Khastgir, N. K. Singha, B. S. Manjunath and Y. P. Naik, J. Appl. Polym. Sci., 2008, 108, 1810–1817 CrossRef CAS.
- G. Nelson, Fire and polymers, American Chemical Society, Washington, DC, 1990 Search PubMed.
- A. I. Balabanovich, Thermochim. Acta, 2005, 435, 188–196 CrossRef CAS.
- M. Nowak, B. Cichy and E. Kużdżał, J. Therm. Anal. Calorim., 2015, 124, 329–339 CrossRef.
- M. Nowak, B. Cichy and E. Kużdżał, J. Therm. Anal. Calorim., 2016, 126, 277–285 CrossRef CAS.
- B. Cichy, Chemik, 2013, 67, 214–219 CAS.
- X. Lai, X. Zeng, H. Li, F. Liao, C. Yin and H. Zhang, Polym. Compos., 2012, 33, 35–43 CrossRef CAS.
- X. Lai, J. Qiu, H. Li, X. Zeng, S. Tang, Y. Chen and Z. Chen, Int. J. Polym. Sci., 2015, 2015, 1–11 Search PubMed.
- H. Y. Xie, Q. Ye, J. Y. Si, W. Yang, H. D. Lu and Q. Z. Zhang, Polym. Adv. Technol., 2016, 27, 651–656 CrossRef CAS.
- A. Donmez Cavdar, Measurement, 2014, 50, 279–284 CrossRef.
- M. I. Nelson, Combust. Theory Modell., 2006, 5, 59–83 CrossRef.
- G. S. Tay, L. N. Ong and H. D. Rozman, J. Appl. Polym. Sci., 2012, 125, 158–164 CrossRef CAS.
- P. Lv, Z. Wang, K. Hu and W. Fan, Polym. Degrad. Stab., 2005, 90, 523–534 CrossRef CAS.
- N. Saba, M. Jawaid, O. Y. Alothman and M. T. Paridah, Constr. Build. Mater., 2016, 106, 149–159 CrossRef CAS.
- N. Hameed, P. A. Sreekumar, B. Francis, W. Yang and S. Thomas, Composites, Part A, 2007, 38, 2422–2432 CrossRef.
- G. Toriz, R. Arvidsson, M. Westin and P. Gatenholm, J. Appl. Polym. Sci., 2003, 88, 337–345 CrossRef CAS.
- C. Wang, L. Ding, M. He, J. Wei, J. Li, R. Lu, H. Xie and R. Cheng, Eur. J. Lipid Sci. Technol., 2016, 118, 1463–1469 CrossRef CAS.
- H. Xie, B. Liu, H. Yang, Z. Wang, J. Shen and R. Cheng, J. Appl. Polym. Sci., 2006, 100, 295–298 CrossRef CAS.
- X. G. Zhang, L. L. Ge, W. Q. Zhang, J. H. Tang, L. Ye and Z. M. Li, J. Appl. Polym. Sci., 2011, 122, 932–941 CrossRef CAS.
- X. C. Bian, J. H. Tang and Z. M. Li, J. Appl. Polym. Sci., 2008, 110, 3871–3879 CrossRef CAS.
- C.-J. Tunc and T.-C. J. Hsu, J. Appl. Polym. Sci., 1992, 46, 1759–1773 CrossRef.
- X.-C. Bian, J.-H. Tang and Z.-M. Li, J. Appl. Polym. Sci., 2008, 109, 1935–1943 CrossRef CAS.
- Z.-Z. Yu, C. Yan, M. Yang and Y.-W. Mai, Polym. Int., 2004, 53, 1093–1098 CrossRef CAS.
- H. Deka, A. Mohanty and M. Misra, Macromol. Mater. Eng., 2014, 299, 552–559 CrossRef CAS.
- N. C. Das, T. K. Chaki and D. Khastgir, J. Appl. Polym. Sci., 2003, 90, 2073–2082 CrossRef CAS.
- A. Hazarika, M. Mandal and T. K. Maji, Composites, Part B, 2014, 60, 568–576 CrossRef CAS.
Footnote |
| † Electronic supplementary information (ESI) available. See DOI: 10.1039/c7ra03546b |
| This journal is © The Royal Society of Chemistry 2017 |

