 Open Access Article
Isolation of functional mitochondria by inertial microfluidics – a new method to sort intracellular organelles from a small scale biological sample
C. Tesauro a,
B. Ferrando
 a,
X. Maab,
M. L. Jepsenab,
A. K. R. Ivarsenbc,
R. Frøhlicha,
T. Stevnsnera,
B. R. Knudsenab and
Y. P. Ho
 *d
*d
aAarhus University, Department of Molecular Biology and Genetics, Aarhus, 8000, Denmark
bAarhus University, Interdisciplinary Nanoscience Center (iNANO), Aarhus, 8000, Denmark
cAarhus University, Department of Engineering, Aarhus, 8000, Denmark
dThe Chinese University of Hong Kong, Division of Biomedical Engineering, Department of Electronic Engineering, Faculty of Engineering, Shatin, N.T., Hong Kong SAR, China. E-mail: ypho@ee.cuhk.edu.hk
First published on 3rd May 2017
Abstract
Isolation of subcellular fractions from a limited amount of clinical sample is imperative for the continuous advancement of biological and clinical research. For example, analyses of pure and functional mitochondria from patient samples are expected not only to expand our knowledge towards the basic biological mechanisms of mitochondrial function, but also to elucidate how mitochondria are involved in the development of diseases such as cancers, premature aging syndromes, diabetes and neurodegenerative disorders. While currently available methods are mostly laborious and not suitable for small-scale analyses, we present a novel and facile approach to isolate mitochondria from limited amounts of biological samples by centrifugal-based differential migration. Furthermore, sorting cellular organelles by their intrinsic inertia enjoys the benefits of easy operation, undemanding equipment needs and continuous batch processing. Herein, we have successfully isolated functional mitochondria from crude cell lysate of less than 100 cells, which demonstrates the possibilities of promoting this methodology for detailed analyses of subcellular organelles, particularly when small-scale clinically relevant samples are considered.
Introduction
Isolation of subcellular fractions of low abundance has enabled more efficient identification and study of intracellular organelles of interest and is, consequently, essential for the continuous advancement of biology. For instance, isolation of mitochondria, the so-called “power houses” of the cells, may help to investigate the anabolic and catabolic processes in which the mitochondria are involved.1–3 Elucidating the functions of mitochondria in detail is particularly important since defective mitochondria have been linked to several important human diseases including cancers,4–6 premature aging syndromes,7 diabetes8,9 and neurodegenerative disorders.10,11 To this end, it becomes imperative to develop a platform capable of isolating functional mitochondria particularly from a small amount of sample, since in practice clinical samples are often limited in size. Indeed, analyses of mitochondria from healthy or sick tissue samples are expected not only to expand our knowledge towards the basic biological mechanisms of mitochondrial function, but also to elucidate the role of mitochondria in human disease development. Currently available methods for isolation of intact mitochondria are mostly laborious, typically requiring cell lysis, fractionation, and purification of mitochondria from cytosol12,13 and is therefore not suitable for small-sample analysis. For example, the density-gradient centrifugation is a widely used and robust approach, but often requires many labour-intensive steps, rendering it only practical for large-scale needs. The process is also complicated by the request of differential centrifugations and buffer exchange steps. Immunoisolation is highly specific, but it also demands multiple steps. Both methods are time- and sample-consuming, with steps performed in series resulting in significant sample loss during handling, which poses a remarkable barrier for the analysis of precious clinical samples.Microfluidics, typically referred to as the science that deals with the behaviour and manipulation of fluids in the scale of tens to hundreds of micrometers, is able to minimize sample and reagent consumption, to shorten the reaction time with large surface-to-volume ratio, to reduce the cost, to enable portability, and to offer automation for minimal human intervention.14–17 Therefore, this technology has enabled many new promising possibilities for biomedical and chemical applications.18 Owing to the advantages offered by microfluidics, as compared to conventional macro-scale technologies (e.g. centrifugation, flow cytometry, etc.), many microfluidics-based innovations have been proposed for rapid isolation of organelles from small amounts of samples. For instance, the microfluidic field flow fractionation device is developed for continuous separation of subcellular organelles by isoelectric focusing (IEF).19 However, the enrichment of organelles using IEF requires prior knowledge of the isoelectric point (pI) of the target organelles. Take mitochondria for example, previous reports have identified the pIs of mitochondria, but the obtained value varies depending on the source and method used for the characterization,20–23 making the isolation unreliable solely based on the pI. To address this issue, capillary IEF (cIEF) plus laser induced fluorescence24 presents an accurate determination of the pI of individual mitochondria by the use of internal standards. However, the specificity of mitochondrial sorting by cIEF relies heavily on the optimization of the applied electric field strength and demands an extended run time and a high power input. The long exposure to the electric field is likely to affect the organelles adversely and causes Joule heating. Furthermore, the equipment request is not well-suited for the standard biology or biomedical laboratory setup. In addition to the methods that require external force field (i.e. electrical field as mentioned above, or magnetic field), strategies that rely on biochemical reaction offers intrinsically high specificity. An on-chip immunoseparation protocol25 takes advantage of specific antibodies against the translocase outer membrane protein of the mitochondria, which are immobilized on the surface of microchannels using an avidin–biotin sandwich construct. Although this affinity-based microfluidics has shown a direct retention of functional mitochondria, this method suffers from the imposed limitation that it is difficult to retrieve the isolated mitochondria.
To address the unmet need of isolating cellular organelles from small-scale samples, we present a novel and facile approach to isolate functional mitochondria from small amount of biological samples by the so-called inertial microfluidics, more specifically, by the centrifugal-based differential migration.26 Sorting particles by their inertia offers great benefits such as simple equipment and continuous batch process. Even though the number of publications concerning on-chip particles separation relying on inertia has increased exponentially over the last few years, the current applications are mostly limited to rigid particles such as polystyrene beads or cells.26,27 As a proof of concept to separate cellular organelles by centrifugal-based differential migration, we demonstrate the isolation of functional mitochondria from nuclei and cell debris with crude cell lysate of less than 100 cells.
Results and discussion
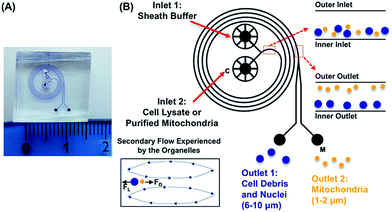
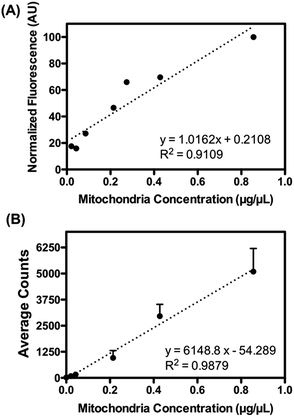
Presented here is a novel strategy to isolate cellular organelles by their intrinsic differences in inertia. Isolation of mitochondria is selected as a model organelle, for its essential and unique roles in metabolisms and cellular functions. Moreover, due to its large diversity, mitochondria present a tangible challenge when it comes to separating this organelle from other cellular components. As shown in Fig. 1, the device, hereafter referred to as the mito chip, is designed to enable effective separation between mitochondria, and nuclei/cell debris (population of 1–2 μm versus population of 6–10 μm), while a similar design has been previously validated for separating polystyrene particles of 1.9 μm and 7.32 μm.28 The inertial lift and so-called Dean drag forces collectively render particles of different sizes to migrate differently along the channel width.26,27 More specifically, mitochondria of smaller sizes compared to other cytosolic fractions (i.e. nuclei and cell debris) migrate to the outer half of the channel, whereas the larger cellular organelles move to the inner half of the channel. The size-dependent equilibrium position is determined by the inertial forces of the particulates and the Dean vortices generated by the spiral channel geometry.Firstly, pre-isolated mitochondria from mouse liver were used to validate the capability of the device. The concentration of purified mitochondria used to feed the mito chip (see below) was predetermined using the Bradford protein assay.29 As a method to quantify the amount of retrieved functional mitochondria isolated by the mito chip, the active mitochondria were stained with a commercially available fluorescent dye, Mitotracker red. This red-fluorescent dye accumulates in mitochondria with a membrane potential – a hallmark for functional mitochondria. Both the total fluorescence intensity (ex. obtained from a fluorimeter) and the numbers of mitochondria (ex. counted by the fluorescent spots using microscopy) were measured to determine the optimal staining conditions. A linear correlation was observed between the measured signal with titrated amount of purified mitochondria (Fig. 2), which suggested that the Mitotracker staining could serve as a facile indication of the amount of retrieved active mitochondria before and after the sorting.
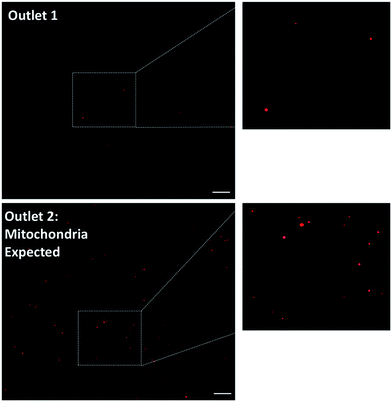
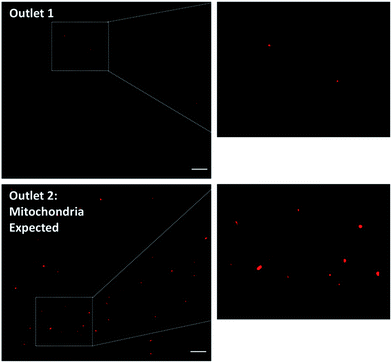
To investigate whether the mitochondria migrate towards the outer ring of the mito chip, purified mouse liver mitochondria (214 ng μL−1) were introduced into the inlet (Fig. 1B, inlet 2, marked with a “C”), while the sheath buffer (Mito buffer) was introduced into the other (Fig. 1B, inlet 1). Samples collected from the two individual outlets were analyzed subsequently without further post-processing. As observed in the representative microscopic images shown in Fig. 3, the mitochondria mostly migrated towards the intended outlet (outlet 2, marked with a “M”), whereas only traces of mitochondria were collected from the other outlet (outlet 1). Similar results were obtained by measuring the total fluorescence after Mitotracker staining (data not shown). For the ease of quantification, the subsequent quantitative analysis was conducted mainly using the total fluorescence obtained by Mitotracker staining as an indication of the retrieved amount of active mitochondria.
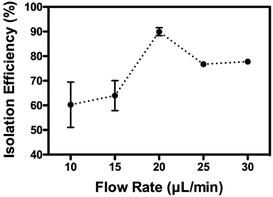
As mentioned previously, the isolation relied on the migration of mitochondria when experiencing the centrifugal-based differential migration. As illustrated in Fig. 1B (lower left corner), the centrifugal acceleration is determined by the magnitude of the secondary flows dominated by the so-called Dean number, which increases with the increase of fluid velocity.30 Although the stronger the Dean vortices, the stronger the centrifugal force acting on the fluid, greater recirculation of flow is counter-productive to the particle separation.28 According to previous studies, the flow is thus limited to De < 1 (in this case, De = 0.66, Uf = 66.7 mm s−1). However, as the physical properties (size, density) of mitochondria remain undetermined, the optimized flow rate of sorting was determined empirically. As shown in Fig. 4, up to 90% of mitochondria were retrieved from outlet 2, when using a flow rate of 20 μL min−1. The optimized volumetric flow rate is in line with what was observed using polystyrene particles of 1.9 μm and 7.32 μm.28 However, less complete separation was observed, most likely due to the heterogeneity of mitochondria compared to polystyrene particles.
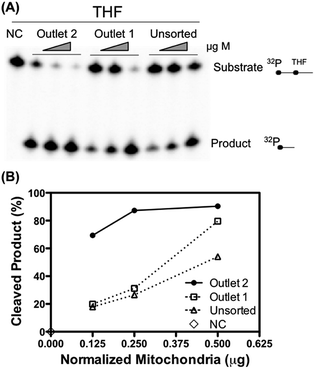
To further validate that the retrieved mitochondria retain their biological functionality, the apurinic/apyrimidinic endonuclease 1 (APE1) activity of unsorted and sorted liver mitochondria was measured. APE1 is an essential DNA repair enzyme involved in the maintenance of mitochondrial DNA stability and thereby maintenance of mitochondrial function.31 The measured APE1 activity was normalized to the total amount of protein to fairly assess the repair activity per unit of mitochondria. As shown in Fig. 5, the mitochondria collected from outlet 2 exhibited a higher DNA repair activity per microgram of protein than the unsorted sample and the sample collected from outlet 1. Mitochondrial function such as DNA repair activity is thought to associate with the morphology of the mitochondria. It would be appealing to study why the mitochondria of the two populations differ with regard to their repair activities.32
A subsequent effort was to address whether the mito chip may be applied for isolation of mitochondria from a small scale biological relevant sample. For this purpose, HeLa cells were selected as a model. Crude cell lysate was prepared following standard protocols.13,33 Briefly, the cells were homogenized by lysing the cell membranes in a hypotonic buffer followed by mechanical disruption with a DOUNCE glass homogenizer. Two hundred μL of the cell lysate was then introduced into the inlet (inlet 2, marked with a “C”) without further pre-processing, while the sheath buffer (Mito buffer) was introduced into the other (inlet 1). Samples from the two individual outlets were collected without further post-processing and then analyzed by Mitotracker staining as previously described. As observed in Fig. 6, a relatively high amount of active mitochondria was retrieved from the outlet 2, to where the mitochondria were expected to migrate, whereas only minimal fraction of mitochondria was collected from outlet 1. Although large nuclei and cell debris were observed to non-specifically absorb onto the channel surface, rendering an altered flow profile, the isolation remained functional. The results clearly demonstrated the potential of the mito chip in isolating functional mitochondria from biological crude samples (i.e. isolation of 200 μL sample in 10 minutes). Perhaps more importantly when it comes to translating the technology into clinical relevant analysis, no delicate equipment but only a standard syringe pump is required for the separation.
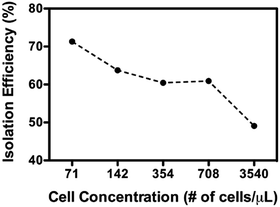
As above-described, non-specific absorption of cell debris was observed when crude cell lysate was used directly for the sorting. The clogging may pose a problem when a large volume of sample is intended for the sorting. To minimize the potential clogging issue under such conditions, a brief pre-centrifugation was introduced to remove large fragments of the cell debris (detailed in the Method section). The sorting was then operated as previously described and the experiments in the following have been made using HEK293T cells as an additional model. As shown in Fig. 7, a greater amount of active mitochondria was consistently retrieved from outlet 2 compared to outlet 1. Of particular note is that the isolation functioned most effectively when optimal concentrations of cells were used (71–708 cells per μL, >60% isolation efficiency). This observation most probably reflects that more cellular contents may affect the flow profile, rendering less optimal sorting (i.e. 3540 cells per μL). Furthermore, the Western blotting analysis has been performed to check the purity of the isolated mitochondria. As evident from Fig. 8, a clear band corresponding to the Ku86 protein (used as the marker for the nuclei) was visualized only in the positive control (WCE: Whole Cell Extract), while the samples sorted from the outlets contain no trace (outlet 2) or very limited trace (outlet 1) of the nuclear protein. Instead, in all the 3 samples a clear band for the mitochondrial specific protein Tom20 was witnessed. Same results were obtained using anti-lamin B antibody as a nuclear marker (data not shown). These observations suggested that only pure mitochondria without any nucleic contaminants were collected from the anticipated outlet, that is the outlet 2. Last but not least, with the brief pre-centrifugation to precipitate the cell debris, the mito chip remained functional for processing at least up to 2 mL of crude cell lysate.
Conclusions
Isolation of cellular organelles from samples of clinical relevant scale has posed a significant challenge to the currently available isolation methods. To confront this issue, this study presents a novel and facile approach to isolate active mitochondria based on the centrifugal-based differential migration. Functional mitochondria have been successfully isolated from crude cell lysate even with less than 100 cells. Aside from the possibility for small-scale analysis, the presented methodology offers many distinct features, including the simple procedures, minimal equipment demands and continuous processing. With this platform capable of isolating functional mitochondria particularly from a small amount of sample, many unmet clinical possibilities are anticipated. For instance, it becomes practical to obtain mitochondria from the patient samples, and to elucidate how defective mitochondria link to the human diseases such as cancers, premature aging syndromes, diabetes and neurodegenerative disorders. Furthermore, the isolation may be tailored for an array of subcellular fractions, rendering more efficient identifications and characterizations of intracellular organelles of interest and, consequently, advancing the study of biology continuously.Experimental methods
Design and fabrication of the chip
The chip was designed based on previous studies28 with slight modifications. The design was overviewed as a 4-loop spiral geometry with two inlets and two bifurcating outlets. The channel width was 100 μm with 250 μm spacing between two successive loops. The initial radius of curvature of the spiral was 1.5 mm and the total length of the microchannels was ∼9 cm. Fabrication of the chip followed standard soft-lithography techniques,34 casting and curing the PDMS prepolymer on a SU-8 3025 (MicroChem) master of a channel height at around 50 μm. PDMS prepolymer (Sylgard 184) was prepared in a 10![[thin space (1/6-em)]](https://www.rsc.org/images/entities/char_2009.gif) :
:![[thin space (1/6-em)]](https://www.rsc.org/images/entities/char_2009.gif) 1 (base
1 (base![[thin space (1/6-em)]](https://www.rsc.org/images/entities/char_2009.gif) :
:![[thin space (1/6-em)]](https://www.rsc.org/images/entities/char_2009.gif) curing agent) ratio and cured at 65 °C for 1 h. After curing, the PDMS strip was peeled off from the SU-8 master, and the input and output ports were cored using a hole puncher (Miltex Biopsy Punch with Plunger, ID 1.0 mm, OD 1.27 mm, Ted Pella, CA, USA). The PDMS strip was then O2 plasma treated (30 s at 20 W, Plasma Asher, Quorum Technologies, West Sussex, RH, USA) and bonded to a 1 mm thick PDMS strip to completely seal the microchannel. Prior to the experiments, the channel was wetted with the Mito buffer (400 mM sucrose, 10 mM TES, 100 μM EGTA and 2 μM DTT supplemented with phosphatases and proteases inhibitors) for at least 15 min. The syringe pump (Harvard Apparatus) was used to control the flow rates of reagents.
curing agent) ratio and cured at 65 °C for 1 h. After curing, the PDMS strip was peeled off from the SU-8 master, and the input and output ports were cored using a hole puncher (Miltex Biopsy Punch with Plunger, ID 1.0 mm, OD 1.27 mm, Ted Pella, CA, USA). The PDMS strip was then O2 plasma treated (30 s at 20 W, Plasma Asher, Quorum Technologies, West Sussex, RH, USA) and bonded to a 1 mm thick PDMS strip to completely seal the microchannel. Prior to the experiments, the channel was wetted with the Mito buffer (400 mM sucrose, 10 mM TES, 100 μM EGTA and 2 μM DTT supplemented with phosphatases and proteases inhibitors) for at least 15 min. The syringe pump (Harvard Apparatus) was used to control the flow rates of reagents.
Preparation of purified mouse liver mitochondria
Mouse liver mitochondria (from C57BL/6J mice) were isolated as previously described.35 Briefly, the liver was homogenized in 10 volumes (w/v) of ice-cold isolation buffer containing 210 mM mannitol, 70 mM sucrose, 5 mM HEPES, 1 mM EDTA, pH 7.35, in the presence of 1.4 U of subtilisin A per mL of buffer. The homogenate was transferred to a centrifuge tube and centrifuged for 10 min at 8500 × g. The supernatant was discarded and the pellet was resuspended in the same volume as in the homogenization step with protease inhibitors (0.15 mM spermine, 0.75 mM spermidine, 1 mM PMSF, 5 mM DTT, 1:1000 protease inhibitor cocktail set III; Calbiochem), and centrifuged for 10 minutes at 500 × g (twice). After that, the liver mitochondria were obtained after centrifugation of the supernatant at 10![[thin space (1/6-em)]](https://www.rsc.org/images/entities/char_2009.gif) 000 × g for 10 min. The mitochondrial pellets were resuspended in 1 mL of isolation buffer without EDTA. All the above procedures were performed at 4 °C. Mitochondrial protein concentration was measured by the Bradford protein assay.29
000 × g for 10 min. The mitochondrial pellets were resuspended in 1 mL of isolation buffer without EDTA. All the above procedures were performed at 4 °C. Mitochondrial protein concentration was measured by the Bradford protein assay.29
AP endonuclease assay
APE1 incision activity in liver mitochondria was assayed using a DNA oligonucleotide containing the AP site analog tetrahydrofuran (THF) (5′-ATA TAC CGC CG![[X with combining low line]](https://www.rsc.org/images/entities/char_0058_0332.gif) CGG CCG ATC AAG CTT ATT-3′, Sigma (
CGG CCG ATC AAG CTT ATT-3′, Sigma (![[X with combining low line]](https://www.rsc.org/images/entities/char_0058_0332.gif) indicates the position of THF)). The oligonucleotide was radioactively labeled at the 5′-end using γ-[32P]ATP (Perkin-Elmer) and T4 polynucleotide kinase (Thermo Scientific). Microspin columns G50 were used to remove the unincorporated ATP (Amersham Bioscience). The labeled oligonucleotide was annealed to a complementary strand (5′-AAT AAG CTT GAT CGG CCG GCG GCG GTT ATA T-3′) and used as a substrate.
indicates the position of THF)). The oligonucleotide was radioactively labeled at the 5′-end using γ-[32P]ATP (Perkin-Elmer) and T4 polynucleotide kinase (Thermo Scientific). Microspin columns G50 were used to remove the unincorporated ATP (Amersham Bioscience). The labeled oligonucleotide was annealed to a complementary strand (5′-AAT AAG CTT GAT CGG CCG GCG GCG GTT ATA T-3′) and used as a substrate.
Mitochondrial proteins were extracted from the isolated liver mitochondria by dilution of whole mitochondria (WM) in a buffer containing 20 mM HEPES/KOH (pH 7.6), 1 mM EDTA, 2 mM DTT, 5% glycerol, and 300 mM KCl for 2 minutes followed by dilution in the same buffer excluding the KCl to give a final concentration of 100 mM KCl. APE1 activity was measured by incubation of 0.125, 0.25 and, 0.5 μg purified liver mitochondria with 15 nmoles of 32P end-labeled DNA substrate containing the THF for 30 minutes at 37 °C, in a 20 μL reaction volume containing 20 mM HEPES pH 7.6, 5 mM EDTA, 75 mM KCl, 1 mM MgCl, 2, 5% glycerol, and 5 mM DTT. Reactions were terminated by addition of 0.4% SDS and 0.2 μg μL−1 of proteinase K, and by 15 minutes incubation at 55 °C. Finally, the samples were mixed with 20 μL of formamide dye and heated for 2 minutes at 90 °C. Substrates and products were separated using a 20% denaturing polyacrylamide gel, and the radioactively labeled DNA was visualized using storage phosphor screens (Amersham Bioscience), scanned using a Personal Molecular Imager™ and quantified using Image Lab software (Bio-Rad).
Cell culture and lysate preparation
All medium, medium components and reagents were from Sigma Aldrich. Human HEK293T and HeLa cells (purchased from Leibniz Institute DSMZ-German Collection of Microorganisms and Cell Cultures, Braunschweig, Germany) were grown in DMEM supplemented with 10% fetal bovine serum, 2 mM L-glutamine and 1000 U mL−1 penicillin–streptomycin. To prepare cell lysate cells were trypsinized and resuspended in 50 μL (per million of cells) of pre-chilled HIM buffer (15 mM MgCl2, 10 mM tris-[3-(N-morpholino)propanesulfonic acid] pH 7.4, 10 mM KCl) supplemented with phosphatases and proteases inhibitors. After 10 minutes of incubation at 4 °C in 50 μL (per million of cells) of pre-chilled Mito buffer (400 mM sucrose, 10 mM N-tris(hydroxymethyl)methyl-2-aminoethanesulfonic acid, 100 μM ethylene glycol tetraacetic acid and 2 μM dithiothreitol pH 7.2 supplemented with phosphatases and proteases inhibitors) were added and the cells were homogenized by using a tissue grinder dounce 0.5 (#885300, Kimble Chase). An average of 50 strokes were made and cell breakage was checked at the microscope using trypan blue. Where reported the cell lysate was centrifuged 10 minutes at 900g and the supernatant collected in an ice-cold tube prior to insertion in the microchip inlet.Quantification of functional mitochondria
The collected sample from both outlets, as well as the sample introduced into the outlet were stained with 2.5 μM Mitotracker red (Molecular Probes Inc., Eugene, OR) at 25 °C for 5 min. The amount of mitochondria was determined by two different approaches. To verify whether there were nuclei in the retrieved sample, 5 μL of sample was mixed with 5 μL of ProLong (containing DAPI) and placed onto a slide glass, covered by a cover glass. To quantify the amount of mitochondria, total fluorescence was measured directly using a qPCR machine using the mode for the endpoint fluorescence (Agilent Mx3000P). The isolation percentage of functional mitochondria was defined as: fluorescenceoutlet2/(fluorescenceoutlet1 + fluorescenceoutlet2).Microscopy and image analysis
Slides were analyzed with Olympus IX73 epifluorescence microscope with an oil objective (Uplansapo 60×, NA = 1.35, Olympus). The fluorophores were excited by a mercury lamp. Fluorescent signals from Mitotracker red were selectively filtered through a dichroic (U-FGNA FL filter cube, DM570) and bandpass filters (excitation: BP 540–550, emission: BP 575–625) before being collected by an Andor Zyla sCMOS camera. Image acquisition was operated by the software of CellSense Dimension (Olympus). At least five images were recorded, for each sorting condition unless otherwise cited. ImageJ was then used to analyze and quantify the number of fluorescence spots (size: 0-infinity pixel,2 circularity: 0–1).Western blot analysis
Samples sorted from outlet 1 and outlet 2 were centrifuged 10 minutes at 10![[thin space (1/6-em)]](https://www.rsc.org/images/entities/char_2009.gif) 000g at 4 °C. The pellets obtained were lysed using a buffer containing 10 mM Tris–HCl (pH 7.5), 5 mM EDTA, 2 mM PMSF and 0.25 mg mL−1 β-glycerophosphate followed by incubation on ice for 10 minutes. As positive control a whole cell extract from 106 HEK293T cells was obtained using the same procedure. Protein concentration was determined by the Bradford protein assay (Sigma). Samples were then mixed with SDS loading buffer (2% SDS, 2 mM β-mercapto-ethanol, 4% (v/v) glycerol, 50 mM Tris–HCl pH 7, 0.05% bromophenol blue) and loaded on a 10% SDS gel. PageRuler prestained Protein ladder from Thermo Scientific was used as a size marker. The gel was run at 200 V for 30 minutes in 1× SDS running buffer (25 mM Tris–HCl, 192 mM glycine, 0.1% SDS). The separated proteins were blotted onto a 0.45 μm nitrocellulose membrane at 30 volts for 18 hours in transfer buffer (25 mM Tris–HCl, 192 mM glycine, 0.1% SDS, 20% ethanol) at 4 °C. The nitrocellulose membrane was incubated in blocking buffer (10 mM Tris pH 7.5, 500 mM NaCl, 0.25% Tween 20 and 5% skimmed milk powder). Subsequently the membrane was incubated over night at 4 °C with either Ku86 or Tom20 primary antibodies (Santa Cruz) diluted in blocking buffer. The membrane was washed 3 × 30 minutes in TBS buffer (20 mM Tris pH 7.5, 0.5 M NaCl, 0.25% Tween 20) at room temperature and probed with horseradish peroxidase-conjugated secondary antibodies (Dako) diluted in blocking buffer. The membrane was washed in TBS buffer at room temperature and bound antibodies were detected by autoradiography using the ECL Plus Western Blotting Detection Reagents (GE healthcare). Blots were exposed to hyperfilm (Kodak) for appropriate time periods in order to obtain a clear visualization of the blotted bands into the membrane.
000g at 4 °C. The pellets obtained were lysed using a buffer containing 10 mM Tris–HCl (pH 7.5), 5 mM EDTA, 2 mM PMSF and 0.25 mg mL−1 β-glycerophosphate followed by incubation on ice for 10 minutes. As positive control a whole cell extract from 106 HEK293T cells was obtained using the same procedure. Protein concentration was determined by the Bradford protein assay (Sigma). Samples were then mixed with SDS loading buffer (2% SDS, 2 mM β-mercapto-ethanol, 4% (v/v) glycerol, 50 mM Tris–HCl pH 7, 0.05% bromophenol blue) and loaded on a 10% SDS gel. PageRuler prestained Protein ladder from Thermo Scientific was used as a size marker. The gel was run at 200 V for 30 minutes in 1× SDS running buffer (25 mM Tris–HCl, 192 mM glycine, 0.1% SDS). The separated proteins were blotted onto a 0.45 μm nitrocellulose membrane at 30 volts for 18 hours in transfer buffer (25 mM Tris–HCl, 192 mM glycine, 0.1% SDS, 20% ethanol) at 4 °C. The nitrocellulose membrane was incubated in blocking buffer (10 mM Tris pH 7.5, 500 mM NaCl, 0.25% Tween 20 and 5% skimmed milk powder). Subsequently the membrane was incubated over night at 4 °C with either Ku86 or Tom20 primary antibodies (Santa Cruz) diluted in blocking buffer. The membrane was washed 3 × 30 minutes in TBS buffer (20 mM Tris pH 7.5, 0.5 M NaCl, 0.25% Tween 20) at room temperature and probed with horseradish peroxidase-conjugated secondary antibodies (Dako) diluted in blocking buffer. The membrane was washed in TBS buffer at room temperature and bound antibodies were detected by autoradiography using the ECL Plus Western Blotting Detection Reagents (GE healthcare). Blots were exposed to hyperfilm (Kodak) for appropriate time periods in order to obtain a clear visualization of the blotted bands into the membrane.
Acknowledgements
The authors would like to acknowledge the support from the Start-Up fund and Direct Research Grant provided by the Chinese University of Hong Kong, the Lundbeck Foundation (R95-A10275), Velux Foundation, The Danish Research Council, Karen Elise Jensen Foundation, the Dagmar Marshalls Fond, the Aase and Ejnar Danielsens Foundation and the Arvid Nilssons Fond. C. T. would like to acknowledge the support of Postdoc Fellowship from the Carlsberg foundation.References
- X. Liu, C. N. Kim, J. Yang, R. Jemmerson and X. Wang, Cell, 1996, 86, 147–157 CrossRef CAS PubMed.
- J. Yang, Science, 1997, 275, 1129–1132 CrossRef CAS PubMed.
- S. J. Riedl and G. S. Salvesen, Nat. Rev. Mol. Cell Biol., 2007, 8, 405–413 CrossRef CAS PubMed.
- W. X. Zong, J. D. Rabinowitz and E. White, Mol. Cell, 2016, 61, 667–676 CrossRef CAS PubMed.
- K. Ksiȩzakowska-Łakoma, M. Zyła and J. R. Wilczyński, Przegl. Menopauzalny, 2014, 18, 136–144 Search PubMed.
- E. Gottlieb and I. P. M. Tomlinson, Nat. Rev. Cancer, 2005, 5, 857–866 CrossRef CAS PubMed.
- M. Scheibye-Knudsen, D. L. Croteau and V. A. Bohr, Mech. Ageing Dev., 2013, 134, 275–283 CrossRef CAS PubMed.
- P.-M. Badin, et al., Sci. Rep., 2016, 6, 26442 CrossRef CAS PubMed.
- T. Brun and P. Maechler, Biochim. Biophys. Acta, Mol. Cell Res., 2016, 1863, 2540–2549 CrossRef CAS PubMed.
- M. Flint Beal, Mitochondrial Biol. New Perspect., 2008, pp. 183–192 Search PubMed.
- R. N. Lightowlers, R. W. Taylor and D. M. Turnbull, Science, 2015, 349, 1494–1499 CrossRef CAS PubMed.
- E. Fernández-Vizarra, G. Ferrín, A. Pérez-Martos, P. Fernández-Silva, M. Zeviani and J. A. Enríquez, Mitochondrion, 2010, 10, 253–262 CrossRef PubMed.
- C. Frezza, S. Cipolat and L. Scorrano, Nat. Protoc., 2007, 2, 287–295 CrossRef CAS PubMed.
- M. Toner and D. Irimia, Annu. Rev. Biomed. Eng., 2005, 7, 77–103 CrossRef CAS PubMed.
- D. Mark, S. Haeberle, G. Roth, F. von Stetten and R. Zengerle, Chem. Soc. Rev., 2010, 39, 1153–1182 RSC.
- J. Liu, Y. Lan, Z. Yu, C. S. Y. Tan, R. M. Parker, C. Abell and O. A. Scherman, Acc. Chem. Res., 2017, 50(2), 208–217 CrossRef CAS PubMed.
- T. Schneider, J. Kreutz and D. T. Chiu, Anal. Chem., 2013, 85, 3476–3482 CrossRef CAS PubMed.
- E. K. Sackmann, A. L. Fulton and D. J. Beebe, Nature, 2014, 507, 181–189 CrossRef CAS PubMed.
- H. Lu, S. Gaudet, M. a. Schmidt and K. F. Jensen, Anal. Chem., 2004, 76, 5705–5712 CrossRef CAS PubMed.
- P. Lundberg and I. Ericson, Biochem. Biophys. Res. Commun., 1975, 65, 530–536 CrossRef CAS PubMed.
- J. Sánchez-Prieto and M. J. López-Pérez, Biochim. Biophys. Acta, Biomembr., 1984, 778, 81–86 CrossRef.
- D. T. Plummer, Biochem. J., 1965, 96, 729–732 CrossRef CAS PubMed.
- I. Ericson, Biochim. Biophys. Acta, Biomembr., 1974, 356, 100–107 CrossRef CAS.
- G. G. Wolken, V. Kostal and E. A. Arriaga, Anal. Chem., 2011, 83, 612–618 CrossRef CAS PubMed.
- S. Kayo, J. Bahnemann, M. Klauser, R. Pörtner and A.-P. Zeng, Lab Chip, 2013, 13, 4467–4475 RSC.
- J. Zhang, S. Yan, D. Yuan, G. Alici, N.-T. Nguyen, M. Ebrahimi Warkiani and W. Li, Lab Chip, 2016, 16, 10–34 RSC.
- D. Di Carlo, Lab Chip, 2009, 9, 3038–3046 RSC.
- A. A. S. Bhagat, S. S. Kuntaegowdanahalli and I. Papautsky, Lab Chip, 2008, 8, 1906–1914 RSC.
- M. M. Bradford, Anal. Biochem., 1976, 72, 248–254 CrossRef CAS PubMed.
- W. R. Dean, London, Edinburgh, Dublin Philos. Mag. J. Sci., 1927, vol. 4, pp. 208–223 Search PubMed.
- M. D. Errico, E. Parlanti, E. Dogliotti, M. D'Errico and M. D'Errico, Mutat. Res., Rev. Mutat. Res., 2008, 659, 4–14 CrossRef PubMed.
- D. C. Chan, Annu. Rev. Genet., 2011, 46, 265–287 CrossRef PubMed.
- G. Filomeni, S. Piccirillo, I. Graziani, S. Cardaci, A. M. Da Costa Ferreira, G. Rotilio and M. R. Ciriolo, Carcinogenesis, 2009, 30, 1115–1124 CrossRef CAS PubMed.
- D. Qin, Y. Xia and G. M. Whitesides, Nat. Protoc., 2010, 5, 491–502 CrossRef CAS PubMed.
- R. Gredilla and T. Stevnsner, in DNA Repair Protocols, ed. L. Bjergbæk, Humana Press, Totowa, NJ, 2012, pp. 289–304 Search PubMed.
| This journal is © The Royal Society of Chemistry 2017 |

