
 Open Access Article
 This Open Access Article is licensed under a
 Creative Commons Attribution 3.0 Unported Licence
Oxidation modification of Ru-based catalyst for acetylene hydrochlorination†
Baochang Manab,
Haiyang Zhang *ab,
Jinli Zhang*ac,
Xing Liab,
Na Xuab,
Hui Daic,
Mingyuan Zhuab and
Bin Daiab
*ab,
Jinli Zhang*ac,
Xing Liab,
Na Xuab,
Hui Daic,
Mingyuan Zhuab and
Bin Daiab
aSchool of Chemistry and Chemical Engineering of Shihezi University, Shihezi, Xinjiang 832000, PR China. E-mail: zhy198722@163.com; zhangjinli@tju.edu.cn; Fax: +86-993-2057210; Tel: +86-993-2057-277
bKey Laboratory for Green Processing of Chemical Engineering of Xinjiang Bingtuan, Shihezi, Xinjiang 832000, PR China
cSchool of Chemical Engineering & Technology, Tianjin University, Tianjin 300072, PR China
First published on 3rd May 2017
Abstract
To prepare Ru-based catalysts with improved performance, activated carbon (AC) and Ru species were modified with nitric acid by different manners, and the resulting catalysts were characterized via a series of techniques. It was indicated that the oxidation of AC alone did not enhance the activity of the catalyst, but the modification enhanced the interaction between the oxygenated functional groups and Ru species, and the interaction could improve the catalytic performance of the catalysts. A Ru–O/AC–O catalyst prepared by the modification of active components, followed by the modification of AC exhibited outstanding activity and stability with an initial C2H2 conversion of 99.6% at 180 °C and a C2H2 space velocity of 180 h−1. The modification strengthened the adsorption of reactants, and also ensured the good dispersal of Ru species and augmented the amount of high-valence active species, consequently enhancing the catalytic activity.
1. Introduction
Vinyl chloride monomer (VCM) is commonly used to synthesize polyvinyl chloride, which is the second most widely used general resin. The hydrochlorination of acetylene is an essential process for manufacturing VCM in countries with rich coal resources. Activated carbon-supported HgCl2 is used as an industrial catalyst in this process; however, HgCl2 is highly toxic and sublimates easily, resulting in serious environmental and health risks.1–4 In addition, in the year 2013, more than 140 countries signed “Minamata Convention on Mercury” treaty, which aims to control the worldwide consumption of mercury.5 Therefore, the development of mercury-free catalysts for producing PVC has attracted considerable attention.6–9 The main metals investigated for mercury-free catalysts are Au,4,6,10 Pd,8,11 Ru,12–14 La,15 and Ba.16 It is widely accepted that among these catalysts, Au catalysts are superior in terms of initial activity. For example, Shen et al.9 reported that the Au1Cu5/C (w/w, total metal amount of 3 wt%) catalyst promotes 100% acetylene conversion and features a stability exceeding 200 h in on stream reactions under optimized conditions (temperature, 160 °C; VHCl/VC2H2, 1.15; total gas hourly space velocity (GHSV), 50 h−1). Zhang et al.6 synthesized ternary Au–Co(III)–Cu(II) catalysts and found that over the optimal catalyst Au1Co(III)3Cu(II)1/SAC, the acetylene conversion reached 99.7% and the selectivity to VCM was 99.9% within 48 h under the reaction conditions of 150 °C, VHCl/VC2H2 ratio of 1.15, and GHSV(C2H2) of 360 h−1. Wei et al.17 prepared Au–Bi/AC catalysts and found that the synergistic effect between Bi and Au stabilized the Au+ by inhibiting the reduction to metallic Au, and over the Au–Bi/AC (0.3 wt% Au, 0.95 wt% Bi) catalyst, the acetylene conversion reached 85% within 10 h under the reaction conditions of 180 °C, VHCl/VC2H2 ratio of 1.10, and GHSV(C2H2) of 600 h−1. G. J. Hutchings reported that the catalytic activity for the hydrochlorination of acetylene to vinyl chloride correlated significantly with the standard reduction potential of the metal cation for supported metal chloride catalysts.2 The standard potential of Ru4+ (E(Ru4+)) is 1.12 V, which is higher than that of Hg2+ (E(Hg2+)) at 0.851 V,2 while the standard potential of Ru3+ is 0.455 V,18,19 which is lower than that of Hg2+. Moreover, the price of Ru is much lower than that of Au; therefore, Ru may also be an alternative candidate catalyst for acetylene hydrochlorination.Ru-based catalysts commonly feature AC as a carrier owing to its large specific surface area and rich pore structure. In addition, AC can be modified by different treatment processes.20–22 The surface chemistry of the support material is an extremely important factor that affects both the preparation of the catalyst and its performance.23–25 Xu et al. reported that AC was consecutively treated by nitration, amination, and pyridine modification, and that the Ru/AC–NHN catalyst showed best catalytic activity with a C2H2 conversion of 93.0% and selectivity to VCM of 99.9%.26 Li et al. synthesized a metal-free catalyst SiC@N–C via growing a N–C layer out of preshaped SiC granules. The catalyst exhibited good heat conductivity, mechanical strength, and chemical stability and showed stable catalytic performance during 150 h with a C2H2 conversion of 80% and a selectivity to VCM of 98% at 200 °C.27 Zhao et al. modified AC with melamine, and the N-doped AC enhanced the activity of Ru/AC–N catalysts under the reaction temperature of 250 °C and a total liquid hourly space velocity of 1,2-dichloroethane (EDC) of 0.2 h−1 in the reaction of EDC and C2H2.28 Li et al.29 reported that Ru catalysts deposited inside CNTs' channels exhibited optimal catalytic activity, with an acetylene conversion of 95.0% and selectivity to VCM of 99.9% after 10 h on stream under the conditions of 170 °C and GHSV (C2H2) of 90 h−1. Modification of the properties of the active species is also an effective method to regulate the catalytic performance of catalysts. Jin et al.30 reported that acetylene conversion reached the highest rate of 93.4% under the conditions of 170 °C, GHSV(C2H2) of 180 h−1, and a feed volume ratio V(HCl)/V(C2H2) of 1.1 over Ru–K/SAC catalysts. Pu et al.31 reported that a Ru/SAC-C300 catalyst promoted a stable acetylene conversion at 96.5% in 48 h at 170 °C and a GHSV(C2H2) of 180 h−1. Previously, we reported that the addition of Co species to a Ru-based catalyst increased the amount of active species and promoted the catalytic performance of the catalyst Ru1Co3/SAC (spherically activated carbon) with an acetylene conversion of 95% during a 48 h test at 170 °C, a C2H2 gas hourly space velocity (GHSV) of 180 h−1, and a VHCl/VC2H2 of 1.1.13 Thereafter, we reported that the addition of Cu(II) and Co(III) augmented the amount of RuO2 active species, and the 0.1 wt% Ru1Co(III)3Cu(II)1/SAC catalyst exhibited optimal activity, with a C2H2 conversion of 99.0%.32 However, the catalytic performance of Ru-based catalysts is still not as good as that of Au-based catalysts under the same reaction conditions.
Nevertheless, the previous preparation processes of the Ru-based catalysts are tedious. In addition, concerning the economics and the problem that the amount of RuOx (x ≥ 2) active species needs to be further improved to enhance the catalytic activity of the Ru-based catalysts, we prepared oxidized Ru catalysts by different modification methods in this study, and we also investigated in detail the effect of the modification method used on the catalytic performance. The results indicate that the economical Ru–O/AC–O catalyst could give favorable performance and that the catalyst may be promising for future applications.
2. Experimental
2.1. Materials
AC (coconut carbon, 40–60 mesh, neutral) was purchased from Tangshan United Carbon Technology Co., Ltd. RuCl3 (48.7% Ru) was purchased from Tianjin Fengchuan Chemical Reagent Co., Ltd. All the other chemicals and materials were commercially available and were used without further purification.2.2. Catalyst preparation
AC was stirred in HCl (36 wt%) solution at 70 °C for 5 h and then filtered and washed to neutral pH value with deionized water, followed by desiccation at 140 °C for 18 h. The obtained sample was labeled as AC and used as the initial material for the further modification. Pretreated AC was stirred in 20 mL nitric acid (0.94 mol L−1) solution at ambient temperature for 5 h and then filtered and washed to neutral pH with deionized water, followed by desiccation at 140 °C for 18 h. The resultant sample was denoted as AC–O.All the Ru-based catalysts were prepared using an incipient wetness impregnation method.4,10,13 RuCl3 (0.064 g) was dissolved in deionized water and added dropwise to AC–O (3.0 g) with agitated stirring, then the mixture was dipped for 24 h at room temperature, filtered, and washed to neutral pH with deionized water, followed by evaporation at 140 °C for 24 h. The sample was termed Ru/AC–O. The Ru/AC catalyst was prepared by impregnating the AC carrier (3.0 g) with a RuCl3 (0.064 g) aqueous solution under stirring; then the mixture was dipped for 24 h at ambient temperature, filtered, then the product was washed to neutral pH with deionized water. The obtained mixture was desiccated at 140 °C for 24 h to obtain the Ru/AC catalyst. For the synthesis of (Ru/AC)–O, the Ru/AC catalyst (3.0 g) was added to nitric acid (20 mL, 0.94 mol L−1) solution and refluxed at 80 °C for 24 h. The solution was then filtered and the product was washed to neutral pH with deionized water, followed by evaporation at 140 °C for 24 h, and the catalyst was named as (Ru/AC)–O. For the synthesis of Ru–O/AC–O, nitric acid (20 mL, 0.94 mol L−1) solution was added to the RuCl3 aqueous solution with stirring at 80 °C for 24 h, then AC–O (3.0 g) was added to the solution with stirring for another 24 h. The mixture was filtered and the product was washed to neutral pH with deionized water, followed by evaporation at 140 °C for 24 h to prepare Ru–O/AC–O. The brief preparation procedures are shown in Fig. S1.† The amount of Ru loading in all the Ru-based catalysts was fixed at 1.0 wt%.
2.3. Catalyst characterization
Fourier transform infrared (FT-IR) spectroscopy was obtained using a Bruker Vertex70 FT-IR spectrophotometer with the resolution of 4 cm−1 and the scanning times of 64 to identify the correlated bond vibrations of the Ru-based catalysts.Low-temperature N2 adsorption–desorption experiments were conducted with a Micromeritics ASAP 2020C instrument. The samples were first degassed at 150 °C for 6 h and then analyzed at −196 °C via liquid nitrogen adsorption.
Thermogravimetric analysis (TGA) of the catalysts was conducted with a TG-DSC simultaneous thermal analyzer (NETZSCH STA 449F3, Germany) under an air atmosphere at a flow rate of 30 mL min−1, and with the temperature increasing from ambient temperature to 800 °C at a heating rate of 10 °C min−1.
Temperature-programmed reduction (TPR) and temperature-programmed desorption (TPD) experiments were conducted with a Quantachrome AMI-90 instrument. For the TPR profiles, the samples (0.1 g) were first treated with N2 gas for 1 h at 80 °C. After cooling, the temperature was then increased from 25 °C to 850 °C at a heating rate of 10 °C min−1 under a 10% H2/Ar (45 mL min−1) atmosphere. For the C2H2-/HCl-TPD experiments, the samples (0.1 g) were first pretreated under a C2H2 or HCl atmosphere for 6 h at the reaction temperature. Then, high-purity N2 (45 mL min−1) was passed through the sample for 20 min at 100 °C. After cooling, the temperature was increased from 25 °C to 500 °C to record the profiles. As for the CO-TPD experiments, the sample (0.1 g) was first reduced under a 10% H2/Ar (30 mL min−1) atmosphere at 300 °C for 2 h. After cooling, 250 μL pulses of 10% CO/He were passed through the sample, then the CO uptake profile was recorded and the dispersion of Ru in the Ru-based catalysts was calculated.
X-ray photoelectron spectroscopy (XPS) analysis was performed with an Axis Ultra spectrometer equipped with a monochromatized AlKα X-ray source (225 W). The spectral regions of Ru3p3 and C1s for the catalysts were recorded, and the C1s peak (284.6 eV) was adopted for the calibration of the spectra.
Transmission electron microscopy (TEM) images were taken using a JEM2010 electron microscope working at 200 kV. First, the powders of the samples were dispersed in ethanol solution and then were supported on carbon-film-coated copper grids to obtain the images.
X-ray diffraction (XRD) data were collected using a Bruker D8 (Germany) advanced X-ray diffractometer with CuKα irradiation (λ = 1.5406 Å) at 40 mA and 40 kV in the wide angles of 10–90°.
2.4. Catalytic performance tests
The catalytic performance tests were performed in a fixed-bed reactor (i.d. 10 mm), which was purged with nitrogen prior to the catalytic reaction to remove air and water from the reaction system. Hydrogen chloride (20 mL min−1) was introduced into the reactor to activate the catalyst before the reaction was started, and the temperature of the reactor was heated to 180 °C. Then, C2H2 (5.9 mL min−1) and HCl (9.0 mL min−1) were then fed through the filter with a GHSV(C2H2) of 180 h−1 (2 mL catalyst) at a temperature of 180 °C. Under certain conditions, the flow rate of acetylene and the size of catalyst were changed to investigate the effect of mass transfer on the catalytic activity, and the results indicated that the effect of the external diffusion was eliminated at the C2H2 flow rate range of 5–40 mL min−1; the reaction rate was not limited by the internal mass transport within the 0.180–1.180 mm (16–80 mesh) grain size range. The gas phase products were first passed through an absorption bottle containing sodium hydroxide solution, and then the reaction products were analyzed by gas chromatography (GC-2014C).3. Results and discussion
3.1. Catalytic performance of the Ru-based catalysts
To determine the optimal oxidation modification procedure for the AC-supported Ru-based catalysts, four different modified catalysts, Ru/AC, Ru/AC–O, (Ru/AC)–O, and Ru–O/AC–O, were assessed for acetylene hydrochlorination. Fig. 1 shows the catalytic performance of the catalysts.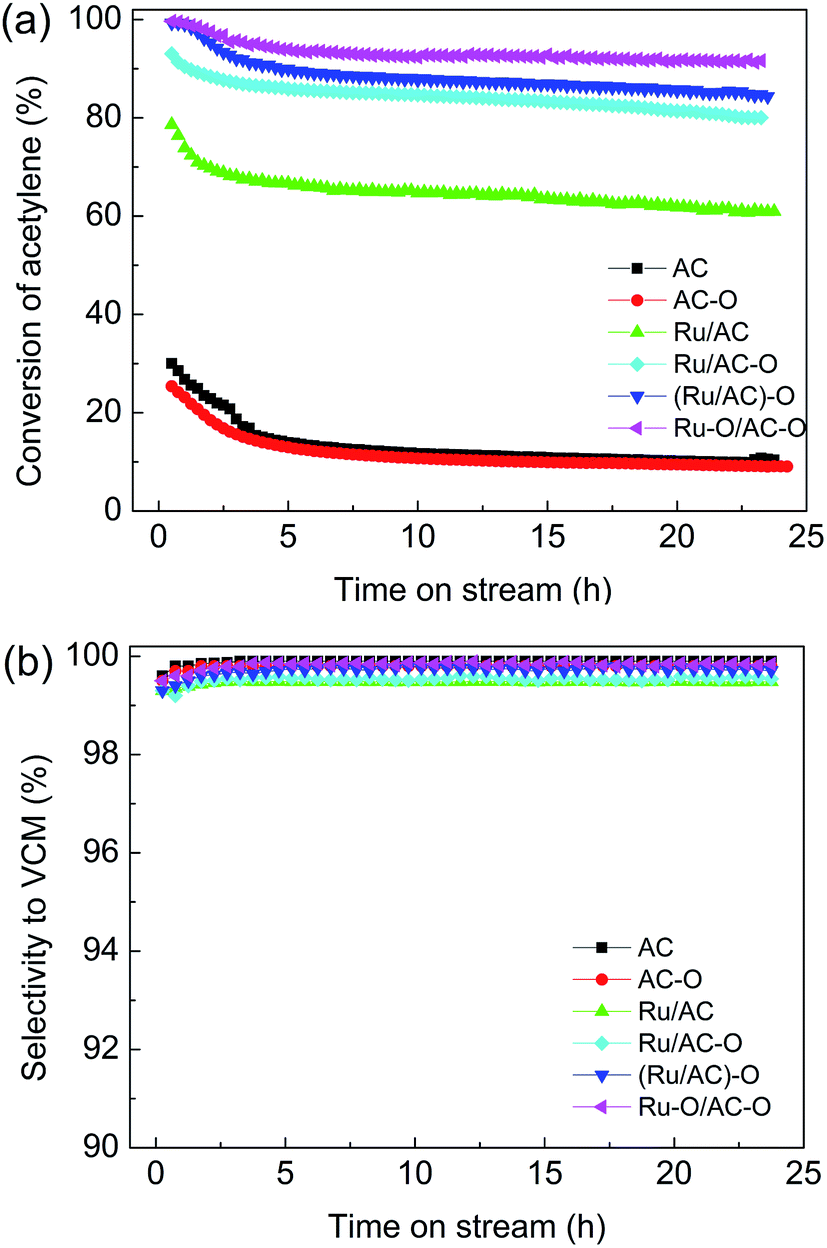 | ||
Fig. 1 Effect of oxidation modification on the catalytic performance of Ru-based catalysts. Reaction conditions: temperature = 180 °C, GHSV(C2H2) = 180 h−1, and VHCl/VC2H2 = 1.15![[thin space (1/6-em)]](https://www.rsc.org/images/entities/char_2009.gif) :1. :1. | ||
The Ru-free supports (AC, AC–O) showed relatively low activity, with acetylene conversions of 12.0% and 11.0%, respectively. Ru/AC exhibited an initial acetylene conversion of ca. 62.0%. Compared with the original Ru/AC catalyst, the catalytic activities of the oxidized catalysts were improved in the order of Ru–O/AC–O > (Ru/AC)–O > Ru/AC–O > Ru/AC (Fig. 1a), with the highest acetylene conversion of 93.0% being achieved over the Ru–O/AC–O catalyst and with no obvious decrease in activity after 24 h of reaction. This indicated that the oxidation modification of activated carbon alone does not improve the activity of the catalyst, and that possibly the interaction between oxygenated functional groups and Ru species can enhance the catalytic activity of the Ru-based catalysts. All the related catalysts exhibited selectivity to VCM of over 99.0% during the 24 h reaction (Fig. 1b). Moreover, compared with the other noble metal (Au, Pd) catalysts, Ru-based catalysts enjoy a cost advantage; they also have higher activity and a lower deactivation rate than those of the nonmetallic catalysts (Table S1†). Thus, the results indicate that the economical Ru–O/AC–O catalyst could give favorable performance and that the catalyst may be promising for future applications.
3.2. FT-IR spectra of the Ru-based catalysts
FT-IR spectra were obtained to study the surface functional groups of the catalysts. The spectra of the AC, AC–O, and fresh and used Ru-based catalysts are shown in Fig. 2. For the fresh AC, six characteristic peaks appear at 806, 1091, 1384, 1562, 2350, and 3400 cm−1, related to the C–H bending vibration band on the benzene ring, C–OH absorption band, C![[double bond, length as m-dash]](https://www.rsc.org/images/entities/char_e001.gif) O absorption band, COOH antisymmetric stretching vibration band, C
O absorption band, COOH antisymmetric stretching vibration band, C![[triple bond, length as m-dash]](https://www.rsc.org/images/entities/char_e002.gif) N stretching vibration band, and phenolic hydroxyl stretching vibration band, respectively.33–35 Compared with the AC catalyst, the intensity of the C–H bending vibration band on the benzene ring is reduced and that of the C–OH absorption band and CN stretching vibration band are increased in the AC–O catalyst, indicating that the functional groups on the AC surface were successfully modified to a certain degree by nitric acid treatment. This can increase the hydrophilicity of the AC surface so as to improve the dispersion of the active component on its surface. For the fresh Ru-based catalysts, the CN stretching vibration band has disappeared and the intensities of the oxygenated functional groups are also decreased to a different degree. It is worth mentioning that there are marked red-shifts of some oxygenated functional groups, especially for the C–OH absorption bands. This may be caused by the interaction between the oxygenated functional groups on the AC surface and the Ru species. For the used catalysts after experiencing a 24 h reaction, the CN stretching vibration band has disappeared for the AC–O catalyst, while the intensities of the functional groups on the surface are decreased (take Ru/AC for example, Fig. S2†). This may be caused by the decomposition of the oxygenated functional groups on the surface or the coke deposition during the reaction.
N stretching vibration band, and phenolic hydroxyl stretching vibration band, respectively.33–35 Compared with the AC catalyst, the intensity of the C–H bending vibration band on the benzene ring is reduced and that of the C–OH absorption band and CN stretching vibration band are increased in the AC–O catalyst, indicating that the functional groups on the AC surface were successfully modified to a certain degree by nitric acid treatment. This can increase the hydrophilicity of the AC surface so as to improve the dispersion of the active component on its surface. For the fresh Ru-based catalysts, the CN stretching vibration band has disappeared and the intensities of the oxygenated functional groups are also decreased to a different degree. It is worth mentioning that there are marked red-shifts of some oxygenated functional groups, especially for the C–OH absorption bands. This may be caused by the interaction between the oxygenated functional groups on the AC surface and the Ru species. For the used catalysts after experiencing a 24 h reaction, the CN stretching vibration band has disappeared for the AC–O catalyst, while the intensities of the functional groups on the surface are decreased (take Ru/AC for example, Fig. S2†). This may be caused by the decomposition of the oxygenated functional groups on the surface or the coke deposition during the reaction.
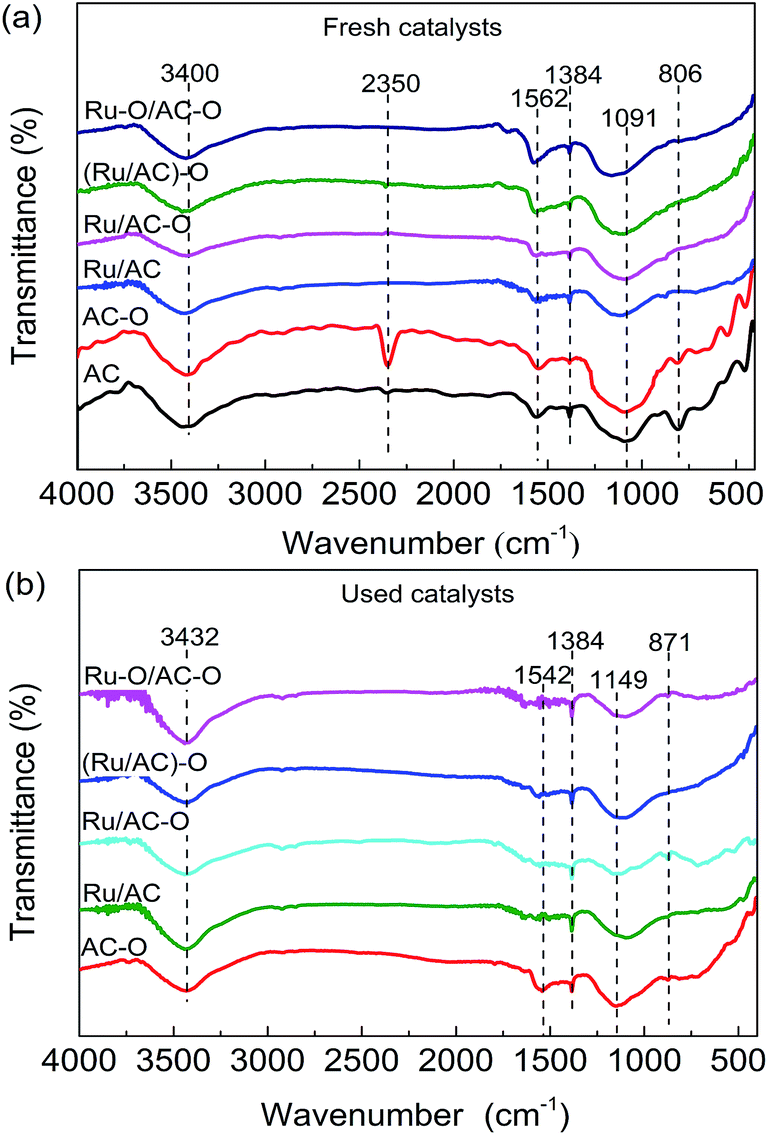 | ||
| Fig. 2 FT-IR spectra of the (a) fresh catalysts and (b) used catalysts. The characteristic peaks are centered at: 806 cm−1: C–H; 1091 cm−1: C–OH; 1384 cm−1: CO; 1562 cm−1: COOH; 2350 cm−1: CN; and 3400 cm−1: phenolic hydroxyl. | ||
3.3. Texture properties of the catalysts
Low-temperature N2 adsorption/desorption experiments were conducted to measure the pore structure parameters of the catalysts. AC and AC–O presented type-I isotherms due to the adsorption in the micro-pores.31 The fresh and used Ru-based catalysts exhibited similar adsorption isotherms (Fig. S3†).Table 1 lists the pore structure parameters of the Ru-based catalysts. Ru/AC and Ru/AC–O exhibit BET surface areas and total pore volumes lower than that of AC and AC–O. This was due to the loading of active metallic components, mentioned as the dilution effect previously.36 The BET surface area and pore volume of fresh AC–O are lower than those of bare AC, the fresh Ru/AC–O, (Ru/AC)–O, and Ru–O/AC–O catalysts show lower BET surface areas and pore volumes than those of Ru/AC, probably due to the functional groups being successfully grafted onto the surface of carrier and the pores becoming occupied after the modification. Compared with the fresh Ru-based catalysts, the used catalysts exhibit lower BET surface areas and total pore volumes (Table 1). For the used AC–O catalyst after a 24 h reaction, the BET surface area is decreased from 1082 m2 g−1 to 1031 m2 g−1, a reduction of 4.7%. The surface area of the used Ru/AC catalyst is decreased from 978 m2 g−1 to 768 m2 g−1, for a reducing fraction of 21.4%. Similarly, the surface areas of the used Ru/AC–O, (Ru/AC)–O, and Ru–O/AC–O catalysts show reducing fractions of 16.3%, 15.8%, and 8.1%, respectively. The change in the pore volume of the catalysts also exhibits a similar order: Ru/AC (28.8%) > Ru/AC–O (20.8%) > (Ru/AC)–O (18.0%) > Ru–O/AC–O (13.2%) > AC–O (1.9%). Compared with AC–O, the obvious decrease in BET surface areas and the total pore volumes of the Ru-based catalysts may due to the metal-catalyzed reaction.37 The loss of surface areas and pore volumes may also be due to the collapse of the pores and the deposition of coke on the surface of the catalysts. According to the catalytic activity shown in Fig. 1, the initial conversion of acetylene is 78.6% over Ru/AC, 93.0% over Ru/AC–O, 99.3% over (Ru/AC)–O, and 99.6% over Ru–O/AC–O, which are then decreased respectively to 60.9%, 80.0%, 84.3%, and 91.6% after 24 h reaction. Therefore, it can be reasonably considered that the decrease in the BET surface areas and total pore volumes may be due to the collapse of the pores and the deposition of coke on the surface for the used catalysts during the reaction, resulting in the observed decreases in the catalytic activity.37
| Catalyst | Surface area (m2 g−1) | Total pore volume (cm3 g−1) | ||
|---|---|---|---|---|
| Fresh | Used | Fresh | Used | |
| AC | 1146 | — | 0.57 | — |
| AC–O | 1082 | 1031 | 0.54 | 0.53 |
| Ru/AC | 978 | 768 | 0.52 | 0.37 |
| Ru/AC–O | 936 | 783 | 0.48 | 0.38 |
| (Ru/AC)–O | 942 | 793 | 0.50 | 0.41 |
| Ru–O/AC–O | 963 | 885 | 0.53 | 0.46 |
3.4. Coke deposition on the catalyst surface
The TGA curves of the Ru-based catalysts were recorded to analyze the coke deposition on the used catalysts. As shown in Fig. 3, there is a slight weight loss in the range of ambient temperature to 150 °C for the fresh and used Ru–O/AC–O catalyst, which is attributed to the desorption of adsorbed water on the surface of the catalysts. In the temperature range of 150–385 °C, both the fresh and used catalysts exhibit a slow weight loss, where the amount in the used catalyst is higher than that in the fresh catalyst, which could mainly be due to the burning of coke deposition after experiencing the 24 h reaction. When the temperature is greater than 385 °C, the catalysts show a rapid weight loss, which is mainly attributed to the burning of AC itself. Therefore, the amount of coke deposition could be calculated by the difference in weight loss of the fresh and used Ru–O/AC–O catalyst in the temperature range of 150–385 °C.38–40 Based on Fig. 3, the amount of coke deposition during the reaction was calculated as 3.6%.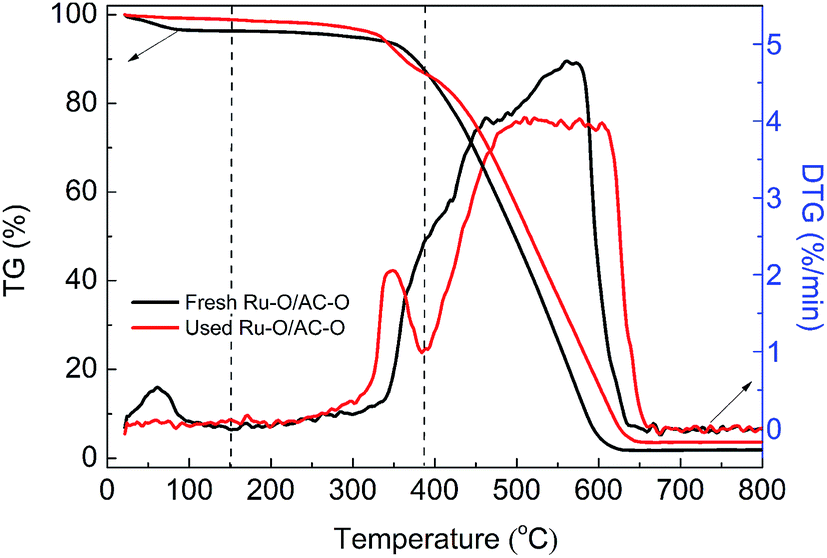 | ||
| Fig. 3 TG curves of the fresh and used Ru–O/AC–O catalysts recorded under an air atmosphere. | ||
According to similar procedures, the extent of coke deposition on the other used catalysts was calculated (Fig. S4† and Table 2) and the amount of coke deposition on all the used catalysts increases in the order: AC–O (2.1%) < Ru–O/AC–O (3.7%) < (Ru/AC)–O (5.1%) < Ru/AC–O (5.6%) < Ru/AC (7.5%), which is consistent with the results of the low-temperature N2 adsorption–desorption experiments. Thus, it is reasonable to conclude that coke deposition during the reaction is one of the reasons for the catalysts deactivation and also that the oxidation modification is beneficial for the inhibition of coke deposition during the reaction.
| Samples | Amount of coke deposition (%) |
|---|---|
| AC–O | 2.1 |
| Ru/AC | 7.5 |
| Ru/AC–O | 5.6 |
| (Ru/AC)–O | 5.1 |
| Ru–O/AC–O | 3.7 |
3.5. Reducibility of the fresh Ru-based catalysts
Fig. 4 shows the TPR profiles of the fresh catalysts. There appears broad peaks for all the catalysts in the range of 500–700 °C, which is attributed to the methanation of the functional groups on the carrier.41,42 There are also several H2 consumption peaks in the range of 100–400 °C for the Ru-based catalysts because of the existence of oxidation state ruthenium species. For the TPR profile of the Ru/AC catalyst, there are three reduction peaks centered at 150.3 °C, 250.7 °C, and 323.7 °C, which correspond to the characteristic reduction peaks of RuOx (x > 2), RuO2, and RuCl3, respectively.32 However, the oxidation modification slightly increases the reduction temperatures for RuOx and RuO2 and decreases the reduction temperatures for the RuCl3 species. For the Ru/AC–O catalyst, the reduction temperatures for RuOx and RuO2 increase to 156.3 °C and 257.2 °C, respectively, and the reduction temperatures for RuCl3 decreases to 312.8 °C. For the (Ru/AC)–O catalyst, the reduction temperatures for RuOx and RuO2 increase to 175.3 °C and 260.3 °C, respectively, and the reduction temperature for RuCl3 decreases to 305.6 °C. The Ru–O/AC–O catalyst exhibits a similar curve to that of (Ru/AC)–O, with the peak temperatures for RuOx and RuO2 shifted to higher values (183.4 °C and 266.9 °C for RuOx and RuO2, respectively). These shifts indicate interactions between the active Ru species and carrier, which is consistent with the FT-IR results. Furthermore, the amount of Ru oxides (RuOx and RuO2) decreases in the order: Ru–O/AC–O > (Ru/AC)–O > Ru/AC–O > Ru/AC (Fig. 4), which is consistent with the activity results of the Ru-based catalysts. This indicates that the oxidation modification leads to a larger amount of Ru oxides, thereby improving the catalytic performance of the catalysts.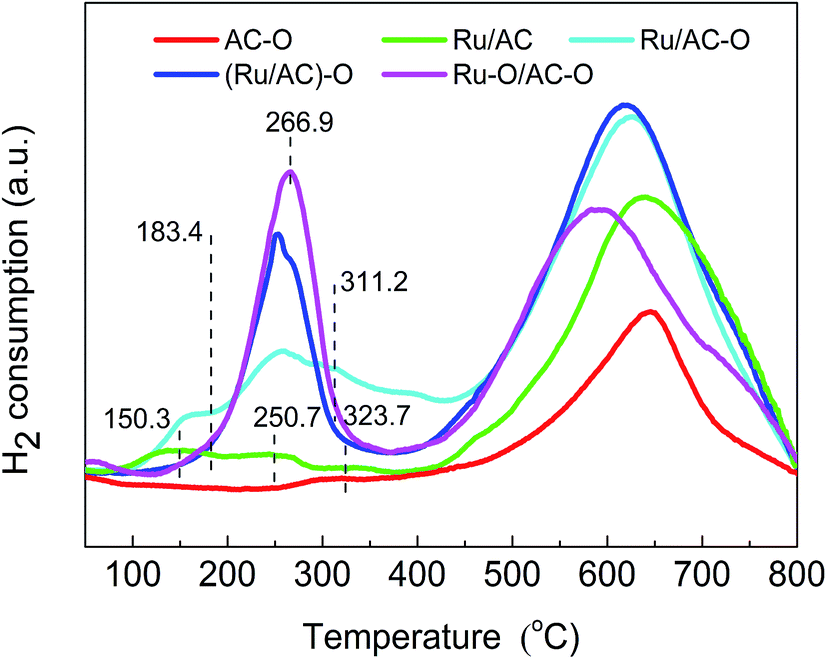 | ||
| Fig. 4 H2-TPR profiles of the fresh Ru-based catalysts. | ||
To further study the effects of oxidation modification on the active Ru species for acetylene hydrochlorination, Ru 3p3/2 XPS spectra of all the Ru-based catalysts were obtained (Fig. S5 and Table S2†), and the binding energies and relative quantities are shown in Table 3. For all the Ru-based catalysts, the Ru 3p3/2 XPS spectra could be deconvoluted into three to five peaks at ca. 460.8, 461.9, 463.5, 465.2, and 466.4 eV, which correspond to Ru0, Ru/RuOy, RuCl3, RuO2, and RuOx, respectively.32,43,44 As shown in Table 3, Ru/AC consists of 25.2% Ru0, 35.7% RuCl3, 24.4% RuO2, and 14.7% RuOx. The modified Ru/AC–O catalyst contains 26.4% Ru0, 33.9% RuCl3, 26.4% RuO2, and 13.3% RuOx. The dominant species in (Ru/AC)–O is 34.3% RuCl3, followed by 26.1% RuO2, 22.8% RuOx, and 16.8% Ru/RuOy. Ru–O/AC–O contains 36.5% RuO2, followed by 24.7% RuOx, 25.1% RuCl3, and 13.7% Ru/RuOy. The amount of Ru oxides (RuO2 and RuOx) decreases in the order: Ru–O/AC–O (61.2%) > (Ru/AC)–O (48.9%) > Ru/AC–O (39.7%) > Ru/AC (39.1%). According to the previous literature, Ru oxides are the dominant active species in Ru-based catalysts.31,32 The oxidation modification results in a higher quantity of high-valence Ru oxides in the fresh catalysts, which is consistent with the TPR results. Moreover, binding energy shifts for the ruthenium species were observed upon oxidation modification, confirming the interactions between the Ru species and the carrier. For the used catalysts, the Ru oxides (RuO2 and RuOx) content of Ru/AC decreases to 20.5% with a 47.6% loss of active species, whereas there are 34.3%, 31.1%, and 2.3% losses of active species for the oxidized Ru/AC–O, (Ru/AC)–O, and Ru–O/AC–O catalysts, respectively. It has been reported that the reduction of Ru oxides to low-valence Ru species results in the deactivation of Ru-based catalysts;32 therefore, it can be concluded that the oxidation modification of the catalysts inhibits the reduction of ruthenium oxides to low-valence Ru species in the processes of catalyst preparation and reaction. Fig. S6† shows the C1s XPS spectra of fresh AC, AC–O, Ru/AC, Ru/AC–O, (Ru/AC)–O, and Ru–O/AC–O. Major peaks appear at ca. 288.9, 287.1, 285.9, and 284.6 eV, corresponding to carboxylic groups, carbonyl groups, hydroxyl groups, and carbon groups, respectively.21 The relevant C1s peak areas and binding energies are shown in Table 4. Compared with AC and AC–O, the hydroxyl, carbonyl, and carboxyl groups of AC–O are increased to a certain extent, and the increase in the hydroxyl group is the largest. For the fresh Ru-based catalysts, Ru–O/AC–O has the highest content of oxygenated functional groups. The increase in oxygenated functional groups may play a role in the immobilization of Ru active species.
| Catalysts | Binding energy (eV), (area%) | Area% | ||||
|---|---|---|---|---|---|---|
| RuOx | RuO2 | RuCl3 | Ru/RuOy | Ru0 | RuOx + RuO2 | |
| Fresh Ru/AC | 466.9 (14.7) | 465.2 (24.4) | 463.5 (35.7) | — | 460.9 (25.2) | (39.1) |
| Used Ru/AC | — | 465.0 (20.5) | 463.7 (32.4) | — | 460.8 (47.1) | (20.5) |
| Fresh Ru/AC–O | 467.1 (13.3) | 465.3 (26.4) | 463.5 (33.9) | — | 460.7 (26.4) | (39.7) |
| Used Ru/AC–O | — | 464.9 (26.1) | 463.4 (37.8) | 462.0 (36.1) | — | (26.1) |
| Fresh (Ru/AC)–O | 466.9 (22.8) | 465.0 (26.1) | 463.5 (34.3) | 461.9 (16.8) | — | (48.9) |
| Used (Ru/AC)–O | — | 465.2 (33.7) | 463.7 (36.6) | 461.8 (29.7) | — | (33.7) |
| Fresh Ru–O/AC–O | 467.4 (24.7) | 465.1 (36.5) | 463.4 (25.1) | 461.8 (13.7) | — | (61.2) |
| Used Ru–O/AC–O | 467.2 (30.2) | 465.4 (29.6) | 463.8 (24.3) | 461.8 (15.9) | — | (59.8) |
| Catalysts | Binding energy (eV), (area%) | |||
|---|---|---|---|---|
| COOH | CO |
C–OH | C–C | |
| Fresh AC | 288.7 (8.30) | 287.1 (6.70) | 285.8 (19.4) | 284.6 (65.6) |
| Fresh AC–O | 288.9 (8.80) | 287.1 (8.50) | 285.9 (23.3) | 284.6 (59.4) |
| Fresh Ru/AC | 288.9 (8.00) | 287.5 (7.30) | 286.2 (15.3) | 284.6 (69.4) |
| Fresh Ru/AC–O | 288.9 (7.90) | 287.4 (10.4) | 286.2 (16.1) | 284.6 (65.6) |
| Fresh (Ru/AC)–O | 289.3 (6.20) | 287.1 (13.9) | 286.1 (17.4) | 284.6 (62.5) |
| Fresh Ru–O/AC–O | 288.9 (11.0) | 286.8 (13.9) | 285.8 (15.6) | 284.6 (59.5) |
3.6. Adsorption of reactants on the Ru-based catalysts
TPD experiments were conducted to investigate the adsorption of hydrogen chloride and acetylene by the fresh catalysts. The HCl- and C2H2-TPD profiles of the different catalysts are shown in Fig. 5. The desorption peaks for HCl are shown as broad bands in the temperature range of 100–500 °C for the catalysts (Fig. 5a), suggesting the presence of multi-status adsorbed HCl.16 The desorption area for HCl gradually increases in the order: AC–O < Ru/AC < Ru/AC–O < (Ru/AC)–O < Ru–O/AC–O. The desorption temperature for HCl also increases in the same order, indicating that the oxidation modification enhances the adsorption of the reactant HCl. The Ru–O/AC–O catalyst exhibits the best adsorption capacity and strength for HCl. The desorption peaks for acetylene are centered at ca. 150 °C for all the catalysts (Fig. 5b), and the desorption area of acetylene also decreases in the order: Ru–O/AC–O > (Ru/AC)–O > Ru/AC–O > Ru/AC > AC–O. Thus, it is reasonable to assume that oxidation modification of the AC support and the active component greatly enhances the adsorption ability of the catalyst for both HCl and acetylene.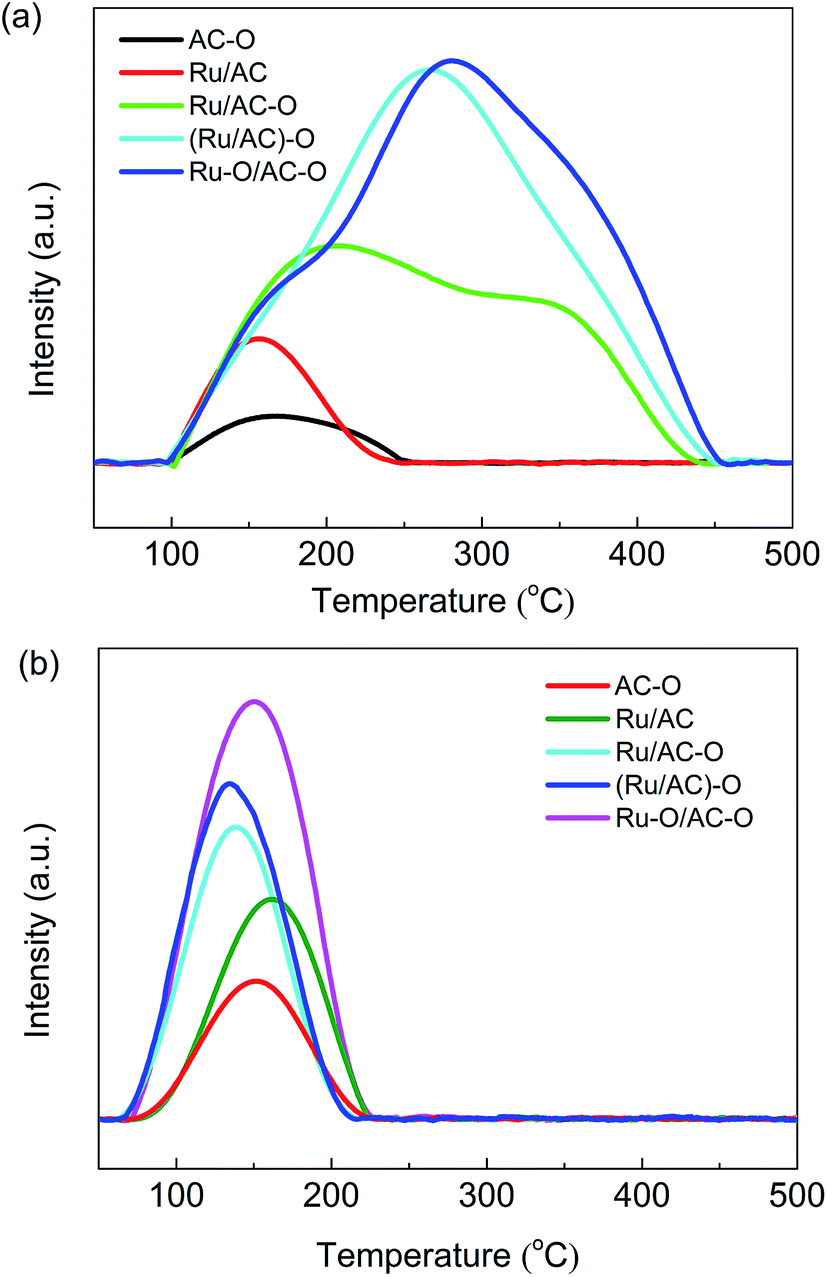 | ||
| Fig. 5 HCl- (a) and C2H2- (b) TPD profiles of the catalysts. | ||
3.7. Dispersion of Ru particles
Fig. 6 shows the XRD patterns of the fresh and used Ru-based catalysts. The amorphous diffraction peaks for carbon are clearly apparent; however, no discernible Ru reflections are detected for the fresh and used catalysts, indicating the high dispersion (<4 nm) and/or the amorphous state of the active species, which is consistent with the TEM images (Fig. S7† and Table 5). | ||
| Fig. 6 XRD patterns of the fresh (a) and used (b) catalysts. | ||
| Catalysts | Ru loadinga (wt%) | CO uptake (μmol CO per g) | Ru dispersion (%) | Average size of Ru particlesb (nm) | Average size of Ru particlesc (nm) |
|---|---|---|---|---|---|
| a Note: the actual Ru loading determined by ICP.b Average size of Ru particles determined via TEM.c Average size of Ru particles calculated by 101/Ru dispersion. | |||||
| Ru/AC | 0.913 | 17.5 | 19.4 | 3.91 | 5.21 |
| Ru/AC–O | 0.906 | 24.8 | 27.7 | 3.66 | 3.65 |
| (Ru/AC)–O | 0.910 | 27.2 | 30.2 | 3.31 | 3.34 |
| Ru–O/AC–O | 0.915 | 31.0 | 34.3 | 2.97 | 2.94 |
Further, CO-TPD experiments were carried out to estimate the dispersion of Ru species. As shown in Table 5, the Ru dispersion is 25.4% for Ru/AC, and then increases after the oxidation modification of the catalysts. The highest dispersion of 34.3% is achieved in the Ru–O/AC–O catalyst, followed by (Ru/AC)–O (30.2%) and Ru/AC–O (27.7%). In combination with the XRD patterns and TEM images, these data indicate that in all likelihood the oxidation modification increases the hydrophilicity of the AC surface, thus improving the dispersion of the active Ru species on its surface, which is consistent with the FT-IR results.
3.8. Recycling Ru-based catalysts
Ru–O/AC–O was chosen as the catalyst to assess the reusability of the Ru-based catalysts. The used Ru–O/AC–O catalyst (0.96 g) was taken into a beaker, then 6.4 mL nitric acid (0.94 mol L−1) solution was added; the mixture was stirred at ambient temperature for 5 h, then filtered and washed to neutral pH with deionized water, followed by desiccation at 140 °C for 18 h. The obtained catalyst was reused to catalyze the acetylene hydrochlorination reaction for 24 h. Fig. 7 shows the activity of the recycled catalysts. It can be seen from Fig. 7 that a stable acetylene conversion of 93.5% could be achieved over the fresh catalyst in the first run. After recycling 5 times, the conversion of acetylene was still able to return to 83.3%. As mentioned, the deactivation of the catalyst was mainly due to coke deposition and the reduction of the active component during the reaction. Coke deposition may be partially removed and the reduced Ru species may be oxidized to a high state of active species to some extent by treatment with nitric acid in the regeneration of Ru–O/AC–O, thereby improving the catalytic performance of the used catalyst.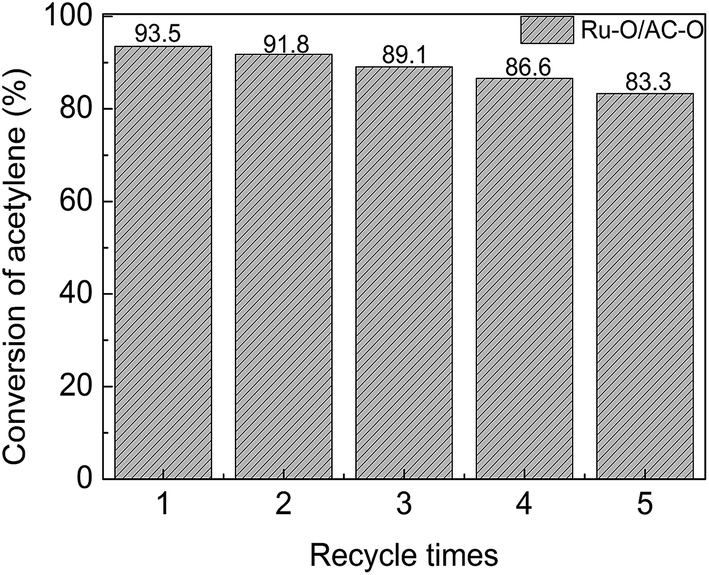 | ||
| Fig. 7 Catalytic performance of the recycled Ru–O/AC–O catalysts. Reaction conditions: temperature = 180 °C, GHSV(C2H2) = 180 h−1, and VHCl/VC2H2 = 1.15:1. | ||
4. Conclusions
Several Ru-based catalysts were prepared by different oxidation modification procedures and assessed for acetylene hydrochlorination. Modification of the active species and the carrier by HNO3 was shown to be beneficial for acetylene hydrochlorination, whereby the optimal catalytic performance was achieved over the Ru–O/AC–O catalyst with an initial C2H2 conversion of 99.6% and selectivity to VCM of above 99% at 180 °C with a GHSV(C2H2) of 180 h−1. Through characterization by FT-IR, TGA, TPR, XPS, TPD, XRD, and TEM, it was shown that the appropriate oxidation modification could lead to well-dispersed Ru species and less coke deposition on the surface of catalysts, thereby greatly enhancing the amount of HCl and C2H2 reactants adsorbed on the Ru-based catalysts. The enhanced interactions between the active Ru species and the carrier can stabilize the high-valence state of Ru and inhibit the reduction of high-valence Ru oxides to low-valence species in the processes of the catalyst preparation and during the reaction, consequently enhancing the catalytic activity of the Ru-based catalysts.Acknowledgements
This work was supported by the Start-Up Foundation for Young Scientists of Shihezi University (RCZX201507), the Program for Changjiang Scholars and Innovative Research Team in University (No. IRT_15R46), and NSFC (U1403294, 21366027).References
- K. Zhou, J. Jia, X. Li, X. Pang, C. Li, J. Zhou, G. Luo and F. Wei, Fuel Process. Technol., 2013, 108, 12–18 CrossRef CAS.
- G. J. Hutchings, J. Catal., 1985, 96, 292–295 CrossRef CAS.
- J. Zhang, N. Liu, W. Li and B. Dai, Front. Chem. Sci. Eng., 2011, 5, 514–520 CrossRef CAS.
- M. Conte, C. J. Davies, D. J. Morgan, T. E. Davies, D. J. Elias, A. F. Carley, P. Johnston and G. J. Hutchings, J. Catal., 2013, 297, 128–136 CrossRef CAS.
- K. G. Homme, J. K. Kern, B. E. Haley, D. A. Geier, P. G. King, L. K. Sykes and M. R. Geier, BioMetals, 2014, 27, 19 CrossRef CAS PubMed.
- H. Zhang, B. Dai, W. Li, X. Wang, J. Zhang, M. Zhu and J. Gu, J. Catal., 2014, 316, 141–148 CrossRef CAS.
- X. Wei, H. Shi, W. Qian, G. Luo, Y. Jin and F. Wei, Ind. Eng. Chem. Res., 2009, 48, 128–133 CrossRef CAS.
- T. V. Krasnyakova, I. V. Zhikharev, R. S. Mitchenko, V. I. Burkhovetski, A. M. Korduban, T. V. Kryshchuk and S. A. Mitchenko, J. Catal., 2012, 288, 33–43 CrossRef CAS.
- S. Wang, B. Shen and Q. Song, Catal. Lett., 2010, 134, 102–109 CrossRef CAS.
- M. Conte, A. F. Carley, G. Attard, A. A. Herzing, C. J. Kiely and G. J. Hutchings, J. Catal., 2008, 257, 190–198 CrossRef CAS.
- S. A. Mitchenko, T. V. Krasnyakova and I. V. Zhikharev, Theor. Exp. Chem., 2010, 46, 32–38 CrossRef CAS.
- M. F. Luo, C. C. Wang, G. R. Hu, W. R. Lin, C. Y. Ho, Y. C. Lin and Y. J. Hsu, J. Phys. Chem. C, 2009, 113, 21054–21062 CAS.
- J. Zhang, W. Sheng, C. Guo and W. Li, RSC Adv., 2013, 3, 21062 RSC.
- M. Zhu, L. Kang, Y. Su, S. Zhang and B. Dai, J. Chem., 2013, 91, 120–125 CAS.
- H. Zhang, B. Dai, X. Wang, L. Xu and M. Zhu, J. Ind. Eng. Chem., 2012, 18, 49–54 CrossRef CAS.
- H. Zhang, W. Li, X. Li, W. Zhao, J. Gu, X. Qi, Y. Dong, B. Dai and J. Zhang, Catal. Sci. Technol., 2015, 5, 1870–1877 CAS.
- K. Zhou, J. Jia, C. Li, H. Xu, J. Zhou, G. Luo and F. Wei, Green Chem., 2014, 17, 356–364 RSC.
- M. Zhu, Q. Wang, K. Chen, Y. Wang, C. Huang, H. Dai, F. Yu, L. Kang and B. Dai, ACS Catal., 2015, 5, 5306–5316 CrossRef CAS.
- B. Nkosi, N. J. Coville and G. J. Hutchings, Appl. Catal., 1988, 43, 33–39 CrossRef CAS.
- J. Zhao, J. Xu, J. Xu, T. Zhang, X. Di, N. I. Jun and X. Li, Chem. Eng. J., 2015, 262, 1152–1160 CrossRef CAS.
- C. Moreno-Castilla, M. V. López-Ramón and F. Carrasco-MaríN, Carbon, 2000, 38, 1995–2001 CrossRef CAS.
- J. L. Figueiredo, M. F. R. Pereira, M. M. A. Freitas and J. J. M. Órfão, Carbon, 1999, 37, 1379–1389 CrossRef CAS.
- C. Prado-Burguete, A. Linares-Solano, F. Rodríguez-Reinoso and S. M. D. Lecea, J. Catal., 1989, 115, 98–106 CrossRef CAS.
- F. J. Derbyshire, V. H. J. D. Beer, G. M. K. Abotsi, A. W. Scaroni, J. M. Solar and D. J. Skrovanek, Appl. Catal., 1986, 27, 117–131 CrossRef CAS.
- A. Sepúlveda-Escribano, F. Coloma and F. RodríGuez-Reinoso, Appl. Catal., A, 1998, 173, 247–257 CrossRef.
- N. Xu, M. Zhu, J. Zhang, H. Zhang and B. Dai, RSC Adv., 2015, 5, 86172–86178 RSC.
- X. Li, X. Pan, L. Yu, P. Ren, X. Wu, L. Sun, F. Jiao and X. Bao, Nat. Commun., 2014, 5, 3688 CAS.
- W. Zhao, W. Li and J. Zhang, Catal. Sci. Technol., 2015, 6, 1402–1409 Search PubMed.
- G. Li, W. Li, H. Zhang, Y. Pu, M. Sun and J. Zhang, RSC Adv., 2014, 5, 9002–9008 RSC.
- Y. Jin, G. Li, J. Zhang, Y. Pu and W. Li, RSC Adv., 2015, 5, 37774–37779 RSC.
- Y. Pu, J. Zhang, L. Yu, Y. Jin, W. Li, Y. Pu, J. Zhang, L. Yu, Y. Jin and W. Li, Appl. Catal., A, 2014, 488, 28–36 CrossRef CAS.
- H. Zhang, W. Li, Y. Jin, W. Sheng, M. Hu, X. Wang and J. Zhang, Appl. Catal., B, 2016, 189, 56–64 CrossRef CAS.
- S. Biniak, G. Szymański, J. Siedlewski and A. Ś. j. m. Tkowski, Carbon, 1997, 35, 1799–1810 CrossRef CAS.
- N. Brown and H. X. You, Surf. Sci., 1990, 237, 273–279 CrossRef CAS.
- A. Dandekar, R. T. K. Baker and M. A. Vannice, Carbon, 1998, 36, 1821–1831 CrossRef CAS.
- H. Zhang, B. Dai, X. Wang, W. Li, Y. Han, J. Gu and J. Zhang, Green Chem., 2013, 15, 829–836 RSC.
- B. Nkosi, N. J. Coville, G. J. Hutchings, M. D. Adams, J. Friedl and F. E. Wagner, J. Catal., 1991, 128, 366–377 CrossRef CAS.
- F. G. Liu, M. Du, J. Zhang and M. Qiu, Corros. Sci., 2009, 51, 102–109 CrossRef CAS.
- K. Dumbuya, G. Cabailh, R. Lazzari, J. Jupille, L. Ringel, M. Pistor, O. Lytken, H. P. Steinrück and J. M. Gottfried, Catal. Today, 2012, 181, 20–25 CrossRef CAS.
- J. K. Brennan, T. J. Bandosz, K. T. Thomson and K. E. Gubbins, Colloids Surf., A, 2001, 187, 539–568 CrossRef.
- P. D. Zgolicz, J. P. Stassi, M. J. Yañez, O. A. Scelza and S. R. D. Miguel, J. Catal., 2012, 290, 37–54 CrossRef CAS.
- F. Coloma, A. Sepúlveda-Escribano, J. L. G. Fierro and F. Rodríguez-Reinoso, Appl. Catal., A, 1997, 150, 165–183 CrossRef CAS.
- J. L. G. D. L. Fuente, M. V. Martínez-Huerta, S. Rojas, P. Hernández-Fernández, P. Terreros, J. L. G. Fierro and M. A. Peña, Appl. Catal., B, 2009, 88, 505–514 CrossRef.
- J. H. Ma, Y. Y. Feng, J. Yu, D. Zhao, A. J. Wang and B. Q. Xu, J. Catal., 2010, 275, 34–44 CrossRef CAS.
Footnote |
| † Electronic supplementary information (ESI) available. See DOI: 10.1039/c7ra01121k |
| This journal is © The Royal Society of Chemistry 2017 |