DOI:
10.1039/C7RA01853C
(Paper)
RSC Adv., 2017,
7, 23727-23734
A Ruthenium(II) complex as a potential luminescent switch-on probe for G-quadruplex DNA†
Received
14th February 2017
, Accepted 19th April 2017
First published on 3rd May 2017
Abstract
This study aimed to synthesize two ruthenium(II) complexes modified with aryl alkynes [Ru(phen)2(TMSEPIP)](ClO4)2 (1, phen = 1,10-phenanthrolin; TMSEPIP = 2-(2-trimethylsilylethylphenyl)imidazole[4,5f][1,10] phenanthroline) and [Ru(phen)2(BEPIP)](ClO4)2 (2, BEPIP = 2-(2-phenethylphenyl)imidazole[4,5f][1,10]phenanthroline) and evaluate their ability to act as luminescent probes of c-myc G-quadruplex DNA. It was discovered that the luminescence of 1 decreased in the presence of c-myc G-quadruplex DNA, while the luminescence of 2 clearly increased under the same conditions. Besides, in the presence of double-stranded DNA, the luminescence intensity of 1 and 2 showed little obvious change. It was interesting to find by atomic force microscopy that 1 could promote c-myc G-quadruplex DNA self-assembly to form a nano-network structure, while 2 could promote the formation of a nanowire structure. Further studies showed that 1 was inserted into the groove formed by base pairs A6-G8 and G21-T23 of c-myc G-quadruplex DNA, while 2 was inserted into the groove formed by G7-G9 and G22-A24. It is speculated that 2 can be developed as a potential luminescent switch-on probe through selectively recognizing and promoting self-assembly of c-myc G-quadruplex DNA.
1 Introduction
In recent years, much attention has been focused on the self-assembly of the G-quadruplex, a special conformation formed by a G-rich sequence through Hoogsteen hydrogen bonding, for its potential utility as a gene carrier and in targeted drug delivery systems and nanodevices.1 It has been reported that G-rich oligonucleotides such as d(GCGGAGGCG) can self-assemble to form nanowires, and tetramolecular G-quadruplexes can also assemble to form nanowires when guided by parallel-stranded duplexes.2,3 In general, DNA self-assembly can be successfully implemented using DNA tiles, DNA origami, and dynamic self-assembly.4 In addition, in recent years, the in-depth understanding of noncovalent interactions of small molecules with biological macromolecules encouraged spontaneous DNA assembly into remarkably diverse architectures using synthetic small molecules.5,6 For example, Co(II) complexes have been used to induce rapid DNA condensation into globular nanoparticles through intermolecular π–π stacking interactions.7 Moreover, polypyridyl Ru(II) complexes ([Ru(phen)2(bqbg)]2+) and ([Ru{(bpy)2Ru(H2bpib)}3]Cl8) have also facilitated induction of double-strand DNA condensation into nanoparticles/nanowires.8 It has been revealed that condensed nanoparticles of DNA formed using this method can be taken up by cells and used as a one- and two-photon luminescent tracking nonviral gene vector.9
Nevertheless, the self-assembly of G-quadruplex DNA promoted by inorganic materials, especially Ru(II) complexes, still remains uncovered. Accumulated evidence shows that Ru(II) complexes exhibit excellent binding affinity to G-quadruplex DNA. Chao reported that octahedral polypyridyl Ru(II) complexes could recognize and bind to telemetric G-quadruplex DNA.10 It has also been revealed that arene Ru(II) complexes can bind and stabilize c-myc G-quadruplex in a groove binding mode.11 Further studies also showed that nanosized chiral supramolecular complexes preferentially bind to higher-order G-quadruplexes over single G-quadruplex units with ∼200-fold different selectivity, and that dimeric G-quadruplex units can be novel binding sites for large ligands targeting higher-order G-quadruplexes.12 Recently, it has been reported that specific Ru(II) dppz compounds can distinguish G-quadruplex from duplex DNA. The photophysical process controlling the DNA-sensing properties has been explored; multiple models have been proposed to explain this “light-switch” behavior. So, needs to be clarified whether the Ru(II) complexes can act as a luminescent “switch-on” probe through the high selectivity of G-quadruplex DNA.
This study reported the preparation of two ruthenium(II) complexes modified by aryl alkyne group using Sonogashira C–C coupling reaction under microwave irradiation (see ESI Fig. S1†), and their interactions with c-myc G-quadruplex DNA have also been studied. The results showed that both complexes exhibited stronger affinity to G-quadruplex DNA than to double-strand DNA. However, they exhibited different binding sites with c-myc G-quadruplex DNA in groove binding mode to promote different self-assembled nanostructures. Moreover, the fluorescence emission of 2 enhanced with the addition of c-myc G-quadruplex DNA (Scheme 1). Then, a simple, selective, G-quadruplex-based label-free luminescent switch-on assay was investigated.
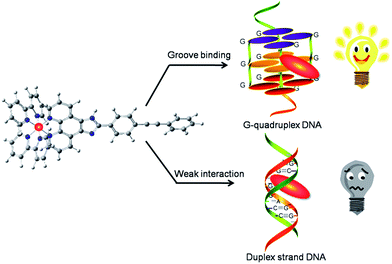 |
| | Scheme 1 A ruthenium(II) complex with phenylethynyl exhibited stronger affinity with G-quadruplex DNA than ds-DNA, which can act as a potential luminescent “switch on” probe for selective recognition of G-quadruplex DNA. | |
2 Experimental section
2.1 Materials and methods
All the chemicals including solvents were obtained from commercial vendors and used as received. Ruthenium(III) chloride hydrate was purchased from Mitsuwa Chemicals. c-myc G-quadruplex DNA (5′-TGGGGAGGGTGGGGAGGG TGGGGAAGG-3′) and the fluorescent labeled oligonucleotide, c-myc G-quadruplex DNA (5′-FAM-TGGGGAGGGTGGGGAGGGTGGGGAAGG-TAMRA-3′, FAM: carboxyfluorescein, TAMRA: 6-carboxytetramethylrhodamine) and formed a G-quadruplex conformation by renaturation at 4 °C for 24 h after 90 °C denaturation for 5 min, according to the literature.13,14 And c-myc, 5′-FAM-c-myc-TAMRA-3′, ds26/ss DNA and CT-DNA were purchased from Sangon Biotech (shanghai) Co., Ltd. All aqueous solutions were prepared with doubly distilled water. The Tris–HCl buffer consisting of Tris (10 mM) and KCl/NaCl (100 mM), adjust pH value to 7.2 by HCl (0.1 mol), which was applied to UV titrations, fluorescence emission titrations, AFM observation and analytical ultracentrifugation assay. MDA-MB-231 cells were purchased from ATCC, which were cultured by DMEM (HyClone) with 10% fetal bovine serum (HyClone).
Microwave assisted synthesis was carried out on Anton Paar Monowave 300 microwave reactor. The electronic spectra were recorded on a Shimadzu UV-2550 Spectrophotometer and steady-state emission spectra were recorded on a RF-5301 Fluorescence Spectrophotometer. The 1H NMR, 1H–1H COSY and 13C NMR spectra were recorded in DMSO-d6 solution on a Bruker DRX 2500 spectrometer, and ESI-MS spectra were obtained in methanol on Agilent 1100 ESI-MS system operating at room temperature. The nanostructures were characterized by atomic force microscopy (AFM) (Bruker, Dimension FastScanTM).
2.2 Synthesis and characterization
2.2.1 Synthesis of [Ru(phen)2(p-TMSEPIP)](ClO4)2 (1). 1 was synthesized following the literature but with some modifications. In general, [Ru(phen)2(p-BrPIP)](ClO4)2 (130 mg, 0.125 mmol) and trimethylsilylacetylene (0.09 mL, 0.625 mmol) was dissolved in dry CH3CN (15.0 mL), and then Pd(PPh3)2Cl2, CuI and dry Et3N were added into the reaction system under N2 atmosphere. The reaction mixture was irradiated by microwaves for 30 min at 140 °C. After filtrated and dried in vacuums, a dark red powder was obtained. The crude was purified by flash silica gel column chromatography (CH3CN), yields: 30%. ESI-MS (in CH3CN, m/z): 427.4 ([M–2ClO4]2+), 853.3 ([M–2ClO4–H]+). 1H NMR (400 MHz, DMSO-d6) δ 9.03 (d, J = 8.1, 2H, Hc), 8.79 (t, 2H, H4′), 8.77 (t, 2H, H4), 8.40 (s, 4H, H5,6), 8.37 (d, J = 8.4, 2H, He), 8.11 (m, 4H, H2′, H2), 7.91 (d, J = 4.7 Hz, 2H, Ha), 7.78 (ddd, J = 8.2, 5.3, 1.8 Hz, 4H, H3′, H3), 7.73 (dd, J = 8.3, 5.3 Hz, 2H, Hb), 7.67 (d, J = 8.3 Hz, 2H, Hd), 1.76 (s, 9H, Si(CH3)3). 13C NMR (101 MHz, DMSO-d6) δ 171.91 (s), 153.10 (s), 147.73 (d, J = 9.6 Hz), 137.16 (s), 132.67 (s), 130.90 (d, J = 2.8 Hz), 128.50 (s), 126.88 (d, J = 20.1 Hz), 40.66 (s), 40.45 (s), 40.24 (s), 40.04 (s), 39.83 (s), 39.62 (s), 39.41 (s), 22.97 (s).
2.2.2 Synthesis of [Ru(phen)2(p-BEPIP)](ClO4)2 (2). 2 was synthesized as the same methods as above, but with phenylacetylene (0.07 mL, 0.625 mmol), yields: 51%. ESI-MS (in CH3CN, m/z): 429.5 ([M–2ClO4]2+), 857.3 ([M–2ClO4–H]+). 1H NMR (400 MHz, DMSO-d6) δ 9.04 (d, J = 8.1 Hz, 2H, Hc), 8.79 (t, 2H, H4′), 8.77 (t, 2H, H4), 8.44 (d, J = 8.4, 2H, He), 8.40 (s, 4H, H5,6), 8.12 (ddd, J = 10.2, 5.3, 1.2 Hz, 4H, H2′, H2), 7.88 (d, J = 4.5 Hz, 2H, Ha), 7.78 (ddd, J = 8.5, 5.3, 3.5 Hz, 4H, H3′, H3), 7.75–7.68, (m, 4H, Hb, Hd), 7.61–7.57 (m, 2H, Hg), 7.46 (d, J = 2.1 Hz, 1H, Hh), 7.45 (d, J = 1.9 Hz, 2H, Hf). 13C NMR (101 MHz, DMSO-d6) δ 153.08 (s), 147.76 (d, J = 10.0 Hz), 137.12 (s), 132.24 (s), 131.84 (s), 130.88 (s), 129.29 (s), 128.53 (s), 127.04 (s), 126.78 (s), 125.91 (s), 40.59 (d, J = 15.5 Hz), 40.37 (d, J = 17.9 Hz), 40.16 (d, J = 18.2 Hz), 40.04 (s), 39.75 (d, J = 16.5 Hz), 39.53 (d, J = 18.3 Hz), 39.41 (s), 22.97 (s).
2.3 Fluorescence properties assay
The fluorescence quantum yields Φ (relative values) of samples were calculated according to the following expression:15
where the subscripts unk and std respectively refer to the sample and the reference, Φunk and Φstd are the fluorescence quantum yields of the sample and standard, respectively. Iunk and Istd are the integrated emission intensities of the sample and standard, respectively. Aunk and Astd are the absorbances of the sample and standard at the best excitation wavelengths of sample, respectively, and ηunk and ηstd are the indexes of refraction of the sample and standard solutions. The fluorescence quantum yields of two complexes were measured at best excitation wavelengths using Ru(bpy)32+ in CH3CN as the radiative quantum yield standard. Fluorescence spectroscopy measurements were performed using a 1 cm path length quartz cell. Luminescence titrations of Ru(II) complexes were measured by using fixed ruthenium concentration (4 μM) with increasing c-myc G4 DNA or CT-DNA. The first spectrum was taken after 5 min to allow the sample (3 mL) to equilibrate. Then, 2 μL of a 100 μM DNA solution was added to the sample cell with thorough mixing. The titration processes were repeated until there was no apparent.
2.4 Atom force microscopy observation
The mixed solution of DNA (100 μM) and Ru(II) complexes (100 μM) were incubated for three days. Then, the mixed solution of 10 uL was removed to a mica plate and naturally volatilized for 2 h. An image of the sample was captured by atomic force microscopy (AFM).
2.5 Analytical ultracentrifugation assay
Analytical ultracentrifugation was operated by ProteomeLab XL-A/XL-I (Beckman Coulter). Sedimentation velocity experiments were carried out in a Beckman XL-I analytical ultracentrifuge. Samples were prepared with a final concentration of 100 μM c-myc G-quadruplex DNA, c-myc G-quadruplex DNA (100 μM) bound 1 and 2 (100 μM) in buffer (Tris–HCl buffer pH 7.2, 10 mM Tris and 100 mM KCl). c-myc G-quadruplex DNA and 1 or 2 were mixed 1![[thin space (1/6-em)]](https://www.rsc.org/images/entities/char_2009.gif) :1 with a final volume of 400 μL. Samples were loaded into a two-channel ultracentrifuge cell, and a blank buffer consisting of the system storage buffers, Tris–HCl buffer was loaded into the blank channel. For interference experiments, sapphire windows were used, and for absorbance experiments, quartz windows were used. Cells were loaded in an An-60Ti rotor and centrifuged at 50000 rpm at 20 °C. Data were analyzed using SEDFIT using a continuous c(s) with bimodal f/f0.16 Fits were considered satisfactory if the root mean square deviation was less than 0.009 and the residuals were randomly distributed.
:1 with a final volume of 400 μL. Samples were loaded into a two-channel ultracentrifuge cell, and a blank buffer consisting of the system storage buffers, Tris–HCl buffer was loaded into the blank channel. For interference experiments, sapphire windows were used, and for absorbance experiments, quartz windows were used. Cells were loaded in an An-60Ti rotor and centrifuged at 50000 rpm at 20 °C. Data were analyzed using SEDFIT using a continuous c(s) with bimodal f/f0.16 Fits were considered satisfactory if the root mean square deviation was less than 0.009 and the residuals were randomly distributed.
2.6 Molecular docking
Automated docking studies were performed with three different docking algorithms, which were: (1) AutoDock 3.0 (‘Lamarckian’ genetic algorithm); (2) FlexX 1.10 (incremental construction algorithm, as implemented in Sybyl 6.8), and (3) GOLD 1.2 (i.e., the “Darwinian” genetic algorithm). As scoring is a very important second aspect of automated docking methodologies, it was decided to investigate the effect of rescoring – this is a process of reprioritization of the docking solutions (i.e., primarily ranked by the “native” scoring function implemented in the docking program) with an additional stand-alone scoring function.
2.7 Spectroscopy analysis
The recording of electronic absorption spectra was carried out at room temperature to determine the binding affinity between c-myc G4-DNA/CT-DNA and ruthenium(II) complexes([c-myc G4-DNA] = 100 μM [CT-DNA] = 6 mM). 3.0 mL solutions of the blank buffer and the ruthenium complex samples (10 μM) were placed in the reference and sample cuvettes respectively, following which, the first spectrum was recorded in the wavelength range of 200–800 nm. During the titration, an aliquot (2 μL) of buffered DNA solution was added to each cuvette to eliminate the absorbance of c-myc DNA/CT-DNA itself, and the solutions were mixed by repeated inversions. After the solutions were mixed for approximately five minutes, the absorption spectra were recorded. The titration process was repeated until there was no change in the spectra for at least four titrations, which indicated that binding saturation had been achieved.
2.8 Melting and competitive FRET assays
The fluorescent labeled oligonucleotide, c-myc G-quadruplex DNA (5′-FAM-TGGGGAGGGTGGGGAGGG TGGGGAAGGTAMRA-3′, FAM: carboxyfluorescein, TAMRA: 6-carboxy tetramethylrhodamine) used as the FRET probe was diluted in Tris–HCl buffer and then annealed by being heated to 90 °C for 5 min, followed by slowly cooling to room temperature.17 Ds26 duplex DNA (CAATCGGATCGAATTCGATCCGATTG) and single-stranded (ss) DNA f(5′-CTCAT4C2ATACAT2A3GATAGTCAT-3′) were competitive binders to evaluate the selective binding ability of Ru(II) complexes with c-myc G4 DNA. Fluorescence melting curves were determined with a Bio-RadiQ5 realtime PCR detection system, by using a total reaction volume of 25 mL, with labeled oligonucleotide (1 μM) and different concentrations of complexes in Tris–HCl buffer.18 A constant temperature was maintained for 30 s prior to each reading to ensure a stable value. Final analysis of the data was carried out by using Origin7.5 (Origin Lab Corp.).
2.9 Western blot analysis
Total cellular proteins were extracted by incubating cells in lysis buffer obtained from Cell Signaling Technology and protein concentrations were determined by BCA assay. SDS-PAGE was done in 10% tricine gels loading equal amount of proteins per lane. After electrophoresis, separated proteins were transferred to nitrocellulose membrane and blocked with 5% non-fat milk in TBST buffer for 1 h. After then, the membranes were incubated with primary antibodies at 1:1000 dilutions in 5% non-fat milk overnight at 4 °C, and then secondary antibodies conjugated with horseradish peroxidase at 1:2000 dilution for 1 h at room temperature. Protein bands were visualized on X-ray film using an enhanced chemiluminescence system (Kodak).
3 Results and discussion
3.1 The chemical properties of ruthenium(II) complexes
Excitation of 1 (4 μM) at about 462 nm in Tris–HCl–KCl buffer resulted in an emission with λmax at 583 nm, while the excitation of 2 (4 μM) at about 467 nm led to the emission with λmax at 571 nm. The Stokes shift was determined from the excitation and emission spectral peak energies, the noticeable differences between the excitation and emission wavelengths was calculated to be almost 121 nm of 1 and 104 nm of 2,19 (Fig. 1) which might contributed to the presence of trimethylsilylacetylene exhibited better electron-donating conjugation effect than phenylethynyl.20,21 The quantum yields of 1 and 2 in CH3CN were 0.028 and 0.016, respectively. Interestingly, it was found that, with the addition of c-myc G-quadruplex DNA, the fluorescence intensity of 1 decreased gradually, about 35.6%, which may be attributed to the binding of 1 to c-myc G-quadruplex DNA (Fig. 2A). However, for 2, the fluorescence intensity increased dramatically, about 81.6%, which may be attributed to switch-on assay (Fig. 2B).22 Moreover, strong red fluorescence of 1 (4 μM) in Tris–HCl–KCl buffer solution was observed. When excited at 365 nm of ultraviolet (UV) light, with the addition of c-myc DNA, the fluorescence emission decreased (Fig. 2E); but for 2, the fluorescence emission increased (Fig. 2F). However, with the addition of CT-DNA, the fluorescence intensity of 1 and 2 were both decreased slightly (Fig. 2C and D), and the fluorescence emission of 1 and 2 have little obvious change (Fig. 2G and H), which indicated that both ruthenium(II) complexes exhibited weak interactions with duplex strand DNA. Above results suggested that the binding of 2 to c-myc G-quadruplex DNA might act as a switch-on luminescent probe to recognize c-myc G-quadruplex DNA.23–25
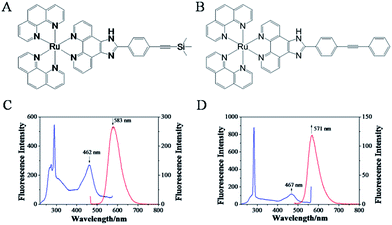 |
| | Fig. 1 The synthetic ruthenium(II) complexes with phenylethynyl 1 (A) and 2 (B). The fluorescence properties of 1 (C) and 2 (D). [Ru] = 4 μM, excitation spectra (blue) and emission spectra (red). | |
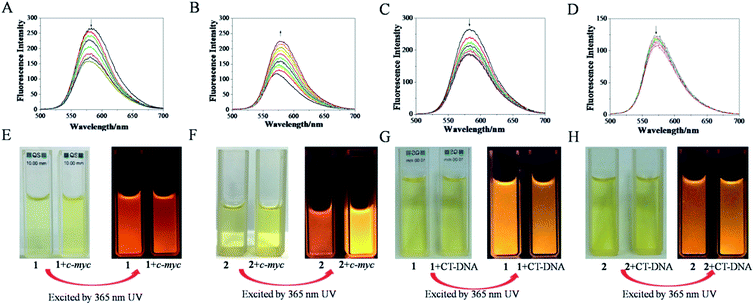 |
| | Fig. 2 The changes of fluorescence intension of 1 (A) and 2 (B) with the addition of c-myc G-quadruplex DNA, 1 (C) and 2 (D) with the addition of CT-DNA. ([Ru] = 4 μM, [c-myc] = 0.067n μM, n = 0, 1, 2…); the fluorescence emission of 1 (E) and 2 (F) in the absence and presence of c-myc G4-DNA in a Tris–HCl–KCl buffer solution (pH 7.2), 1 (G) and 2 (H) in the absence and presence of CT-DNA in Tris–HCl–NaCl buffer solution (pH 7.2), which excited at 365 nm using a portable UV lamp, ([Ru] = 20 μM, [c-myc] =20 μM, [CT-DNA] =20 μM). | |
3.2 High-order self-assembly of G-quadruplex DNA controlled by ruthenium(II) complexes
The self-assembly of c-myc G-quadruplex DNA induced by both Ru(II) complexes was first confirmed by AFM. Incubation of 1 with c-myc G-quadruplex DNA led to the formation of a mesh hole-net structure with diameters of approximately 500–1000 nm (Fig. 3A),7,26 which indicated that c-myc G-quadruplex DNA self-assembled into an orderly DNA nano-network structure in the presence of 1. As for c-myc G-quadruplex DNA incubated with 2, a typical pipeline-like structure of approximately 200 nm was observed under AFM (Fig. 3B), indicating that a nanowire structure was formed from the self-assembly of c-myc G-quadruplex DNA promoted by 2.27 Moreover, when amplified, some hole-net structures with an average size of about 250 nm were observed in the nanowires of DNA, indicating that a mixed self-assembled G-quadruplex DNA formed nano-network and nanowire structures (Fig. 3B).28 The aforementioned results indicated that both complexes could promote DNA self-assembly but form different nanostructures, which might be attributed to different binding abilities.
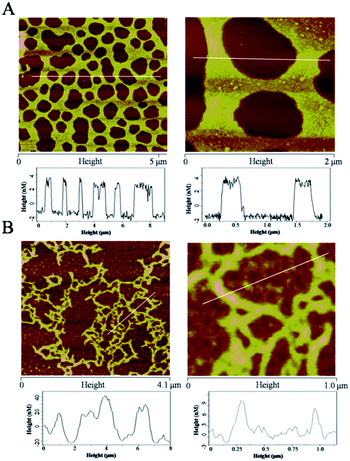 |
| | Fig. 3 (A) Atomic force microscopic (AFM) image and analysis of c-myc DNA self-assembled into nano-network structures in the presence of 1; (B) AFM image and analysis of c-myc DNA self-assembled into nanowire structures in the presence of 2. [Ru]:[c-myc] = 1:1, (100 μM). | |
3.3 Molecular conformation of G-quadruplex DNA induced by ruthenium(II) complexes in solution
The oligomeric state of c-myc G-quadruplex DNA in solution was investigated in the presence and absence of 1 and 2 by sedimentation velocity analytical ultracentrifugation. The effects of 1 and 2 were further examined as a function molecular size on the ability to visually detect molecular conformation change of c-myc G-quadruplex DNA. Under higher loading concentration (100 μM) of free c-myc G-quadruplex DNA, the weight average s value shifted slightly to 1.854 S and 3.378 S, and the relative amount of monomer reached to 79.8% and trimer for 18.9% of absorption at the expense of the other species. This was illustrated in Fig. 4d, which suggested that free c-myc G-quadruplex DNA in solution displayed two possible state having the following molecular weights, monomer state of 10.6 kDa, trimer state of 26.1 kDa. Then, upon the addition of 1, the c-myc G-quadruplex DNA in solution displayed a good deal of aggregation state with higher than monomer (Fig. 4e), 19.5 kDa and 2.410 S (dimer, 95.091%), 221 kDa and 12.18 S (polymer, 0.132%).29,30 However, in the presence of 2, the sedimentation distributions changed drastically, and 72.13% of the absorbance corresponded to a trimeric species, while the remaining absorbance sedimented as a heterogeneous mixture with s-values ranging between 2.09 and 21.4 S, corresponding to highly anisotropic aggregates ranging between 14.5 and 468 kDa in size. It showed that with the increasing of 2, the c-myc G-quadruplex DNA displayed plenty of trimerization state and different aggregation state (Fig. 4f), 29.5 kDa, 2.09 S (trimer), 77.4 kDa, 6.38 S (polymer) and 139 kDa, 9.41 S (polymer). In any case, the sedimentation velocity further revealed that 2 do participate in the association to promote the self-assembly of c-myc G-quadruplex DNA to form nanowire.
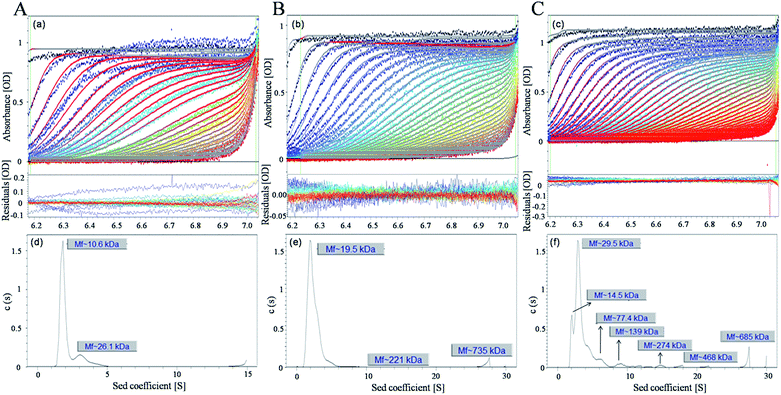 |
| | Fig. 4 Analytical ultracentrifugation analyzed the sedimentation velocity (SV) of c-myc (A), 1 (B) and 2 (C). All theoretically calculated SV concentration profiles, s(r, t), were generated using SEDFIT, fitting error and fitting curve (a–c). Sedimentation coefficient distributions c(s) from the analysis of the sedimentation profiles of the simulated c-myc G-quadruplex-1/2-bound DNA system (d–f), SV runs monitored by absorbance at 300 nm. Concentrations are [c-myc] = 100 μM, [1] = 100 μM and [2] = 100 μM. | |
3.4 Self-assembly orientations of ruthenium(II) complexes with c-myc G-quadruplex DNA
To further understand the self-assembly of c-myc G-quadruplex DNA enhanced by these Ru(II) complexes, the molecular docking simulations were carried out to confirm the binding G-quadruplex DNA in a typical groove binding mode. Moreover, 1 was inserted into the groove of c-myc G-quadruplex DNA, which was formed by base pairs A6-G8 and G21-T23 with a binding energy of −6.29 kcal mol−1. However, 2 was found to insert into the groove of c-myc G-quadruplex DNA, which was c-myc G-quadruplex DNA led to enhanced fluorescence, formed by base pairs G7-G9 and G22-A24 with a binding energy of −7.83 kcal mol−1 (Fig. 5).11 As for 1, the presence of trimethylsilylacetylene provided steric hindrance, and the molecules were inserted into a shallow groove of G-quadruplex DNA. However, for 2, the presence of phenylethynyl provided better planarity, and the molecules were inserted into a deep groove of G-quadruplex DNA through π–π stacking. These data indicated that both Ru(II) complexes might bind to c-myc G-quadruplex DNA in a groove binding mode, and 2 exhibited stronger binding ability than 1.12 Moreover, different binding sites guide different self-assembly nanostructures of c-myc G-quadruplex DNA.
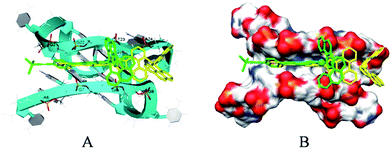 |
| | Fig. 5 The binding sites (A) and binding mode (B) of 1 and 2 with c-myc G4 DNA calculated by molecular docking. | |
3.5 G4/ds DNA-binding properties
Electronic spectra is one of the most common methods to investigate the interactions of small molecules with biological macromolecules. As shown in Fig. 6A, the electronic spectra of 1 exhibited the characteristic intraligand (IL) charge transfer absorption in the range of 250–300 nm with a maximum at 263 nm, upon the addition of c-myc G4-DNA, the hypochromism value was 42.3%. For 2, the hypochromism value was 45.0% (Fig. 6B). However, further analysis upon the addition of CT-DNA showed that both ruthenium(II) complexes bind to CT-DNA in weak affinity (Fig. 6C and D). These data demonstrated that both complexes displayed higher affinity with the c-myc G4 DNA than that of CT-DNA; especially 2, exhibited stronger affinity to c-myc G4-DNA.31,32
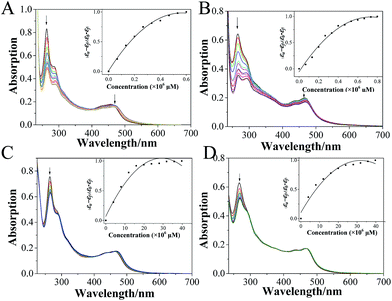 |
| | Fig. 6 The study of the interactions between 1 and 2 with c-myc G4 DNA/CT-DNA using spectroscopic method. The electronic spectras of 1 (A) and 2 (B) in the absence and presence of c-myc G4 DNA in the Tris–HCl–KCl buffer solution (pH 7.2), 1 (C) and 2 (D) in the absence and presence of CT-DNA in the Tris–HCl–NaCl buffer solution (pH 7.2), [Ru] = 10 μM, [c-myc G4 DNA] = 0–0.66 μM, [CT-DNA] = 0–60 μM. | |
3.6 Selective recognition of G-quadruplex DNA
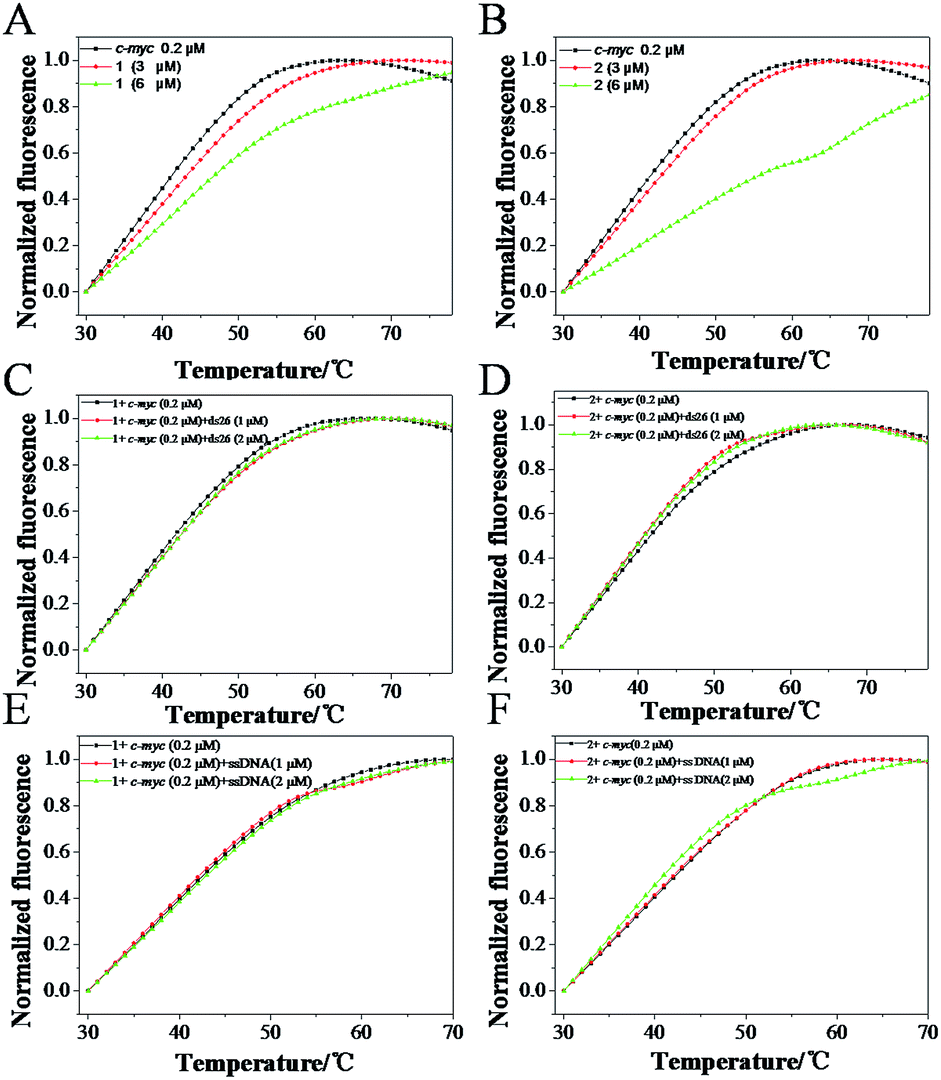
To further confirm the selectivity of Ru(II) complexes with c-myc G4 DNA, FRET melting assay was carried out to investigate the melting changes of 1 and 2 to c-myc G-quadruplex DNA. As shown in Fig. 7, the melting point of c-myc G4 DNA was about 41.2 °C, while upon the addition of 6.0 μM of 1 and 2, the melting point of c-myc G4 DNA (the Tm) increased 46.9 (ΔTm = 5.7) and 55.9 (ΔTm = 14.7) °C, respectively. These data indicated that both complexes can stabilize the c-myc G4 DNA, especially 2, displayed better stability than 1, which accord with aforementioned results. Furthermore, the competitive FRET assay was also performed to confirm the selectivity of both Ru(II) complexes between c-myc G-quadruplex DNA and single or duplex strand DNA. According to the results of FRET competitive experiments, the melting point for c-myc G4 DNA undergo almost little obvious change in the presence of excess duplex ds26 DNA or ssDNA. When r([ds26]/[c-myc]) = 10, the ΔTm for 1 and 2 was about 0.86 and −0.9 °C with a drop of less than 5%, respectively (Fig. 7C and D). Moreover, with the excessive supplies of ssDNA, it was also observed that no remarkable change of ΔTm in the presence of 1 and 2 (Fig. 7E and F). The results indicated that this class of Ru(II) complexes could selectively bind to G-quadruplex DNA more strongly than to single or double-strand DNA, which could act as a switch-on luminescence probe to selective recognize c-myc G-quadruplex DNA.33–35
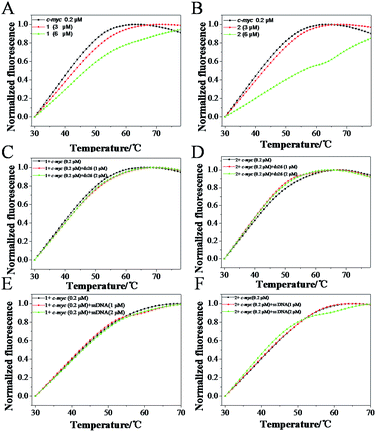 |
| | Fig. 7 FRET melting profiles of c-myc G4 DNA in the absence and in presence of 1 (A) and 2 (B) ([c-myc G4 DNA] = 0.2 μM) and the competition FRET-melting assay with ds26 in the presence of 3 μM 1 (C) and 2 (D) and with ssDNA in the presence of 3 μM 1 (E) and 2 (F), ([Ru] = 3 μM, [c-myc G4 DNA] = 0.2 μM). | |
4 Conclusions
In conclusion, two ruthenium(II) complexes modified by aryl ethyl group, [Ru(phen)2(L)](ClO4)2 (L = TMSEPIP, 1; BEPIP, 2) were synthesized in this study using Sonogashira coupling reaction under microwave irradiation. It was confirmed that the luminescence of 1 decreased in the presence of c-myc G-quadruplex DNA, the luminescence of 2 increased obviously under the same conditions. It was interesting to find by AFM that 1 could promote c-myc G-quadruplex DNA self-assembly to form a nano-network structure, while 2 formed a nanowire structure. Further studies showed that 1 was inserted into the groove formed by base pairs A6-G8 and G21-T23 of c-myc G-quadruplex DNA, while 2 was inserted into the groove formed by G7-G9 and G22-A24. It is speculated that 2 can be developed as a potential luminescent switch-on probe through selectively recognizing and promoting self-assembly of c-myc G-quadruplex DNA.
Acknowledgements
This work was supported by the authors acknowledge the National Nature Science Foundation of China (81572926); the Provincial Major Scientific Research Projects in Universities of Guangdong Province (2014KZDXM053); the Science and Technology Project of Guangdong Province (2014A020212312); the Innovation Projects in Universities of Guangdong Province (2015cxqx151).
Notes and references
- S. Lattmann, M. B. Stadler, J. P. Vaughn, S. A. Akman and Y. Nagamine, Nucleic Acids Res., 2011, 39, 9390–9404 CrossRef CAS PubMed.
- N. M. Hessari, L. Spindler, T. Troha, W. C. Lam, I. Drevenšek-Olenik and M. W. Silva, Chem.–Eur. J., 2014, 20, 3626–3630 CrossRef PubMed.
- L. A. Yatsunyk, O. Piétrement, D. Albrecht, P. L. Tran, D. Renčiuk, H. Sugiyama, J. M. Arbona, J. P. Aimé and J. L. Mergny, ACS Nano, 2013, 7, 5701–5710 CrossRef CAS PubMed.
- W. Li, Y. Yang, S. Jiang, H. Yan and Y. Liu, J. Am. Chem. Soc., 2014, 136, 729–734 Search PubMed.
- T. G. Edwardson, K. M. Carneiro, C. K. Mclaughlin, C. J. Serpell and H. F. Sleiman, Nat. Chem., 2013, 5, 868–875 CrossRef CAS PubMed.
- A. A. Almaqwashi, T. Paramanathan, I. Rouzina and M. C. Williams, Nucleic Acids Res., 2016, 44, 3971–3988 CrossRef CAS PubMed.
- L. Liu and H. Zhang, Biomaterials, 2010, 31, 1380–1391 CrossRef CAS PubMed.
- B. Yu, Y. Chen, C. Ouyang, H. Huang, L. Ji and H. Chao, Chem. Commun., 2013, 49, 810–812 RSC.
- K. Qiu, B. Yu, H. Huang, P. Zhang, J. Huang, S. Zou, Y. Chen, L. Ji and H. Chao, Sci. Rep., 2014, 5, 10707 CrossRef PubMed.
- X. Chen, J. H. Wu, Y. W. Lai, R. Zhao, H. Chao and L. N. Ji, Dalton Trans., 2013, 42, 4386–4397 RSC.
- Q. Wu, T. Chen, Z. Zhang, S. Liao, X. Wu, J. Wu, W. Mei, Y. Chen, W. Wu and L. Zeng, Dalton Trans., 2014, 43, 9216–9225 RSC.
- C. Zhao, L. Wu, J. Ren, Y. Xu and X. Qu, J. Am. Chem. Soc., 2013, 135, 18786–18789 CrossRef CAS PubMed.
- S. H. Chan, H. Yang, H. T. Kwan, Z. Cheng, P. Lee, L. P. Bai, Z. H. Jiang, C. Y. Wong, W. F. Fong and C. H. Leung, Biochemistry, 2011, 93, 1055–1064 CrossRef PubMed.
- A. Ambrus, D. Chen, J. Dai, R. A. Jones and D. Yang, Biochemistry, 2005, 44, 2048–2058 CrossRef CAS PubMed.
- N. H. Damrauer, T. R. Boussie, A. Martin Devenney and J. K. Mccusker, J. Am. Chem. Soc., 1997, 119, 8253–8268 CrossRef CAS.
- B. Hetrick, M. S. Han, L. A. Helgeson and B. J. Nolen, Chem. Biol., 2013, 20, 701–712 CrossRef CAS PubMed.
- R. Kieltyka, P. Englebienne, J. Fakhoury, C. Autexier, N. Moitessier and H. F. Sleiman, J. Am. Chem. Soc., 2008, 130, 10040–10041 CrossRef CAS PubMed.
- D. B. Kitchen, H. Decornez, J. R. Furr and J. Bajorath, Nat. Rev. Drug Discovery, 2004, 3, 935–949 CrossRef CAS PubMed.
- Z. P. Zeng, Q. Wu, F. Y. Sun, K. D. Zheng and W. J. Mei, Inorg. Chem., 2016, 55, 5710–5718 CrossRef CAS PubMed.
- H. Qin, J. Ren, J. Wang and E. Wang, Chem. Commun., 2010, 46, 7385–7387 RSC.
- M. H. W. Stopel, C. Blum and V. Subramaniam, J. Phys. Chem. Lett., 2014, 5, 3259–3264 CrossRef CAS PubMed.
- W. Liu, M. Lin, X. Yang, B. Wu, N. Chen, Q. Wang, K. Wang and S. Qin, Analyst, 2016, 141, 4463–4469 RSC.
- B. Y. Man, D. S. Chan, H. Yang, S. W. Ang, F. Yang, S. C. Yan, C. M. Ho, P. Wu, C. M. Che, C. H. Leung and D. L. Ma, Chem. Commun., 2010, 46, 8534–8536 RSC.
- L. Lu, D. S. H. Chan, D. W. J. Kwong, H. Z. He, C. H. Leung and D. L. Ma, Chem. Sci., 2014, 5, 4561–4568 RSC.
- K. H. Leung, H. Z. He, B. He, H. J. Zhong, S. Lin, Y. T. Wang, D. L. Ma and C. H. Leung, Chem. Sci., 2015, 6, 2166–2171 RSC.
- L. T. Costa, M. Kerkmann, G. Hartmann, S. Endres, P. M. Bisch, W. M. Heckl and S. Thalhammer, Biochem. Biophys. Res. Commun., 2004, 313, 1065–1072 CrossRef CAS PubMed.
- P. P. Neelakandan, Z. Pan, M. Hariharan, Y. Zheng, H. Weissman, B. Rybtchinski and F. D. Lewis, J. Am. Chem. Soc., 2010, 132, 15808–15813 CrossRef CAS PubMed.
- H. Wang, G. J. Nora, H. Ghodke and P. L. Opresko, J. Biol. Chem., 2011, 286, 7479–7489 CrossRef CAS PubMed.
- J. Walter, P. J. Sherwood, W. Lin, D. Segets, W. F. Stafford and W. Peukert, Anal. Chem., 2015, 87, 3396–3403 CrossRef CAS PubMed.
- P. Anzini, C. Xu, S. Hughes, E. Magnotti, T. Jiang, L. Hemmingsen, B. Demeler and V. P. Conticello, J. Am. Chem. Soc., 2013, 135, 10278–10281 CrossRef CAS PubMed.
- A. M. Chiorcea-Paquim, P. V. Santos, R. Eritja and A. M. Oliveira-Brett, Phys. Chem. Chem. Phys., 2013, 15, 9117–9124 RSC.
- A. K. Mårtensson and P. Lincoln, Dalton Trans., 2015, 44, 3604–3613 RSC.
- X. Chen, J. H. Wu, Y. W. Lai, R. Zhao, H. Chao and L. N. Ji, Dalton Trans., 2013, 42, 4386–4397 RSC.
- M. Sproviero, K. L. Fadock, A. A. Witham, R. A. Manderville, P. Sharma and S. D. Wetmore, Chem. Sci., 2013, 5, 778–796 Search PubMed.
- S. Lin, B. He, C. Yang, C.-H. Leung, J.-L. Mergny and D.-L. Ma, Chem. Commun., 2015, 51, 16033–16036 RSC.
Footnote |
| † Electronic supplementary information (ESI) available. See DOI: 10.1039/c7ra01853c |
|
| This journal is © The Royal Society of Chemistry 2017 |
Click here to see how this site uses Cookies. View our privacy policy here. 
 Open Access Article
 This Open Access Article is licensed under a Creative Commons Attribution-Non Commercial 3.0 Unported Licence
 *a,
Xi-Cheng Wang*b,
Qi Wanga,
Shuang-Yan Zhanga and
Wen-Jie Mei
*a,
Xi-Cheng Wang*b,
Qi Wanga,
Shuang-Yan Zhanga and
Wen-Jie Mei