
 Open Access Article
 This Open Access Article is licensed under a
 Creative Commons Attribution 3.0 Unported Licence
A label-free phosphorescence sensing platform for trypsin based on Mn-ZnS QDs
Wei Liuab,
Huanhuan Lia,
Yanli Wei *a and
Chuan Donga
*a and
Chuan Donga
aInstitute of Environmental Science, Shanxi University, Taiyuan, 030006, P. R. China. E-mail: weiyanli@sxu.edu.cn
bCollege of Environmental & Resource Sciences, Shanxi University, Taiyuan, 030006, P. R. China
First published on 19th May 2017
Abstract
A label free phosphorescence sensing platform for trypsin was developed employing Mn doped ZnS quantum dots (Mn-ZnS QDs) as the phosphorescence probe. Mn-ZnS QDs can emit strong room temperature phosphorescence. Upon addition of Cytochrome c (Cyt c), a hybrid complex between Mn-ZnS QDs and Cyt c was formed, and consequently, quenched the phosphorescence of Mn-ZnS QDs. In the presence of trypsin, Cyt c was hydrolyzed into small fragments, and accordingly, the quenched phosphorescence of Mn-ZnS QDs went back and high phosphorescence intensity was observed. As such, based on the phosphorescence signal changes of the system, a label free turn-on phosphorescence sensing platform was fabricated. Factors affecting the determination of trypsin including the concentration of Mn-ZnS QDs, reaction time, temperature and pH effect were comprehensively explored. Under the optimal experimental conditions the restored phosphorescence of the sensing system displayed a response for trypsin in the range of 0.88–15.6 μg mL−1 with a detection limit of 42 ng mL−1. Additionally, the sensing platform was successfully applied for the determination of trypsin in human serum samples with satisfactory recovery.
Introduction
As a member of the proteases, trypsin is an important digestive enzyme.1 It is secreted by the pancreas in an inactive form, trypsinogen, and plays an irreplaceable role in protein digestion in the small intestine. Trypsin can selectively hydrolyze the C-terminal of arginine and lysine.2 Abnormal levels of trypsin will cause many diseases such as pancreatitis and meconium ileus.3 Therefore, the detection of trypsin is quite crucial for both clinical diagnoses and biochemical applications. So far, there are a variety of techniques for the detection of trypsin including the enzyme linked immunosorbent assay (ELISA),4 gel electrophoresis,5 mass spectrometry,6 electrochemical,2,7 colorimetric8 and fluorometric methods.3,9 However, many of these methods are either cumbersome or time-consuming. It is still highly desirable to develop simple strategies for the detection of trypsin.Much attention has been paid recently to photoluminescence-based methods because of their advantages, such as simple operation, high sensitivity, low cost, wide applicability, along with the multi-signal modes associated with the technique. Various fluorescence probes have been used in the detection of trypsin including tetraphenylethene compounds,10 fullerene-fluorescein,11 sodium dodecyl sulfate/protamine/fluorescent hydrophobic dye assemblies,12 Au-peptide-FITC beacon,13 CdTe quantum dots.14 Among these probes, quantum dots (QDs) are regarded as excellent optical probe which exhibit size-dependent emission wavelength, great photostability, high photoluminescence efficiency and a broad excitation spectrum over conventional organic fluorochrome.15 In the past two decades the luminescence QDs have attracted considerable attention for the analysis of ions,16 biomolecules17 and pharmaceuticals18 and bioimaging.19 When different metal ions were introduced into the quantum dots, the optical properties will be improved greatly. As an important class of nanomaterial, Mn doped zinc sulfide quantum dots (Mn-ZnS QDs) have draw widely attention in different fields attributing to their low toxicity, stable wide band gap, and strong phosphorescence emission. Recently, Hou et al. developed a series of Mn-ZnS QDs phosphorescence sensing systems for small molecules20 and proteins21 by changing the ligands. Using Cytochrome c (Cyt c) as the ligand, they proposed an analyte-activable Mn-doped ZnS QDs phosphorescence sensing, in which the phosphorescence of the Cyt c-capped Mn-doped ZnS QDs was “locked” and it can be activated by trypsin.22 Herein, we synthesized water soluble Mn-doped ZnS quantum dots using mono-6-SH-β-cyclodextrin as the modifier. Our previous research has shown that cyclodextrins coated on the nanoparticle surface still retain the capability of molecular recognition.23 More importantly, cyclodextrin can provide a site for the enzyme catalyzed reactions. Herein we report a sensitive phosphorescence turn-on method for trypsin activity based on the phosphorescence emission of Mn-ZnS QDs. It is worth mentioning that our assay can get the room temperature phosphorescence signal not requiring tedious deoxidization and protective medium. When negatively charged Mn-ZnS QDs and positively charged Cytochrome c (Cyt c) are mixed, they tend to form a hybrid complex and then the phosphorescence of Mn-ZnS QDs would be quenched. When trypsin is presence, Cyt c can be hydrolyzed into small fragments, subsequently Mn-ZnS QDs can be released from the hybrid complex and the quenched phosphorescence is restored. Based on this, a “turn-on” phosphorescence assay for the sensing of trypsin is developed. Our assay is sensitive, selective and can be applied for the analysis of trypsin in human serum.
Experimental section
Chemicals and regents
All chemicals were of analytical grade and were used without further purification. ZnSO4·7H2O and Mn(CH3COO)2·4H2O were obtained from Tianjin Chemical Reagent Company (Tianjin, China). Na2S·9H2O was from Aladdin Chemical Reagent Company (Tianjin, China). Cytochrome c was purchased from Sigma-Aldrich. Trypsin was purchased from Beijing Solarbio Science and technology Co. LTD (Beijing, China). Purified water from a Milli-Q water purification system (Millipore, Bedford, MA) with a resistivity higher than 18.2 MΩ cm−1 was used to prepare all solutions.Instrumentation
The absorption was conducted on a TU-1901 UV-vis spectrometer (Beijing Puxi, China). Phosphorescence spectra were performed on a Cary Eclipse fluorescence spectrophotometer (Varian, Forest Hill, Victoria, Australia) equipped with a pulsed xenon lamp and a standard 10 × 10 mm quartz cell.Synthesis of Mn-ZnS QDs
Mn-ZnS QDs were prepared in aqueous solution by a nucleation doping method based on our previous report.5 The synthetic procedures were given as follows. Aqueous solutions of ZnSO4, Mn(CH3COO)2 and 6-SH-β-CD were added into a 100 mL three neck flask and bubbling with nitrogen for 30 min to remove the air of the solution, then the pH of the system was adjusted to 11.0 with 1.0 mol L−1 NaOH solution. Afterwards, Na2S was quickly injected into the solution. The mixture was stirred for 40 min, and then the solution was aged for 2 h at 50 °C to form Mn-ZnS QDs. Finally, the resultant Mn-ZnS QDs were centrifuged and washed with pure water and anhydrous ethanol for three times and dried in a vacuum.Assay procedure for trypsin detection
Trypsin with different concentration was added to 2 mM phosphate buffer solution (pH 8.0) containing 0.38 μM Cyt c and 100 mg mL−1 Mn-ZnS QDs. Then the mixture was incubated at 40 °C for 30 min. And then the working solution was transferred into a 10 mm standard quartz cell to record the room temperature phosphorescence spectra or the intensity. The sample was excited at 316 nm and the phosphorescence signal was monitored at 598 nm. The excitation and emission slit widths were both set at 10 nm.Real sample preparation
The normal and fresh adult human blood samples were provided by Shanxi University Hospital. The serum samples were obtained by centrifuging the fresh blood samples at 3000 rpm for 5 min and diluted 10 times with 20 mM phosphate buffer. The followed detection procedure was similar to that as shown in the aforementioned experiment for trypsin detection.Results and discussion
Strategy of trypsin sensing system
The design of the trypsin label free phosphorescence assay is illustrated in Scheme 1. Mn-ZnS QDs initially exhibited high phosphorescence emission at 598 nm in phosphate buffer solution. Upon addition of Cyt c, the phosphorescence of Mn-ZnS was quenched because the interaction between Mn-ZnS and Cyt c.22,24 In the presence of trypsin, Cyt c will be hydrolyzed to peptide fragment and the electron transfer is terminated and the phosphorescence of the system will be restored. Based on this mechanism, a simple and label-free phosphorescence turn-on sensing platform for trypsin detection is therefore proposed. To test the feasibility of the proposed strategy, we investigated the phosphorescence of Mn-ZnS QDs in the absence and presence of Cyt c before and after trypsin is added. As presented in Fig. 1, Mn-ZnS QDs emit strong phosphorescence (Fig. 1, line a), which can be quenched by Cyt c (Fig. 1, line c). After addition of trypsin, as we expected, the phosphorescence was restored (Fig. 1, line b). It was clear that our proposed method can be applied for the trypsin detection. | ||
| Scheme 1 Schematic representation of the sensing procedure for trypsin based on the phosphorescence changes. | ||
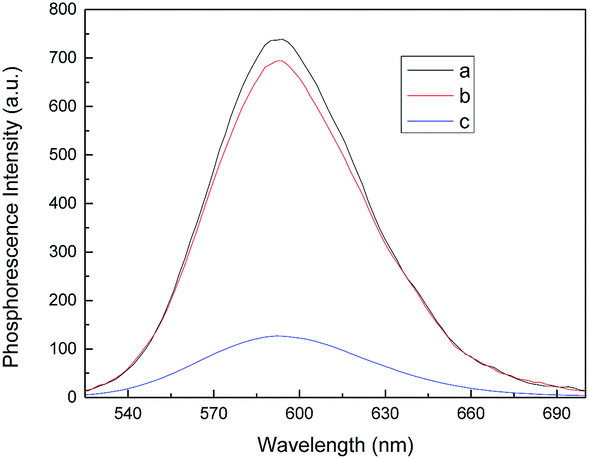 | ||
| Fig. 1 Phosphorescence emission spectra of the sensing system under different conditions: (a) 100 mg mL−1 Mn-ZnS QDs in 0.1 M PBS (c) 100 mg mL−1 Mn-ZnS QDs + 0.5 μM Cyt c (b) 100 mg mL−1 Mn-ZnS QDs + 0.5 μM Cyt c + 12.5 μg mL−1 trypsin reacted at 40 °C for 40 min. | ||
Optimization of experimental conditions
Experimental conditions including pH effect, Cyt c concentration, incubation time and temperature were optimized in order to achieve the highest sensitivity. Firstly, considering the isoelectric point of Cyt c is 10.0–10.5 (ref. 25) and different pH will have an important effect on the activity of trypsin and the interaction between Cyt c and Mn-ZnS QDs, we investigated pH effect on the detection of trypsin in the range of 6.0–10.5. As shown in Fig. 2a, the phosphorescence of Mn-ZnS QDs was quenched by Cyt c, and the quenching extent obtained the maximum at pH 8.0. While addition of trypsin, the quenched phosphorescence went back and reached a plateau at pH 8.0. So pH 8.0 was chosen as the optimal pH condition for the further experiments. | ||
| Fig. 2 Experimental conditions effect on the detection of trypsin. (a) Effect of pH on the detection of trypsin. (b) Trypsin digestion reaction kinetics at different temperature (25 °C, 30 °C, 35 °C, 40 °C). (c) Phosphorescence emission spectra of Mn-ZnS QDs in the presence of Cyt c (a–t represent the concentration of Cyt c from 0.046 μM to 0.82 μM) (d) the scatter plot of the phosphorescence intensity of QDs corresponding to the different concentration of Cyt c. | ||
Enzymatic reaction is close tied to the digestion time and temperature. As such, the kinetics of the protease enzymatic reaction was examined. Fig. 2b exhibited trypsin digestion reaction kinetics at different temperature. It was clear that the phosphorescence recovery was observed when Cyt c was hydrolyzed by trypsin and the electron transfer was terminated. With the addition of trypsin, the phosphorescence of the system at 598 nm increased with the enzymatic reaction and the digestion reaction reached equilibrium in 70 min at all different temperature. And the higher the temperature was, the faster phosphorescence recovery caused. The results clearly suggest that the substrate Cyt c was gradually digested. Considering the activity of trypsin and practicability of the presented assay, 40 °C was chosen as the digestion temperature and 40 min as the digestion time.
Finally, the concentration of Cyt c effect on the detection of trypsin was explored. As we can see from Fig. 2c, Mn-ZnS QDs exhibited strong phosphorescence in 100 mM phosphate buffer solution. With the addition of Cyt c, the phosphorescence of Mn-ZnS QDs gradually decreased, because of the electron transfer between Mn-ZnS QDs and Cyt c.22,24 Cyt c is entrapped into the mitochondrial membrane, with heme as the cofactor. As a well-known electron-transfer protein, it has been identified as electron-transfer quencher for QDs.22,24 Cyt c-induced quenching can also be ascribed to the heme cofactor.22 When 200 nM Cyt c was added, a quenching efficiency of 65% was obtained (Fig. 2d). Further increase of the Cyt c concentration to 400 nM caused unobvious decrease of the phosphorescence signal of the system. Then a little decrease of phosphorescence (about 8%) was observed when the concentration of Cyt c increased from 400 nM to 700 nM, suggesting that the higher concentration of Cyt c would cause a decrease of phosphorescence responses because of the impact of free Cyt c. As such, 300 nM Cyt c was therefore used for the following protease detection.
Detection for trypsin
Under the optimal experimental condition, Mn-ZnS QDs/Cyt c system for the trypsin activity assay was performed. Fig. 3 depicts the change in phosphorescence spectra of Mn-ZnS QDs/Cyt c in the presence of trypsin. The phosphorescence of the system increases as trypsin increases. This attributed to catalysis of trypsin to Cyt c. When trypsin is in the presence of the system, Cyt c was digested to small peptide fragments and the electron transfer between Mn-ZnS QDs and Cyt c was terminated and the phosphorescence of the system restored. The phosphorescence of the system recovered to 66.5% of the original when trypsin concentration was at 4.0 μg mL−1, and it increased to 93.8% when the concentration of trypsin increased to 15.0 μg mL−1. However, it should be noted that it cannot be restored to its original intensity, which may derive from the cysteine of Cyt c. It was reported that two cysteine residues bind to the heme group by C–S bond in Cyt c molecule, and Cyt c was digested into small pieces when adding trypsin in the system, and then amino acid residues was released, which caused to the quenching of the phosphorescence of the system.26 | ||
| Fig. 3 (A)The spectra of QDs/Cyt c in the presence of different concentrations of trypsin, a–k is the concentration of trypsin in the range of 0 and 15.6 μg mL−1. (B) The scatter plot of logarithmic of phosphorescence intensity relation to the concentration of trypsin. Inset: calibration curve of the phosphorescence intensities vs. the logarithmic of the concentration of trypsin. | ||
Then we obtained the phosphorescence intensity response as a function of trypsin and the results were displayed in Fig. 3B. As shown in Fig. 3B inset, there was a good linearity between the phosphorescence intensity and the logarithmic of trypsin concentration in the range of 0.88–15.60 μg mL−1, and the regression equation was Ip = 66.79![[thin space (1/6-em)]](https://www.rsc.org/images/entities/char_2009.gif) logCtrypsin + 411.19(R2 = 0.993). The limit of detection was 42 ng mL−1 based on eleven times of the standard deviation of the blank.
logCtrypsin + 411.19(R2 = 0.993). The limit of detection was 42 ng mL−1 based on eleven times of the standard deviation of the blank.
Selectivity
The selectivity of the proposed methods for detection of trypsin was evaluated in the presence of other coexistence ions or substance including Na+, K+, Zn2+ Ca2+, Mg2+, HSA, L-cysteine, glycine, glucose, glutathione. As exhibited in Table 1, 50 times higher concentrations (280 μg mL−1) of Na+, K+, Zn2+, Ca2+,Mg2+, HSA, BSA, thrombin, pepsase, Lysozyme and 25 times higher concentrations (140 μg mL−1) of L-cysteine , glycine, glucose, glutathione only showed negligible interference on the detection, suggesting our proposed assay exhibited an excellent specificity for trypsin.| Coexisting substance | Concentration (μg mL−1) | Changes of phosphorescence intensity (%) |
|---|---|---|
| Na+ | 280 | −1.31 |
| K+ | 280 | −1.17 |
| Zn2+ | 280 | +2.50 |
| Ca2+ | 280 | −1.82 |
| Mg2+ | 280 | −1.53 |
| L-Cysteine | 140 | −2.17 |
| Glycine | 140 | −1.39 |
| Glucose | 140 | +2.50 |
| Glutathione | 140 | +1.23 |
| HSA | 280 | +3.02 |
| BSA | 280 | +2.89 |
| Thrombin | 280 | +3.76 |
| Pepsase | 280 | +1.38 |
| Lysozyme | 280 | +1.79 |
Application of the assay in biological assay
In order to evaluate the suitability of this assay for detection of trypsin in biological sample, the fabricated sensing platform was further applied to the trypsin assay in real blood serum samples and the results were summarized in Table 2. It could be seen that the content of trypsin as determined by our proposed sensing assay was in good with the standard addition in human serum samples with the relative error less than 5.0%. A comparison between the proposed method and other reported methods for trypsin determination were summarized in Table 3. It could be seen that this method was comparable to the previously reported results.| Samples | Added (μg mL−1) | Found (μg mL−1) | Recovery (%) |
|---|---|---|---|
| 1 | 1.76 | 1.68 ± 0.06 | 95.45 ± 3.41 |
| 2 | 4.0 | 3.88 ± 0.09 | 95.41 ± 2.25 |
| 3 | 8.0 | 8.26 ± 0.12 | 103.25 ± 1.50 |
| Methods | System | Linear range (μg mL−1) | LOD (ng mL−1) | Ref. |
|---|---|---|---|---|
| Fluorometry | Graphene oxide/Arg6 | Not mentioned | 100 | 8a |
| FRET | β-CD dimer–dye complex | 0.10–25 | 46 | 22 |
| Fluorometry | Fullerene (C60) | 0.44–70.4 | 40 | 11 |
| Fluorometry | Mn:ZnSe d-dots/Arg6 | 0.1–12 | 40 | 3 |
| Phosphorimetry | Cyt c Mn:ZnS QDs | 1.2–24 | 48 | 22 |
| Phosphorimetry | β-CD Mn:ZnS QDs/Cyt c | 0.88–15.6 | 42 | This work |
Conclusions
In a word, a label free “off-on” phosphorescence sensing platform has been developed for trypsin detection using Mn-ZnS QDs as the phosphorescence probe. The phosphorescence of Mn-ZnS QDs can be quenched by Cyt c based on the electron transfer between Mn-ZnS QDs and Cyt c, which can be broken down by trypsin. The presented assay can be used to detect trypsin in a range of 0.88–15.6 μg mL−1 with a detection limit of 42 ng mL−1, which was comparable to the previous works. Moreover, the synthetic route for the phosphorescence probe is simple and the reagents are easily acquiring. Therefore, the proposed method was potential in detection of trypsin, which is of great importance in pancreatitis diagnosis and therapies.Acknowledgements
Financial supports from the National Natural Science Foundation of China (Grants 21507076 and 21347008) are gratefully acknowledged.Notes and references
- D. Liao, Y. Li, J. Chen and C. Yu, Anal. Chim. Acta, 2013, 784, 72 CrossRef CAS PubMed.
- M. A. Hermodson, L. H. Ericsson, H. Neurath and K. A. Walsh, Biochemistry, 1973, 12, 3146 CrossRef CAS PubMed.
- X. Gao, G. Tang, Y. Li and X. Su, Anal. Chim. Acta, 2012, 743, 131 CrossRef CAS PubMed.
- M. B. Rhodes, R. M. Hill and R. E. Feeney, Anal. Chem., 1957, 29, 376 CrossRef CAS.
- D. M. Krizek and M. E. D. Rick, Electrophoresis, 2001, 22, 946 CrossRef CAS.
- B. Y. Fong and C. S. Norris, J. Agric. Food Chem., 2009, 57, 6021 CrossRef CAS PubMed.
- K. Kerman, K. A. Mahmoud and H.-B. Kraatz, Chem. Commun., 2007, 3829 RSC.
- (a) X. Gu, G. Yang, G. Zhang, D. Zhang and D. Zhu, ACS Appl. Mater. Interfaces, 2011, 3, 1175–1179 CrossRef CAS PubMed; (b) G. L. Wang, L. Y. Jin, Y. M. Dong, X. M. Wu and Z. J. Li, Biosens. Bioelectron., 2015, 64, 523–529 CrossRef CAS PubMed.
- (a) J. X. Liu, H. Chen, Z. Lin and J. M. Lin, Anal. Chem., 2010, 82, 7380 CrossRef CAS PubMed; (b) W. Zhang, P. Zhang, S. Zhang and C. Zhu, Anal. Methods, 2014, 6, 2499 RSC.
- W. X. Xue, G. X. Zhang, D. Q. Zhang and D. B. Zhu, Org. Lett., 2010, 12, 2274 CrossRef CAS PubMed.
- K. H Xu, F. Liu, J. Ma and B. Tang, Analyst, 2011, 136, 1199 RSC.
- X. Liu, Y. Li, L. Jia, S. Chen and Y. H. Shen, RSC Adv., 2016, 6, 93551 RSC.
- X. R. Zhao, Y. L. Chen, L. Wang, W. F. Wang and X. G. Chen, Anal. Methods, 2016, 8, 393 RSC.
- W. Z. Zhang, P. Zhang, S. Z. Zhang and C. Q. Zhu, Anal. Methods, 2014, 6, 2499 RSC.
- W. Bian, F. Wang, Y. Wei, L. Wang, Q. Liu, W. Dong, S. Shuang and M. M. Choi, Anal. Chim. Acta, 2015, 856, 82 CrossRef CAS PubMed.
- W. Bian, J. Ma, Q. Liu, Y. Wei, Y. Li, C. Dong and S. Shuang, Luminescence, 2014, 29, 151–157 CrossRef CAS PubMed.
- (a) N. Ertas and H. E. Satana Kara, Biosens. Bioelectron., 2015, 70, 345 CrossRef CAS PubMed; (b) Z. Zhang, Y. Miao, Q. Zhang and G. Yan, Anal. Biochem., 2015, 478, 90 CrossRef CAS PubMed.
- G. P. Mitchell, C. A. Mirkin and R. L. Letsinger, J. Am. Chem. Soc., 1999, 121, 8122 CrossRef CAS.
- M. Y. Han, X. H. Gao, J. Z. Su and S. Nie, Nat. Biotechnol., 2001, 19, 631 CrossRef CAS PubMed.
- (a) H. W. He, C. H. Li, Y. F. Tian, P. Wu and X. D. Hou, Anal. Chem., 2016, 88, 5892 CrossRef CAS PubMed; (b) P. Wu, T. Zhao, Y. F. Tian, L. Wu and X. D. Hou, Chem.–Eur. J., 2013, 19, 7473 CrossRef CAS PubMed.
- (a) P. Wu, Y. Zhang, S. L. Wang, A. R. Zhu and X. D. Hou, Chem.–Eur. J., 2014, 20, 952 CrossRef CAS PubMed; (b) C. H. Li, W. Peng and X. D. Hou, Nanoscale, 2016, 8, 4291 RSC.
- P. Wu, T. Zhao, J. Y. Zhang, L. Wu and X. D. Hou, Anal. Chem., 2014, 86, 10078 CrossRef CAS PubMed.
- Y. L. Wei, H. H. Li, H. Y. Hao, Y. X. Chen, C. Dong and G. F. Wang, Polym. Chem., 2015, 6, 591 RSC.
- M. L. Hong, L. J. Li, H. X. Han and X. A. Chu, Anal. Sci., 2014, 30, 811 CrossRef CAS PubMed.
- L. Malmgren, Y. Olsson, T. Olsson and K. Kristensson, Brain Res., 1978, 153, 477 CrossRef CAS PubMed.
- P. Li, Y. Liu, X. Wang and B. Tang, Analyst, 2011, 136, 4520 RSC.
| This journal is © The Royal Society of Chemistry 2017 |