 Open Access Article
Transformation of bioethanol to 1,3-butadiene and other bulk chemicals over the surface of Mg–Al catalysts
Meixiang Gaoab,
Minhua Zhangab and
Yonghui Li *ab
*ab
aKey Laboratory for Green Chemical Technology of Ministry of Education, R&D Center for Petrochemical Technology, Tianjin University, Tianjin 300072, P R China. E-mail: liyh@tju.edu.cn; Fax: +86-22-27401826; Tel: +86-22-27401826
bCollaborative Innovation Center of Chemical Science and Engineering, Tianjin 300072, China
First published on 22nd May 2017
Abstract
The synthesis of bulk chemicals from bioethanol and analysis of the product distribution over Mg–Al catalysts were investigated. Preparation methods of co-precipitation, hydrotalcite-like compounds and impregnation were studied. Catalysts were characterized by X-ray diffraction, nitrogen adsorption–desorption, scanning electron microscopy, transmission electron microscopy, NH3-temperature-programmed desorption (NH3-TPD), CO2-TPD and Fourier-transform infrared spectroscopy of adsorbed pyridines. Different preparation methods had an impact on the surface structure and chemical nature of the catalysts. Ethylene was obtained mainly on sites of strong acids and strong bases. Sites of moderately strong acids and bases were suitable for 1,3-butadiene (BD) formation. To obtain higher BD selectivity, the ratios of MgO and Al2O3 must be examined and modifiers used to adjust the acid–base balance must be adopted in Mg–Al catalysts.
1. Introduction
In recent years, the production of chemical raw materials from biomass has become increasingly in demand with development of the economy. In addition to the use as biofuels, bioethanol produced from renewable resources in large amounts holds considerable promise as a building block for the chemical industry.1 The process of “green” and renewable 1,3-butadiene (BD) formation from bioethanol is an example of this approach. In 2012, worldwide consumption of BD was ≈10 million metric tons with incremental growth of 1–2% per year.2 Currently, BD is manufactured in a petroleum-refining process as a byproduct of ethylene production, which is expensive.3 Moreover, the world is faced with the challenge of high oil prices, depletion of petroleum reserves and environmental issues (including global warming). Hence, it is crucial to develop alternative processes for BD as well as ethylene production from non-petroleum, renewable resources such as bioethanol.4–7 In particular, the process of bioethanol production from non-food biomass feedstock is used widely.8–10The technology of BD formation from ethanol was developed more than one century ago. Two processes were studied for the synthesis of BD from ethanol: Ostromisslenski11 and Lebedev.12 Several types of materials were used in these reactions, including single oxides, composite oxides, or metal oxides supported on molecular sieves or clay.13–19 At present, the catalyst systems studied have been mainly Mg–Si, Zr–Si and Ta–Si. The promotors are major Ag, Cu, Zn and Hf. However, they still exhibit relatively low catalytic activity. Several studies have reported how the reaction of ethanol conversion to BD works on catalyst surfaces, but the structure–property relationship of these catalysts is controversial.20–23 Hence, attempts to improve a novel catalyst system are applicable.
According to recent studies, the dehydrogenation of ethanol occurs mainly on basic sites such as MgO,20–22 and several reports have pointed out that the Meerwein–Ponndorf–Verley (MPV) reaction occurs over Mg–Al catalyst.24–27 Hence, the Mg–Al catalyst system was adopted in the present study to study the product distribution of BD and other bulk chemicals. The preparation methods of co-precipitation, hydrotalcite-like compounds (HTLcs) and impregnation have been studied. The structures and properties of the catalysts and distribution of products on catalysts using these these preparation methods were analyzed, and could lay foundations for the development and application of highly active catalysts.
2. Experimental
2.1 Catalyst preparation
Three methods of synthesis were used for Mg–Al catalysts.(1) Co-precipitation: 25% ammonia solution was added dropwise to mixed Mg(NO3)2·6H2O and Al(NO3)3·9H2O aqueous solutions containing 40 wt% MgO at 333 K under vigorous stirring while maintaining the pH between 9 and 10. This operation was repeated until complete precipitation. The precipitate was washed in deionized water several times until the pH of the solution was 7. The product was dried at 353 K for 6 h and calcined at 773 K for 5 h. This sample was labeled as Mg–Al–C.
(2) HTLcs: An aqueous solution containing Mg(NO3)2·6H2O and Al(NO3)3·9H2O with 40 wt% MgO content was added dropwise to another solution (0.2 L) containing NaOH (0.4375 mol) and Na2CO3 (0.1125 mol) in a 0.5 L beaker under vigorous stirring at 333 K, followed by filtering and washing with boiling distilled water. The precipitate was dried at 353 K for 6 h and calcined at 773 K for 5 h. This sample was labeled as Mg–Al–H.
(3) Impregnation: MgO/γ-Al2O3 catalysts were obtained by incipient wetness impregnation of γ-Al2O3 (BASF) with Mg(NO3)2·6H2O aqueous solution. After impregnation, the samples were treated under ultrasound for 2 h. Then, the precursors were dried at 353 K and calcined at 773 K for 5 h in a flow of dry air. This sample was labeled as Mg–Al–I.
2.2 Catalyst characterization
X-ray powder diffraction (XRD) patterns were obtained by a Multiplex instrument (Rigaku) with a Cu-K radiation source operated at 40 kV and 40 mA. Nitrogen adsorption isotherms were measured at 77 K on a Tristar 3000 volumetric adsorption analyzer (Micromeritics). Before adsorption measurements, all samples were outgassed at 673 K in a degassing station. Scanning electron microscopy (SEM) images were recorded on a XL-30S FEG scanning electron microscope (Philips). Transmission electron microscopy (TEM) images were obtained by a G2 F20 (Tecnai) system operated at 200 kV. The nature of acidic sites and basic sites were determined by NH3-temperature programmed desorption (TPD) and CO2-TPD recorded through a Autochem II 2920 system (Micromeritics). Adsorbed pyridines were tested on a Nicolet 560 Fourier-transform infrared (FTIR) spectrometer (Thermo Scientific) with 64 scans at 4 cm−1 resolution.2.3 Impulse response
Impulse response experiments were operated on an Auto II 2920 automated catalyst characterization system (Micrometrics) and products were analyzed by an online mass spectrometer (Omnistar MS200; Balzers). The catalyst (100 mg) was fixed in a quartz reactor. Before the experiment, the sample was pretreated in N2 at 773 K for 2 h at a heating rate of 20 °C min−1, and a N2 flow rate of 20 ml min−1. After pretreatment of the catalyst and a temperature drop to 698 K, an ethanol/He gas mixture was injected onto the catalyst surface through a quantitative loop (1 μl). Mass spectrometry was used to detect all possible products.2.4 Catalytic test
Ethanol-conversion experiments were performed in a fixed-bed reactor system. The catalyst (3.0 g; sieved to a particle size of 0.425–0.850 mm) was loaded in the middle of the quartz tube. Before the reaction, catalysts were pretreated to the reaction temperature (673 K; heating rate = 5.0 K min−1) with N2 flow (40 ml min−1) as the carrier gas. The reaction was then performed with a weight hourly space velocity (WHSV) of 1.8 h−1 at 673 K. Products were detected online by an 7890A system (Agilent) equipped with a carbon-plot column (0.535 mm (id) × 3 μm (thickness) × 30 m (length)) and thermal conductivity detector (TCD).3. Results and discussion
3.1 Properties of Mg–Al catalysts
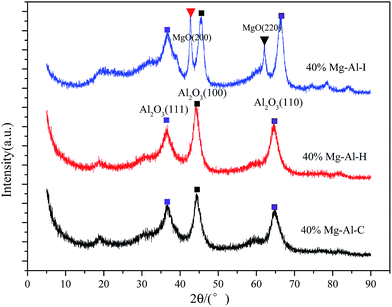
XRD patterns of Mg–Al catalysts are shown in Fig. 1. XRD patterns of the Mg–Al–C sample showed the typical features of crystalline Al2O3. For Al2O3, the peaks at approximately 37°, 45° and 65° corresponded to diffraction by planes (111), (100) and (110), respectively. No peaks due to crystalline MgO or any other crystalline impurity phases were discerned. After calcination at 773 K, the structure was that of a mixed oxide of the Mg–Al type. Similarly, peaks belonging to crystalline MgO were not detected. XRD patterns of Mg–Al–I showed peak reflections at about 43° and 62°, which corresponded to diffraction by planes (200) and (220) of the periclase in addition to Al2O3 (111), (100) and (110). These findings suggested that MgO could not be well dispersed on the surface of Al2O3 with 40 wt% MgO content.Structural properties of the samples are summarized in Table 1. The specific surface areas of Mg–Al–C, Mg–Al–H and Mg–Al–I samples were 166, 166 and 210 m2 g−1, respectively. Mg–Al–C and Mg–Al–H catalysts prepared by precipitation methods exhibited the same surface area. However, the Mg–Al–I sample preserved many more properties of the carrier with relatively high specific area. The average pore size pointed to mesoporous catalysts and increased successively from Mg–Al–C, Mg–Al–H to Mg–Al–I.
| Preparation method | BET surface area (m2 g−1) | Average pore diameter (Å) |
|---|---|---|
| Co-precipitation | 166 | 31 |
| HTLcs | 166 | 47 |
| Impregnation | 210 | 62 |
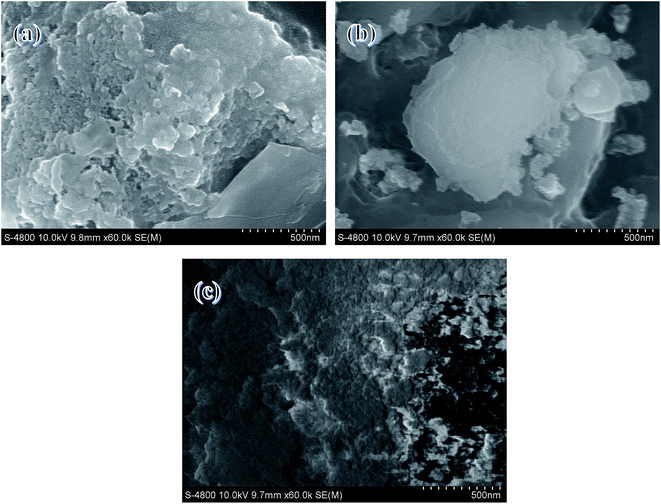
SEM images of the samples are shown in Fig. 2. It Mg–Al–C catalysts exhibited a lamella shape and Mg–Al–H samples presented a block-type shape. Mg–Al–I samples presented a more “spongey” morphology. These data were in agreement with surface-area measurements because Mg–Al–I presented a relatively high Brunauer–Emmett–Teller (BET) surface.
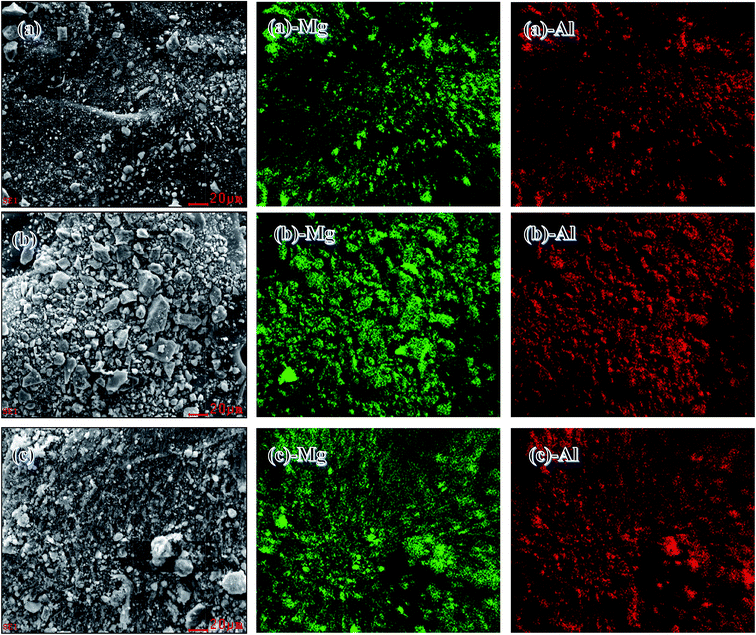
SEM with energy-dispersive X-ray analyses were used to analyze the chemical compositions and key components of the catalysts. Fig. 3(a–c) show SEM images at a scale of 20 μm. In accordance with the SEM images (a)-Mg, (a)-Al, (b)-Mg, (b)-Al, (c)-Mg and (c)-Al, two discrete phases of Mg and Al were obtained. These findings suggested that MgO and Al2O3 were distributed uniformly in all the catalysts prepared by co-precipitation, HTLcs and impregnation.
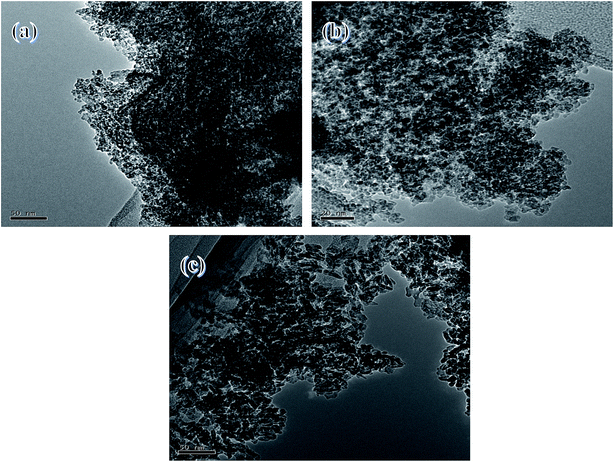
TEM images of the samples are shown in Fig. 4. Samples of Mg–Al–C and Mg–Al–H showed a dense particle distribution. However, Mg–Al–I catalysts were distributed loosely. Similarly, TEM images of the samples were also in agreement with surface-area measurements.
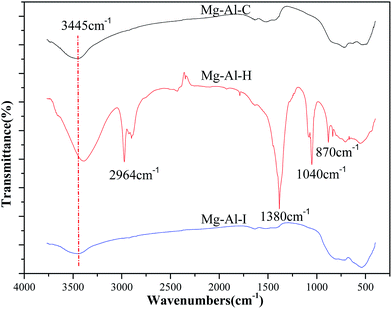
FTIR spectra showed a shared absorption band around 3445 cm−1 that was attributed to OH stretching vibrations (Fig. 5). Bands at 1040 cm−1 and 2964 cm−1 were due to a C–H symmetric stretching vibration. The band at 1380 cm−1 was attributed to CO3–OH.28 These findings illustrated the many types of groups on the surface of the Mg–Al–H sample, which determined different properties compared with the other samples.
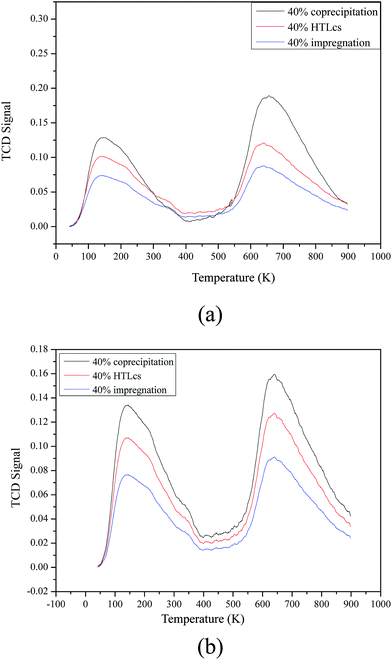
Acidic properties of Mg–Al–C, Mg–Al–H and Mg–Al–I catalysts were investigated by NH3-TPD. The results are presented in Fig. 6(a) and the relative contents obtained by integration of the peak areas are given in Table 2. NH3-TPD profiles on all samples showed two intense peaks at around 423 K and 923 K, which showed sites of weak and strong acids, respectively. The amount of NH3 desorbed on sites of weak and strong acids of Mg–Al–C was much higher than that on the other two samples.
| Preparation method | WASa (mmol g−1) | SASa (mmol g−1) | TASb (mmol g−1) | WBSc (mmol g−1) | SBSc (mmol g−1) | TBSd (mmol g−1) |
|---|---|---|---|---|---|---|
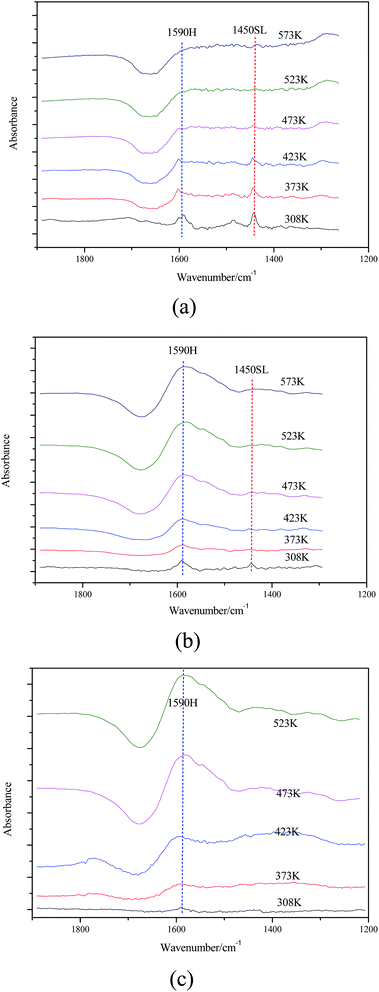
| a Contents of weak acid sites (WAS) and strong acid sites (SAS) obtained by integration of the calibrated peak areas.b Total contents of acid sites (TAS).c Contents of weak basic sites (WBS) and strong basic sites (SBS) obtained by integration of the calibrated peak areas.d Total contents of basic sites (TBS). The nature of the acidic sites was explored by infrared spectroscopy of the adsorbed pyridine (Fig. 7). For Mg–Al–C and Mg–Al–I samples, two main bands observed at 1590 cm−1 and 1450 cm−1 are were to H-bonded pyridine and pyridine adsorbed on sites of a Lewis acid, respectively. Such peaks were not observed in Mg–Al–H samples except for the H-bonded pyridine peaks (1590 cm−1). However, the band at 1450 cm−1 corresponding to a protonated pyridine was not detected in any of the samples studied. These results suggest that Mg–Al–C and Mg–Al–I samples had sites of a Lewis acid and that there were no sites of a Brönsted acid in any of the samples. | ||||||
| Co-precipitation | 5.69 | 7.42 | 13.11 | 4.93 | 6.09 | 11.02 |
| HTLcs | 3.92 | 4.19 | 8.11 | 4.27 | 4.67 | 8.94 |
| Impregnation | 2.34 | 2.15 | 4.49 | 2.28 | 2.38 | 4.66 |
Basic properties of the catalysts were studied by CO2-TPD (Fig. 6(b)). Two peaks of all three samples appear at around 423 K and 923 K, respectively. The peak at the low temperature corresponded to sites of weak bases and the high temperature peak was attributed to sites of strong bases. The Mg–Al–C sample had relatively more sites of weak bases and there were more sites of strong bases on the surface of the Mg–Al–H sample, as shown by a typical sodium peak in the XRD patterns.
In summary, the investigation into the acid–base properties of Mg–Al–C, Mg–Al–H and Mg–Al–I samples suggested that Mg–Al–C catalysts contained a higher number of sites for weak acids and weak bases than for the other samples.
3.2 Catalytic test for 1,3-butadiene production from ethanol
To understand the process of ethanol conversion to BD more deeply, the ethanol-impulse response was carried out in the evaluated parameters of the Mg–Al catalyst using Mg–Al–C as an example. The product distributions are shown in Fig. 8. The products of the ethanol reaction on the Mg–Al–C catalyst were BD, ethylene, ether, acetaldehyde, 1-butene and 1-butanol. Then, we could speculate on the process of ethanol on the Mg–Al–C catalyst. That is: ethylene and ether were formed from ethanol through dehydration; ethanol was dehydrogenated to acetaldehyde; acetaldehyde underwent an aldol condensation with ethanol to form an acetaldol; through dehydration and a MPV-type reduction to generate BD, 1-butene arose from the growth of carbon chains and dehydrogenation. Butanol was obtained from crotyl alcohol-selective hydrogenation of the unsaturated carbon–carbon double bonds.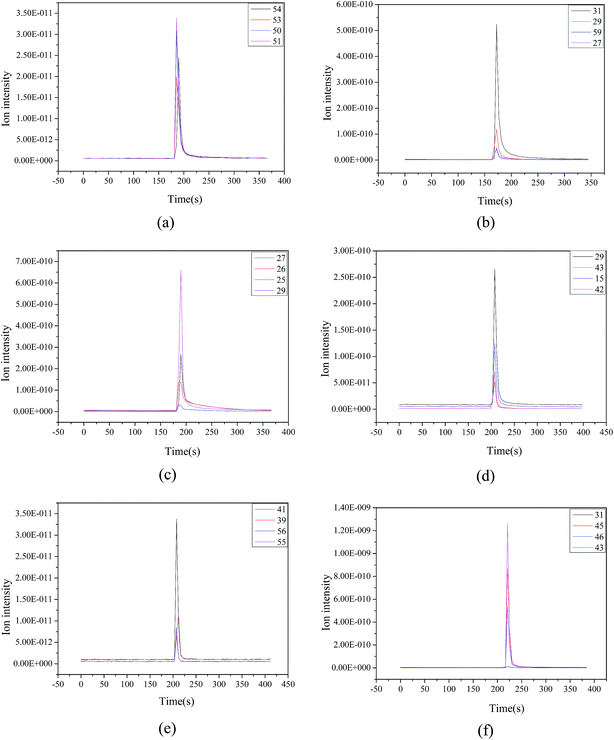 | ||
| Fig. 8 Products of the ethanol reaction on Mg–Al–C catalyst (a) BD, (b) ethylene, (c) ether, (d) acetaldehyde, (e) 1-butene and (f) 1-butanol. | ||
The ethanol conversions and distribution of products are listed in Table 3. Conversions of ethanol on Mg–Al–C and Mg–Al–H were 41.36% and 49.00%, respectively. Ethanol transformation on Mg–Al–I was relatively poor (27.05%) and was probably due to fewer active sites on the surface of Mg–Al–I catalysts.
| Preparation method | Feed rate/h−1 | Conv./% | Selectivity/% | ||||||
|---|---|---|---|---|---|---|---|---|---|
| BD | Ethylene | Ether | Acetaldehyde | 1-Butene | 1-Butanol | Others* | |||
| Co-precipitation | 1.8 | 41.36 | 17.94 | 41.18 | 15.85 | 6.92 | 3.10 | 13.39 | 1.62 |
| HTLcs | 1.8 | 49.00 | 15.63 | 40.17 | 26.97 | 6.31 | 0.52 | 9.00 | 1.40 |
| Impregnation | 1.8 | 27.05 | 16.23 | 35.54 | 22.35 | 9.26 | 0 | 14.93 | 1.69 |
The reaction products were mainly BD, ethylene, ether, acetaldehyde, 1-butene and 1-butanol. The products dehydrated from ethanol on sites of strong acids (e.g., ethylene) took up a large proportion. Acetaldehyde dehydrogenated from ethanol on sites of strong bases was also produced. Selectivity of BD on Mg–Al–C, Mg–Al–H and Mg–Al–I catalysts were 17.94%, 15.63% and 16.23%, respectively, which suggested fewer acidic–basic sites suitable for BD formation from ethanol on the surface of Mg–Al catalysts.
Based on the acid–base properties of Mg–Al–C, Mg–Al–H and Mg–Al–I samples, we could draw three main conclusions. First, the sites of strong based and strong acids in Mg–Al catalytic systems possibly exerted negative effects. Second, the ethanol reactions of dehydration and dehydrogenation were carried out mainly on sites of strong acids and strong bases. Finally, to obtain higher BD selectivity, modifiers used to adjust the acid–base balance must be adopted in Mg–Al catalysts.
4. Conclusions
Production of BD and other bulk chemicals from ethanol over Mg–Al catalysts using different preparation methods was investigated. All types of catalysts tested obeyed the same mechanistic pathways and showed an identical set of products. The reaction products were mainly BD, ethylene, ether, acetaldehyde, 1-butene and 1-butanol.The characterization and analyses of samples suggested that preparation methods had an impact on the surface structure and chemical nature of the catalysts. Mg–Al–C and Mg–Al–H catalysts prepared by precipitation methods exhibited almost identical surface areas. However, the Mg–Al–I sample retained many more properties of the carrier with a relatively high specific area. Mg–Al–C samples had relatively more sites of weak acids and weak bases than the other samples. Moreover, Mg–Al–C and Mg–Al–I samples had sites for a Lewis acid but there were no sites for a Brönsted acid in any samples.
Sites for moderately strong acids and bases could enable formation of BD. Dehydration and dehydrogenation of ethanol to ethylene was carried out mainly on the sites for strong acids and strong bases. To obtain higher product selectivity, the ratios of MgO and Al2O3 must be examined and modifiers used to adjust the acid–base balance must be adopted in Mg–Al catalysts.
References
- R. Bhatt, D. Shah, K. C. Patel and U. Trivedi, Biotechnol. Bioeng., 2008, 99, 4615–4620 CAS.
- E. V. Makshina, M. Dusselier, W. Janssens, J. Degrève, P. A. Jacobs and B. F. Sels, Chem. Soc. Rev., 2014, 43, 7917–7953 RSC.
- W. C. White, Chem. Boil. Interact., 2007, 166, 10–14 CrossRef CAS PubMed.
- Y. Sun and J. Y. Cheng, Biotechnol. Bioeng., 2002, 83, 1–11 CAS.
- J. O. Alves, C. Zhuo, Y. A. Levendis and J. A. Tenório, Appl. Catal., B, 2011, 106, 433–444 CrossRef CAS.
- R. O. de Souza, L. S. Miranda and R. Luque, Green Chem., 2014, 16, 2386–2405 RSC.
- K. D. Maher and D. C. Bressler, Biotechnol. Bioeng., 2007, 98, 2351–2368 CAS.
- K. A. Gray, L. S. Zhao and M. Emptage, Current Opinion in Chemical Biology, 2006, 10, 141–146 CrossRef CAS PubMed.
- P. Alvira, E. Tomas-Pejo, M. Ballesteros and M. Negro, Bioresour. Technol., 2010, 101, 4851–4861 CrossRef CAS PubMed.
- B. Hahn-Hagerdal, M. Galbe, M. F. Gorwa-Grauslund, G. Liden and G. Zacchi, Trends Biotechnol., 2006, 24, 549–556 CrossRef CAS PubMed.
- J. Ostromislenskiy, J. Russ. Phys.-Chem. Soc., 1915, 47, 1472–1506 Search PubMed.
- S. V. Lebedev and A. O. Yakubchik, J. Chem. Soc., 1929, 220–225 RSC.
- W. M. Quattlebaum, W. J. Toussaint and J. T. Dunn, J. Am. Chem. Soc., 1947, 69, 593–599 CrossRef CAS.
- S. K. Bhattacharyya and N. D. Ganguly, J. Appl. Chem., 1962, 12, 105–110 CrossRef CAS.
- M. Gao, M. Zhang and Y. Li, RSC Adv., 2017, 7(20), 11929–11937 RSC.
- S. Kvisle, A. Aguero and R. P. A. Sneeden, Appl. Catal., 1988, 43, 117 CrossRef CAS.
- V. V. Ordomsky, V. L. Sushkevich and I. I. Ivanova, J. Mol. Catal. A: Chem., 2010, 333, 85–93 CrossRef CAS.
- V. L. Sushkevich, I. I. Ivanova, V. V. Ordomsky and E. Taarning, ChemSusChem, 2014, 7, 2527–2536 CrossRef CAS PubMed.
- H.-J. Chae, T.-W. Kim, Y.-K. Moon, H.-K. Kim, K.-E. Jeong, C.-U. Kim and S. Y. Jeong, Appl. Catal., B, 2014, 150, 596–604 CrossRef.
- E. V. Makshina, W. Janssens, B. F. Sels and P. A. Jacobs, Catal. Today, 2012, 198, 338–344 CrossRef CAS.
- M. D. Jones, C. G. Keir, C. D. Iulio, R. A. M. Robertson, C. V. Williams and D. C. Apperley, Catal. Sci. Technol., 2011, 1, 267–272 CAS.
- M. H. Zhang, M. X. Gao, J. Y. Chen and Y. Z. Yu, RSC Adv., 2015, 5, 25959–25966 RSC.
- M. X. Gao, Z. Z. Liu, M. H. Zhang and L. Tong, Catal. Lett., 2014, 144, 2071–2079 CrossRef CAS.
- J. I. Di Cosimo, V. K. Dıez, M. Xu, E. Iglesia and C. R. Apesteguıa, J. Catal., 1998, 178, 499–510 CrossRef CAS.
- K. K. Rao, M. Gravelle, J. S. Valente and F. Figueras, J. Catal., 1998, 173, 115–121 CrossRef CAS.
- L. Hora, V. Kelbichová, O. Kikhtyanin, O. Bortnovskiy and D. Kubička, Catal. Today, 2014, 223, 138–147 CrossRef CAS.
- M. León, E. Díaz and S. Ordóñez, Catal. Today, 2014, 164, 436–442 CrossRef.
- J. T. Kloprogge, D. Wharton, L. Hickey and R. L. Frost, Am. Mineral., 2007, 87(5–6), 623–629 Search PubMed.
| This journal is © The Royal Society of Chemistry 2017 |

