 Open Access Article
Creative Commons Attribution 3.0 Unported Licence
Evaluation and optimization of a pilot-scale catalytic ozonation–persulfate oxidation integrated process for the pretreatment of dry-spun acrylic fiber wastewater†
Zong-wei Wu ,
Xiao-chen Xu*,
Hong-bin Jiang,
Ruo-yu Zhang,
Shuai-nan Song,
Chuan-qi Zhao and
Feng-lin Yang*
Key Laboratory of Industrial Ecology and Environmental Engineering, China Ministry of Education, School of Environmental Science and Technology, Dalian University of Technology, Linggong Road 2, Dalian 116024, P. R. China. E-mail: xxcep@dlut.edu.cn
First published on 12th September 2017
Abstract
An integrated process of catalytic ozonation–persulfate oxidation was developed for the pretreatment of dry-spun acrylic fiber (DAF) wastewater on a pilot scale. Box–Behnken design and response surface methodology (RSM) were used for the design and optimization of the integrated process. A second-order polynomial regression equation was established to describe the chemical oxygen demand (COD) and total nitrogen (TN) removal efficiency of the integrated process and was validated by the analysis of variance and residual techniques. The interaction effects of operational parameters were investigated using response surface analysis. Results showed that the maximum COD and TN removal efficiency of 42.36% and 28.51% were achieved for DAF wastewater when the reaction time, reaction temperature, addition of ozone and addition of persulfate were 4.44 h, 61.82 °C, 40 g h−1 and 1.3 kg t−1, respectively. Furthermore, the biodegradability of raw and treated DAF wastewater was compared, and the (BOD5)/COD (B/C) ratio increased from 0.078 to 0.315, indicating a significant biodegradability improvement. The comparison of N composition before and after the integrated process indicated that organonitrogen was converted into ammonia nitrogen, nitrate nitrogen, and nitrogen, which resulted in the removal TN. This result confirmed that the integrated process of catalytic ozonation–persulfate oxidation was effective in improving the biodegradability of DAF wastewater and was promising for pretreatment prior to biological treatment.
1. Introduction
As one of the most important types of synthetic fibers, acrylic fiber has been widely used in the production of blankets, artificial fur, and plush toys. In China, the yield of acrylic fiber is nearly 0.7 tons every year.1 Presently, wet-spun and dry-spun acrylic fiber (DAF) manufacturing technologies are the two main production processes used in China. DAF technology is widely employed owing to the product possessing high quality and versatility. However, the effluents from the DAF manufacturing process contain complex, highly toxic, and bio-refractory organic pollutants such as organic nitriles, alkanes, aromatic compounds, esters, phenols, phenols, SCN− and their oligomers.2,3 The typical concentrations of COD and ammonia nitrogen (NH4+–N) in DAF wastewater are 1000–2500 mg L−1 and 50–200 mg L−1, respectively,4 which may cause serious environmental problems if discharged directly into receiving waters without appropriate treatment.Presently, most DAF manufacturing factories have adopted traditional biological treatment or biological treatment followed by physicochemical treatment such as coagulation, neutralization, and adsorption. However, the high concentrations of polymers, inorganic salts, and other toxic compounds in DAF wastewater have strongly negative effects on these biochemical and physical procedures. The effluents after treatment, which still contain high concentrations of COD, NH4+–N, total nitrogen (TN) and toxic compounds, could not meet effluent discharge standards.5 Therefore, it is increasingly urgent to develop an effective and feasible pretreatment for DAF wastewater prior to biological treatment.
Approaches such as Fenton process,6 photo-Fenton process,7 electro-Fenton process,8 microelectrolysis,9 coagulation–flocculation, electro-coagulation,10 and even microbubble-ozonation11 have been used to decrease the amount of toxic contaminants in DAF wastewater, and to improve the biodegradability of the contaminants in subsequent treatment processes. However, there is a serious application bottle-neck due to their higher operating costs.
Catalytic ozonation has recently gained significant attention as an effective process used to improve the biodegradability and reduce the toxicity of refractory wastewater.12,13 This technique has overcome some of the limiting factors of the traditional ozonation process such as low ozone dissolution and low efficiency of ozone. The generation of hydroxyl free radicals (˙OH) from ozone can improve the oxidation effects because ˙OH possesses a higher oxidation potential (2.80 V oxidation–reduction potential, second only to fluorine) than molecular ozone. In catalytic ozonation process, refractory or toxic organic compounds can be oxidized and transformed into biodegradable small molecules or carbon dioxide and water.
As a newest oxidant, persulfate, which has greater efficiency in degrading refractory organic pollutants and fewer adverse impact on water quality than conventional chemical oxidation processes, has gained increasing attentions in recent years.14–16 Stable at room temperature, persulfate can be activated via heat, transition metals, ultraviolet (UV) light, or other means, forming the highly reactive sulfate radical (˙SO4−).17,18 The sulfate radical exhibits a higher standard redox potential ( = 2.5–3.1 V vs. SHE) than the hydroxyl radical at neutral pH, which makes the sulfate radical superior in mineralizing numerous organic compounds.19 The sulfate radical is also more efficient than the hydroxyl radical for degradation of many organic compounds, since it is more selective for oxidation by electron-transfer reaction. Furthermore, the sulfate radical exhibits high oxidation efficiencies in both carbonate and phosphate buffer solutions.20 Recent studies have demonstrated the ability of surface radicals for simultaneous removal of refractory organic contaminants and ammonia in landfill leachate.21 However, there are few studies on the treatment of DAF wastewater using this process.
Based on this, in this study, an integrated process of catalytic ozonation–persulfate oxidation was investigated for DAF wastewater pretreatment in pilot scale. The reactor parameters, including reaction time, reaction temperature, the addition of ozone and the addition of persulfate, were optimized by Box–Behnken design and response surface methodology (RSM), and then the removal rates of the contaminants were investigated under the optimized treatment conditions. The biodegradability the biodegradability of raw and treated DAF wastewater were also evaluated. Moreover, the composition of N before and after the integrated process was also analyzed to interpret the mechanism of TN removal.
2. Materials and methods
2.1. The pilot-scale reaction tower
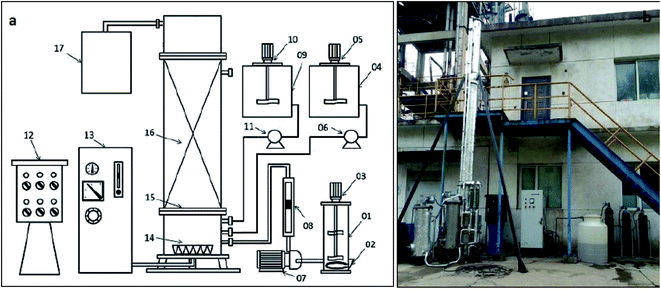
The component and photo of pilot-scale reaction tower are shown in Fig. 1a and b. Oxidation tower coated insulation cotton was made of stainless steel with an effective volume of 180 L, and the available water depth was 6.00 m. The 120 L catalysts (home-made product) were filled into oxidation tower, and the volume of catalytic ozonation was also 120 L. Ozone was generated from pure dry oxygen using an ozonator (100 g h−1, Goulin Technology Co. Ltd, China) at concentrations of 100.0–120.0 mg L−1. The addition of ozone was controlled by the flow rate of oxygen and power of ozonator. The ozone was fed into the reactor at through a micro-porous gaseous plate located at the base of the oxidization tower. The remaining ozone gas discharged from the top of oxidation tower was collected by a trap containing 4.0% potassium iodide solution. The DAF wastewater (at 60–70 °C) from workshop was stored in regulating reservoir with heater and adjusted to the appropriate temperature. Persulfate (20%) solution was stored in dosing tank 4, and was pumped into oxidation tower according to a certain amount. Persulfate was activated via heat come from DAF wastewater. Alkali solution was stored in dosing tank 9, and was automatically added into oxidation tower to control the reaction pH in the range of 6.5–6.8.2.2. Wastewater
The influent of the pilot experiment was DAF wastewater from DAF manufacturing factory located in Liaoning Province, China. The typical water quality with great fluctuation of this effluent was listed in Table 1. NO2−–N and NO3−–N were not detected in the influent.| Parameter | COD | BOD5 | TN | NH4+–N | Organonitrogen | pH | Temperature |
| Unit | mg L−1 | mg L−1 | mg L−1 | mg L−1 | mg L−1 | °C | |
| Range | 1679–2377 | 152–176 | 417–480 | 33.0–76.8 | 380–470 | 6.0–8.0 | 60–70 |
| Average | 2056 | 162 | 452 | 57.8 | 394 | 6.9 | 67 |
2.3. Analytical methods
The influent and effluent samples were collected on a daily basis and were analyzed immediately. The determinations of TN, NH4+–N, NO2−–N, NO3–N, BOD5 and COD were carried out following the water and wastewater monitoring and analysis method (4th edition).22 In addition, organonitrogen was achieved according to mathematical calculation. The value of pH was measured using a digital pH meter (Multi 340i, WTW Company, Germany).2.4. Experiment design
A Box–Behnken design23 was used to optimize the integrated process of catalytic ozonation–persulfate oxidation. Reaction time, reaction temperature, the addition of ozone and the addition of persulfate were chosen as four key control parameters in order to estimate the influence of operational parameters on COD and TN removal efficiency and obtain the maximal COD and TN removal. Reaction time, reaction temperature, the addition of ozone and the addition of persulfate were termed as X1, X2, X3 and X4, respectively. The minimum and maximum ranges of variables were investigated and the full experimental plan with respect to their values is listed in Table 2, considered running cost. The coded values of the four independent variables together with the responses are shown in Table S1.† An empirical second-order polynomial model for four factors was in the following form:
 | (1) |
| Variables | Coded | Ranges and levels | ||
|---|---|---|---|---|
| −1 | 0 | 1 | ||
| Reaction time (h) | X1 | 4 | 5 | 6 |
| Reaction temperature (°C) | X2 | 50 | 60 | 70 |
| The addition of ozone (g h−1) | X3 | 20 | 30 | 40 |
| The addition of persulfate (kg t−1) | X4 | 0.5 | 0.9 | 1.3 |
3. Results and discussion
3.1. Experimental model
The four-factor experimental design and the removal of COD and TN are shown in Table S1.† A second-order polynomial equation (eqn (2) and (3)) was used to express the relationship between the COD and TN removal response and operational variables.| Y1 = −26.23203 + 1.78958X1 + 1.10042X2 + 0.23958X3 + 1.68229X4 − 0.025X1X2 + 2.5 × 10−3X1X3 − 0.31250X1X4 − 5 × 10−4X2X3 + 0.06250X2X4 − 0.08750X3X4 + 0.083333X12 − 8.91667 × 10−3X22 + 1.20833 × 10−3X32 + 0.13021X42 | (2) |
| Y1 = −105.20156 + 0.83125X1 + 2.79271X2 + 2.00333X3 + 9.63542X4 − 7.5 × 10−3X1X2 − 0.07X1X3 − 1.31250X1X4 − 0.012250X2X3 + 0.081250X2X4 + 0.10X3X4 + 0.37500X12 − 0.019625X22 − 0.013375X32 − 3.28125X42 | (3) |
Statistical testing of the model was performed with the Fisher's statistical test for analysis of variance (ANOVA). The results of ANOVA for COD and TN removal efficiency are depicted in Tables S2 and S3.† The model F value of 160.74 and 198.08 implied that the models were significant for the COD and TN removal efficiency; indeed, there were only a 0.01% chance that these large model F value could occur due to noise. For the removal of COD, the F values for reaction time, reaction temperature, the addition of ozone and the addition of persulfate were 280.93, 95.10, 1557.44 and 117.04, respectively, which implied that the influence of the addition of ozone on the integrated process of catalytic ozonation–persulfate oxidation of DAF manufacturing wastewater was the most significant, followed by reaction time, the addition of persulfate and reaction temperature, orderly. For the removal of TN, the order was the addition of ozone, the addition of persulfate, reaction temperature and reaction time; therefore, the addition of persulfate played an important role in the removal of TN.
The probability value (P value) was equivalent to the proportion of the area under the curve of the F-distribution that lies beyond the observed F value.25 A smaller P value indicates a higher significance of the corresponding coefficient. A P value > 0.10 indicates that the model term was insignificant.26 As shown in the Table S2,† the P value < 0.0001 for the regression model of the removal of COD indicated that the quadratic model was highly significant and adequate for representing the actual relationship between the response and the variables. Furthermore, the individual variables effects (X1, X2, X3 and X4) and interaction terms (X1X2, X2X4, X3X4 and X22) were significant terms (P < 0.10) and had significant effects on the removal efficiency of COD. For the removal of TN (Table S3†), X1, X2, X3, X4, X1X3, X1X4, X2X3, X2X4, X12, X22, X32 and X42 were significant.
The correlation between the experimental data and the predicted values is evaluated by the coefficient of determination (R2). The experimental results and model predictions (eqn (2) and (3)) are shown in Table 3. The obtained R2 value of 0.9938 and 0.9950 indicated that only 0.62% and 0.5% of the total variations were not explained by the model in the removal of COD and TN. This high R2 value suggested that the regression models could well estimate the COD and TN removal response in the studied range. The adjusted determination coefficient (adj R-squared) was 0.9876 and 0.990, showing the high significance of the model. The “Pre R-squared” of 0.9644 and 0.9711 was close to “Adj R-squared”. Adequate precision was a signal to noise ratio and compared the range of the predicted values at the design points to the average prediction error.
| Parameter | COD | BOD5 | TN | NH4+–N | Organonitrogen | NO3−–N | The removal of COD | The removal of TN |
| Unit | mg L−1 | mg L−1 | mg L−1 | mg L−1 | mg L−1 | mg L−1 | % | % |
| Raw water 1 | 1985 | 157 | 454 | 57.6 | 396.4 | — | 42.25 | 28.60 |
| Effluent 1 | 1146 | 368 | 324.2 | 68.8 | 152.8 | 29.8 | ||
| Raw water 2 | 2164 | 168 | 471 | 61.2 | 409.8 | — | 42.45 | 28.44 |
| Effluent 2 | 1245 | 386 | 337 | 73.2 | 154 | 30.3 | ||
| Raw water 3 | 2097 | 160 | 461 | 58.5 | 402.5 | — | 42.38 | 28.49 |
| Effluent 3 | 1208 | 382 | 329.7 | 69.2 | 153.1 | 29.9 | ||
| Average of raw water | 2082 | 162 | 462 | 59.1 | 402.9 | — | 42.36 | 28.51 |
| Average of effluent | 1200 | 379 | 330.3 | 70.4 | 153.3 | 30.0 |
Fig. 2a and b are the plot of the predicted values vs. the experimental values of COD and TN removal response. The predicted values calculated using the second-order model were in good agreement with the experimental values, which indicated that there was a satisfactory correlation between the predicted values and the experimental values.
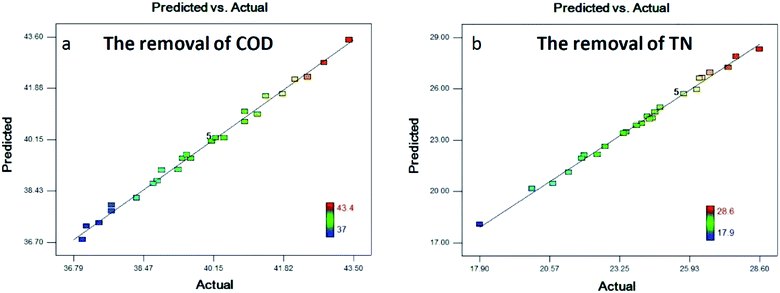 | ||
| Fig. 2 Predicted vs. experimental values of COD (a) and TN (b) removal efficiencies of DAF wastewater. | ||
The reaction residual was another important indicator for evaluating the adequacy of the model in addition to the regression coefficient. The residuals were essentially elements of the variation unexplained by the fitted model and should conform to a normal distribution.27 Fig. S1a and b† are the normal probability plot of the residuals for the removal of COD and TN, which roughly follow a straight line, reveal reasonably well-behaved residuals from the trends. Fig. S1c and d† show the residuals vs. the predicted values for the removal of COD and TN. According to the plots, the residuals appeared to be randomly scattered around zero. Fig. S1e and f† show the residuals in the order of the corresponding observations. Based on the plots, the residuals fluctuated randomly around the center line. All the results above indicated the second-order model could be used to optimize and estimate the removal COD and TN for DAF production wastewater.
3.2. Response surface analysis
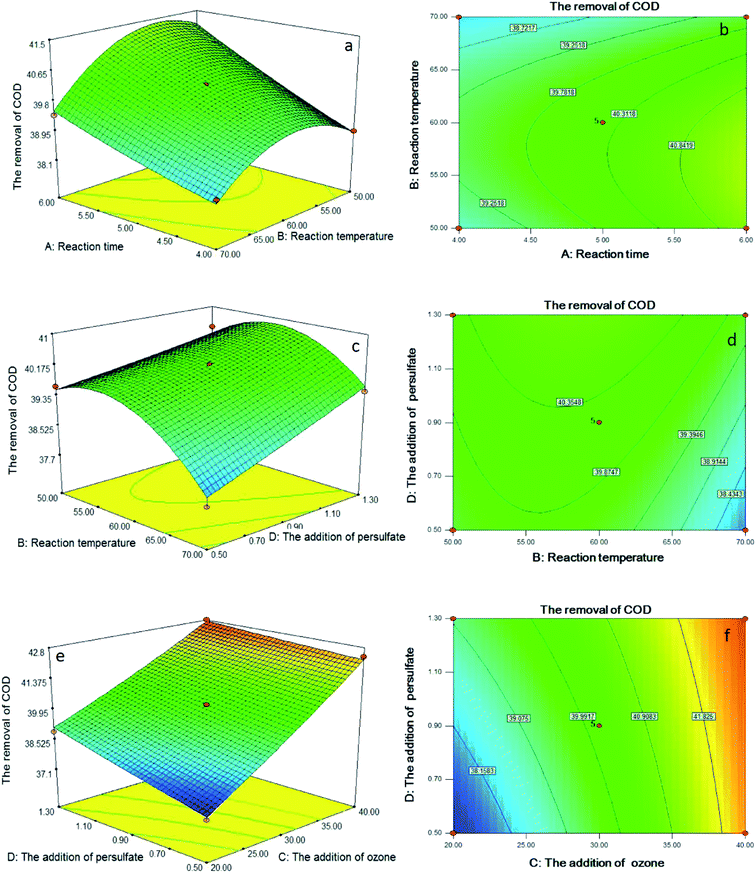
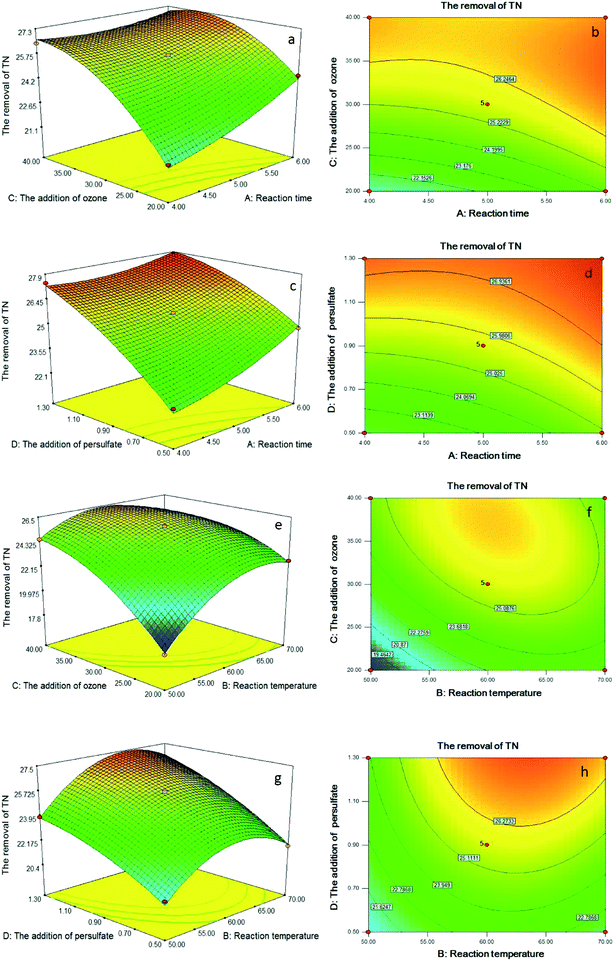
To aid visualization and identify the type of interactions between the test variables, the response surface plots and contour plots for the removal of COD and TN are shown in Fig. 3 and 4. According to the results before, interaction terms of X1X2, X2X4 and X3X4 had a significant influence on the removal efficiency of COD. As shown in Fig. 3a–d, the COD removal efficiency significantly increased when reaction temperature increased from 50 °C to approximately 60 °C. However, COD removal decreased when further increased reaction temperature from 60 °C to 70 °C. This phenomenon may be caused by the quenching time of the high active ˙OH shortened with the increase of reaction temperature, which reduced the degradation efficiency of pollutants. According to Fig. 3e and f, the removal of COD was the result of the combination of ozone and persulfate. The increase of ozone or persulfate all could promote COD removal, however, the influence of ozone was more obvious than that of persulfate.With regard to the TN removal, X1X3, X1X4, X2X3 and X2X4 were significant, and the response surface plots and contour plots of them are given in Fig. 4. According to Fig. 4a–d, prolonged reaction time, or increased the addition of ozone or persulfate all could enhance the TN removal efficiency increased under studied range. The probable reason for this behavior was that the generation of ˙OH and ˙SO4− had been promoted by the increase of the addition of ozone or persulfate, which enhanced the oxidation capability of the integrated process, thereby promoting the TN removal efficiency. As shown in Fig. 4e and f, increased reaction temperature led to a rapid increase in the TN removal efficiency, and then slowed nearer the maximum efficiency at approximately 63 °C. Fig. 4g and h show that 60 °C is the optimum reaction temperature for the persulfate oxidation, with lower or higher temperature having a negative effect on TN removal. It may be the reason that persulfate could not be absolutely activated at lower temperature and decomposed at higher temperature.
3.3. Determination of optimum conditions
The main objective of the optimization was used to determine the optimum values of variables of an integrated process of catalytic ozonation–persulfate oxidation based on the obtained model. The desired goal in terms of COD and TN removal efficiency was defined as “maximize” to achieve the maximum treatment efficiency. Priority to the maximum TN removal efficiency and taken into account both investment cost and operation cost, the optimum values of the variables were as follows: 4.44 h reaction time, 61.8 °C reaction temperature, 40 g h−1 ozone and 1.3 kg t−1 persulfate. According to the prediction of the polynomial quadratic equation model, the COD removal efficiency was 42.24 and the TN removal was 28.6% under the optimum reaction conditions. To confirm the model adequacy for predicting the maximum removal efficiency of COD and TN, three parallel experiments under this optimum operation condition were performed with DAF wastewater. As seen in Table 3, the average removal efficiency of COD was ca. 42.36%, while the average removal efficiency of TN in the three replicate experiments was 28.51%. The good conformity between the predicted and experimental results verified the validity of the model and reflected the existence of an optimal point.3.4. Biodegradability and the mechanism of TN removal
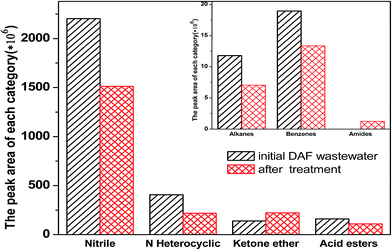
As seen in Table S1,† the BOD5/COD (B/C) ratio of raw DAF wastewater was 0.078, which indicated that DAF wastewater was clearly refractory and difficult to biodegrade using biological treatment. After treated by the integrated process of catalytic ozonation–persulfate oxidation, the B/C ratio of DAF wastewater increased from 0.078 to 0.315 under the optimum conditions, indicating a high biodegradability of the treated wastewater.To further investigate the biodegradability and gain some insight into the degradation process, the GC-MS was also employed to detect the composition of the initial DAF wastewater and after catalytic ozonation–persulfate oxidation treatment. The GC peaks of compounds in the wastewater were shown in Fig. S2 and S3† and it was clearly observed significant differences before and after catalytic ozonation–persulfate oxidation treatment. About 46 compounds in the initial DAF wastewater and 48 compounds in the treatment wastewater had been detected and listed in the Tables S4 and S5.† In order to give more detail about biodegradability and mechanism of TN removal, the compounds in the wastewater were classified into several categories and summarized according to the peak areas fitting. As can be seen from Fig. 5, it was clearly observed that all the categories of the compounds except the ketone ether decreased more than 30% after treatment. The reason may be that ˙OH and ˙SO4− were not selective during the degradation of organic matters,28,29 the nitrile compounds and nitrogen heterocyclic compounds, which were the most toxic and difficult to biodegrade, decreased significantly after catalytic ozonation–persulfate oxidation treatment. On the contrary, ketone ether used as a source of organic carbon increased after treatment. The results could be further confirmed that the integrated process of catalytic ozonation–persulfate oxidation was effective in improving the biodegradability of DAF wastewater and was promising as pretreatment prior to biological treatment.
In this study, the composition of N before and after the integrated process of catalytic ozonation–persulfate oxidation was also investigated to interpret the mechanism of TN removal, which is shown in Tables S2, S3† and Fig. 6. According to Fig. 6a, there is 87.2% organonitrogen and 12.8% NH4+–N in the raw DAW wastewater. Fig. 6b shown that treated by integrated process, the ratio of organonitrogen was a dramatic decline to 46.4%, and the ratio of NH4+–N had a slight increase to 21.3%. Meanwhile nitrate nitrogen and nitrogen appeared and the ratio was 9.1% and 23.2%, respectively. The change of nitrogen existing forms indicated that organonitrogen was converted into ammonia nitrogen, nitrate nitrogen, and nitrogen. The possible degradation pathway of TN in the DAF wastewater was proposed. The nitrogen heterocyclic compounds which were main source of TH, were oxidized firstly to small molecule amino compounds by oxidant such as ozone, ˙OH and ˙SO4−. With following further degradation and mineralization, the amino would be release into the solution, which leaded to the formation of ammonia nitrogen and nitrate nitrogen. In the next step, ozone and ˙OH played a very important role in the transformation of ammonia nitrogen to nitrogen, which resulted in the removal TN. The results closely agreed with the literatures.30–33
| 2NH4+ + O3 → N2 + 3H2O+ 3O2 + 2H+ | (4) |
| NH4+ + 4O3 → NO3− + H2O + 4O2 + 2H+ | (5) |
| NH4+ ↔ NH3(aq) + H+ | (6) |
| NH3(aq) + 4OH˙ → NO3− + H2O + 5H+ | (7) |
| 2NH3(aq) + 6OH˙ → N2 + 6H2O | (8) |
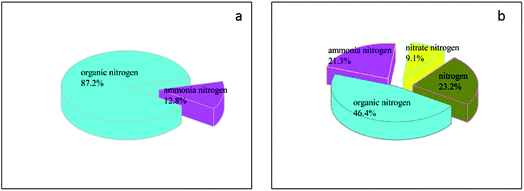 | ||
| Fig. 6 The composition of N before (a) and after (b) the integrated process of catalytic ozonation–persulfate oxidation. | ||
4. Conclusion
In this study, an integrated process of catalytic ozonation–persulfate oxidation was used for the pretreatment of DAF wastewater. Box–Behnken design and RSM were employed for the optimization and analysis of the integrated process. The following conclusions could be drawn:(1) The second-order response surface model was valid and adequate for predicting COD and TN removal efficiency of DAF wastewater with four independent variables: reaction time, reaction temperature, the addition of ozone and the addition of persulfate.
(2) ANOVA yielded a high coefficient of determination, ensuring a satisfactory adjustment of the second-order regression model with the experimental data.
(3) The effect of the experimental parameters on the COD and TN removal efficiency was established by the response surface plots. The optimum values of the variables for the maximum COD removal (42.36%) and TN removal (28.51%) developed by the response surface model were found as follows: 4.44 h reaction time, 61.8 °C reaction temperature, 40 g h−1 ozone and 1.3 kg t−1 persulfate.
(4) After the treatment under the optimum conditions, the B/C ratio increased from 0.078 to 0.315, indicating a significant biodegradability improvement.
(5) The comparison of N composition before and after the integrated process confirmed organonitrogen was converted into ammonia nitrogen, nitrate nitrogen, and nitrogen, which resulted in the removal TN.
Conflicts of interest
There are no conflicts to declare.Acknowledgements
This work was financially supported by the National Key Scientific and Technological Project for Water Pollution Control and Management (2012ZX07202-002), and the Key Laboratory of Industrial Ecology and Environmental Engineering, China Ministry of Education (KLIEEE-15-06).References
- T. Zheng, Q. Wang, Z. Shi, Y. Fang, S. Shi, J. Wang and C. Wu, J. Environ. Sci., 2016, 50, 21–31 CrossRef PubMed.
- C. Zhang, J. Wang, H. Zhou, D. Fu and Z. Gu, Chem. Eng. J., 2010, 161, 93–98 CrossRef CAS.
- T. Zheng, T. Zhang, Q. Wang, Y. Tian, Z. Shi, N. Smale and B. Xu, RSC Adv., 2015, 5, 77601–77609 RSC.
- P. An, X. Xu, F. Yang, L. Liu and S. Liu, Chem. Eng. J., 2013, 222, 32–40 CrossRef CAS.
- C. C. Yang, Z. Y. Tian, Y. H. Song, R. T. Cui, H. Yang and G. L. Qiu, Res. J. Environ. Sci., 2010, 23, 912–917 CAS.
- J. Wei, Y. Song, X. Meng and J. Pic, Desalin. Water Treat., 2015, 56, 3036–3043 Search PubMed.
- Y. H. Shin, H. S. Lee, Y. H. Lee, J. Kim, J. D. Kim and Y. W. Lee, J. Hazard. Mater., 2009, 167, 824–829 CrossRef CAS PubMed.
- M. Sun, F. Chen, J. Qu, H. Liu and R. Liu, Chem. Eng. J., 2015, 269, 399–407 CrossRef CAS.
- B. Lai, Y. Zhou, H. Qin, C. Wu, C. Pang, Y. Lian and J. Xu, Chem. Eng. J., 2012, 179, 1–7 CrossRef CAS.
- C. Gong, Z. Zhang, H. Li, D. Li, B. Wu and Y. Sun, J. Hazard. Mater., 2014, 274, 465–472 CrossRef CAS PubMed.
- T. Zheng, Q. Wang, T. Zhang, Z. Shi, Y. Tian, S. Shi, N. Smale and J. Wang, J. Hazard. Mater., 2015, 287, 412–420 CrossRef CAS PubMed.
- J. Nawrocki and B. Kasprzyk-Hordern, Appl. Catal., B, 2010, 99, 27–42 CrossRef CAS.
- J. Nawrocki, Appl. Catal., B, 2013, 142–143, 465–471 CrossRef CAS.
- S. Muhammad, E. Saputra, H. Sun, J. d. C. Izidoro, D. A. Fungaro, H. M. Ang, M. O. Tadé and S. Wang, RSC Adv., 2012, 2, 5645–5650 RSC.
- Y.-H. Guan, J. Ma, Y.-M. Ren, Y.-L. Liu, J.-Y. Xiao, L.-Q. Lin and C. Zhang, Water Res., 2013, 47, 5431–5438 CrossRef CAS PubMed.
- T. Zhang, H. Zhu and J.-P. Croué, Environ. Sci. Technol., 2013, 47, 2784–2791 CrossRef CAS PubMed.
- B. T. Zhang, Y. Zhang, Y. H. Teng and M. H. Fan, Environ. Sci. Technol., 2015, 45, 1756–1800 CrossRef CAS.
- X. He, S. P. Mezyk, I. Michael, D. Fatta-Kassinos and D. D. Dionysiou, J. Hazard. Mater., 2014, 279, 375–383 CrossRef CAS PubMed.
- G. P. Anipsitakis and D. D. Dionysiou, Environ. Sci. Technol., 2004, 38, 3705–3712 CrossRef CAS PubMed.
- G. P. Anipsitakis and D. D. Dionysiou, Environ. Sci. Technol., 2003, 37, 4790–4797 CrossRef CAS PubMed.
- Y. Deng and C. M. Ezyske, Water Res., 2011, 45, 6189–6194 CrossRef CAS PubMed.
- F. S. Wei, W. Q. Qi, Z. G. Sun, et al., Water and wastewater monitoring and analysis method, China Environmental Science Press, Beijing, 2002, pp. 211–284 Search PubMed.
- A. M. Amat, A. Arques, M. A. Miranda, R. Vincente and S. Seguí, Environ. Eng. Sci., 2007, 24, 790–794 CrossRef CAS.
- G. E. P. Box and D. W. Behnken, Technometrics, 1960, 2, 455–475 CrossRef.
- Y. L. Pang, A. Z. Abdullah and S. Bhatia, Chem. Eng. J., 2011, 166, 873–880 CrossRef CAS.
- B. K. Körbahti and M. A. Rauf, Chem. Eng. J., 2008, 136, 25–30 CrossRef.
- M. B. Kasiri and A. R. Khataee, Desalination, 2011, 270, 151–159 CrossRef CAS.
- S. Xing, X. Lu and X. Zhang, et al., Mechanism for catalytic ozonation of p-nitrophenol in water with titanate nanotube supported manganese oxide, RSC Adv., 2015, 5(123), 101975–101981 RSC.
- B. Kasprzyk-Hordern, M. Ziółek and J. Nawrocki, Catalytic ozonation and methods of enhancing molecular ozone reactions in water treatment, Appl. Catal., B, 2003, 46(4), 639–669 CrossRef CAS.
- L. Huang, L. Li, W. Dong, Y. Liu and H. Hou, Environ. Sci. Technol., 2008, 42, 8070–8075 CrossRef CAS PubMed.
- S. Ichikawaa, L. Mahardiania and Y. Kamiya, Catal. Today, 2014, 232, 192–197 CrossRef.
- S. Khuntia, S. K. Majumder and P. Ghosh, Removal of ammonia from water by ozone microbubbles, Ind. Eng. Chem. Res., 2012, 52(1), 318–326 CrossRef.
- B. Ruffino and M. C. Zanetti, Experimental study on the abatement of ammonia and organic carbon with ozone, Desalin. Water Treat., 2012, 37(1–3), 130–138 CrossRef CAS.
Footnote |
| † Electronic supplementary information (ESI) available. See DOI: 10.1039/c7ra03287k |
| This journal is © The Royal Society of Chemistry 2017 |

