DOI:
10.1039/C7RA03236F
(Paper)
RSC Adv., 2017,
7, 32893-32902
On the computational fluid dynamics of PEM fuel cells (PEMFCs): an investigation on mesh independence analysis
Received
19th March 2017
, Accepted 2nd June 2017
First published on 28th June 2017
Abstract
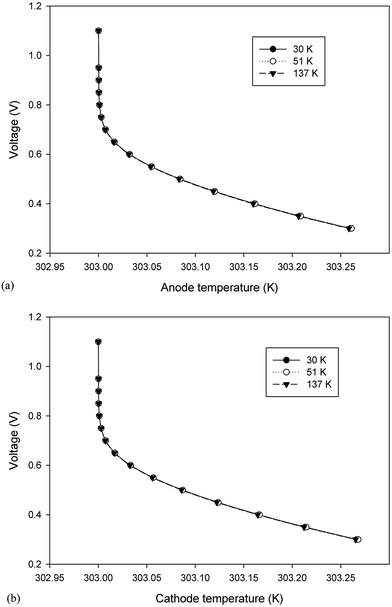
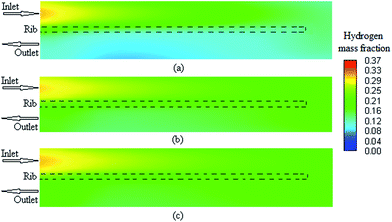
Mesh independence analysis is one of the most crucial steps in any CFD problem. The aim of this study was to investigate the most commonly used variables employed for grid independency studies in a typical PEMFC and to find possibly the most effective variables that may be decisive in a PEMFC grid independence test. Herein, a three-dimensional (3-D), steady state, non-isothermal computational fluid dynamics (CFD) model of a serpentine channel proton exchange membrane fuel cell (PEMFC) was developed. The present model includes various conservation equations that are dominant in a typical PEMFC: the mass, momentum, species, charge, and energy equations, which are coupled with the electrochemical model. The numerical results indicate that much more care should be taken while obtaining a mesh independence solution for CFD studies in PEMFC systems. Based on our findings in this study, it was demonstrated that employment of merely the polarization curve (current–voltage), especially only in a given specific point, was not sufficient to carry out the mesh independence tests for CFD studies in PEMFCs. In addition, it was observed that the average volumetric hydrogen concentration inside the catalyst layer on the anode side has a more significant role to check the grid independency tests.
1. Introduction
Mesh independence analysis is used to show that a solution is independent of the geometry grid size.1 Note that the agreement of a predicted model and the experimental results does not necessarily mean that the solution is mesh-independent.2,3 There are several understood techniques, such as adaptive mesh refinement, Richardson extrapolation, curve-fitting method, and grid convergence index, to implement mesh independence.2 Without any concern about mesh independence techniques and their advantages or disadvantages in the CFD modeling, it is important to find the modeling parameter/s to investigate this independency.
A comprehensive review of the studies on PEMFC modeling clearly reveals that despite the fact that a number of grid analyses have been performed by researchers, there is no decisive criterion that can be employed for choosing an appropriate grid. Moreover, in many studies conducted on PEMFC modeling, authors have only mentioned that the grid independence or mesh analysis has been carried out, but they do not address how they actually performed it.4–15 A general interpretation of the previous PEMFC modeling studies shows that usually, two different types of grid analyses are used for mesh independency. In the first analysis, grid analysis is performed by plotting a polarization curve for different grid sizes. Herein, first, a base grid or case for the model is estimated and then, at least, two further grids are generated by increasing and decreasing the grid size. After this, the polarization curve modeling data are obtained for each case, and in this case, there should be no significant change in the polarization curve on decreasing the grid size as compared to the base case. Moreover, the comparison should show that on increasing the grid size, significant error occurs as compared to those in the base case. The latest grid is very important to avoid unnecessary numerical calculations, especially when the computational cells are high in number, such as the modeling of cells or stacks.16–20 In this method, some researchers have investigated the change in current density for different cases in only certain specific voltages instead of considering the entire working voltage range of the fuel cell. Sivertsen and Djilali21 developed a non-isothermal, 3-D computational model for PEMFC and performed grid analysis upon creating three cases with different mesh sizes. They selected three grids different in computational cells and checked the change in the current density at a cell potential of 0.798 V. They found out that the low and medium grid cases had deviations of about 1.2% and 0.9%, respectively, for the average current density as compared to the fine grid case. Although they tried to show that grid independence was carried out in their study, they did not address why they used the largest grid count case in their simulation. Ismail et al.22 developed a 3-D model for an in-house PEMFC with serpentine channels to investigate the sensitivity of the fuel cell performance towards the anisotropic gas permeability and electrical conductivity of the gas diffusion layers. The base case in their model had approximately 100![[thin space (1/6-em)]](https://www.rsc.org/images/entities/char_2009.gif) 000 computational cells, and they created another model by increasing the control volume to 200
000 computational cells, and they created another model by increasing the control volume to 200![[thin space (1/6-em)]](https://www.rsc.org/images/entities/char_2009.gif) 000 to show the grid independence of their study. The average current density at 0.55 V was calculated for both grids, and they reported that a negligible relative error of less than 0.1% was obtained. Although they showed that their base case had enough accuracy to be used in a PEM fuel cell modeling, their grid independence study did not answer the question that whether it was possible to find a model case with less control volume as compared to that of the base case with enough accuracy. Kamarajugadda and Mazumder23,24 developed two computational fluid dynamics models of a polymer electrolyte membrane fuel cell to investigate water management within the membrane and the effect of the cathode catalyst layer structure and composition. The grid independence study was carried out in two cases. In the first case, grid independence was performed by checking the effect of the change of different grid sizes in the gas diffusion layer and catalyst layer on the polarization curve, whereas in the second case, grid independence was carried out by checking the effect of the cell numbers in the membrane on the polarization curve. Although the authors used the polarization curve for the grid independence study, these curves were based on Mazumder's research25 in which the accuracy of the numerical solution was investigated by checking the effect of change in the number of cells across the membrane layer on the water content. Jang et al.26 established a 3-D numerical model of the PEMFC to investigate the performance and transport phenomena in the PEMFCs. They created three models with different mesh sizes to study the mesh independency. They observed that there was no notable difference in the I–V curves of the fuel cell with medium and high computational cell grids; however, the difference in the I–V curves between the low and high grid was significant (the difference reported was approximately 3.9% at an operating voltage of 0.3 V).
000 to show the grid independence of their study. The average current density at 0.55 V was calculated for both grids, and they reported that a negligible relative error of less than 0.1% was obtained. Although they showed that their base case had enough accuracy to be used in a PEM fuel cell modeling, their grid independence study did not answer the question that whether it was possible to find a model case with less control volume as compared to that of the base case with enough accuracy. Kamarajugadda and Mazumder23,24 developed two computational fluid dynamics models of a polymer electrolyte membrane fuel cell to investigate water management within the membrane and the effect of the cathode catalyst layer structure and composition. The grid independence study was carried out in two cases. In the first case, grid independence was performed by checking the effect of the change of different grid sizes in the gas diffusion layer and catalyst layer on the polarization curve, whereas in the second case, grid independence was carried out by checking the effect of the cell numbers in the membrane on the polarization curve. Although the authors used the polarization curve for the grid independence study, these curves were based on Mazumder's research25 in which the accuracy of the numerical solution was investigated by checking the effect of change in the number of cells across the membrane layer on the water content. Jang et al.26 established a 3-D numerical model of the PEMFC to investigate the performance and transport phenomena in the PEMFCs. They created three models with different mesh sizes to study the mesh independency. They observed that there was no notable difference in the I–V curves of the fuel cell with medium and high computational cell grids; however, the difference in the I–V curves between the low and high grid was significant (the difference reported was approximately 3.9% at an operating voltage of 0.3 V).
In the second type of grid independence analysis in the CFD of PEMFC modeling, grid independence was performed by checking the effect of the grid size on a specific parameter of the fuel cell instead of the polarization curve. In most cases, the specific parameter was related to the properties on which the research was focused. Chen et al.27 conducted a 3-D CFD to investigate the fuel cell stack cooling design. They created five grids with different sizes for the grid independence study and checked the water temperature difference of the fuel cell coolant and cooling plate maximum temperature. They found that their model was not dependent on the grid size when the mesh number was over than 550![[thin space (1/6-em)]](https://www.rsc.org/images/entities/char_2009.gif) 000 elements. Maharudrayya et al.28 studied the pressure loss and the flow pattern of a PEMFC via a numerical simulation of the laminar flow through single and curved bend serpentine channels. To analyze the results of the grid independence, calculations for a particular case were conducted in a sharp bend with six different cross-sectional grid sizes and the effect of this difference on the pressure drop was checked. They found that a cross-section with a 20 × 12 size was independent of the grid size. Zhu et al.29 modeled the liquid water dynamic behavior appearing in the gas flow channel of a PEMFC from the gas diffusion layer. They reported that the grid independence analysis was conducted by increasing and decreasing the number of grid cells by 20 and 40%, respectively, as compared to the base case, and water droplet transport and deformation processes were observed with all three grids. Although they reported that grid dependency was carried out, they did not report any of the results for their cases.
000 elements. Maharudrayya et al.28 studied the pressure loss and the flow pattern of a PEMFC via a numerical simulation of the laminar flow through single and curved bend serpentine channels. To analyze the results of the grid independence, calculations for a particular case were conducted in a sharp bend with six different cross-sectional grid sizes and the effect of this difference on the pressure drop was checked. They found that a cross-section with a 20 × 12 size was independent of the grid size. Zhu et al.29 modeled the liquid water dynamic behavior appearing in the gas flow channel of a PEMFC from the gas diffusion layer. They reported that the grid independence analysis was conducted by increasing and decreasing the number of grid cells by 20 and 40%, respectively, as compared to the base case, and water droplet transport and deformation processes were observed with all three grids. Although they reported that grid dependency was carried out, they did not report any of the results for their cases.
Although a conclusion from the general study of recent modeling works on PEMFC and the abovementioned discussion stated that authors in many reports mentioned that their model was independent of the grid size or the number of computational cells, they did not report an exact procedure to perform this. In the other words, there is no procedure that tells us what is the best parameter(s) for checking the grid independence and what is the best range of operating voltage for checking the grid independence. Aiming to answer these two important questions in the present study, herein, a CFD model of a single channel PEMFC with serpentine flow fields was developed to investigate several key parameters in the grid independency analysis of a PEMFC.
2. Methodology
2.1. Model definition
The 3-D model presented in this research consists of all sub-components of a PEMFC: membrane, catalyst layers, gas diffusion layer, gas channels, and bipolar plates. The computational domain is a serpentine channel as shown in Fig. 1a and b. The hypothesis of this study was based on the following assumptions: (1) the fuel cell operates under steady-state and non-isothermal conditions, (2) the flow is laminar and incompressible due to the small flow pressure and velocity gradients, (3) the gas mixtures are ideal, and (4) the porous layers of the CLs and GDLs are homogeneous and isotropic. Herein, three geometries with different mesh sizes were generated. The base case had 51![[thin space (1/6-em)]](https://www.rsc.org/images/entities/char_2009.gif) 000 computational cells, and two cases were created by increasing and decreasing the grid counts to 137
000 computational cells, and two cases were created by increasing and decreasing the grid counts to 137![[thin space (1/6-em)]](https://www.rsc.org/images/entities/char_2009.gif) 000 and 30
000 and 30![[thin space (1/6-em)]](https://www.rsc.org/images/entities/char_2009.gif) 000, respectively, as compared to those of the base case.
000, respectively, as compared to those of the base case.
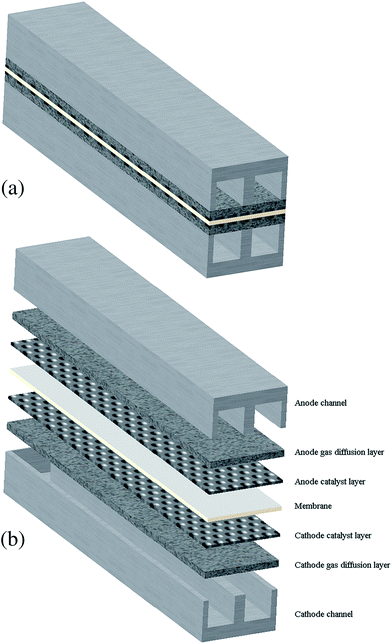 |
| | Fig. 1 A schematic of the PEM fuel cell serpentine. (a) General view and (b) exploded view. | |
2.2. Model equations
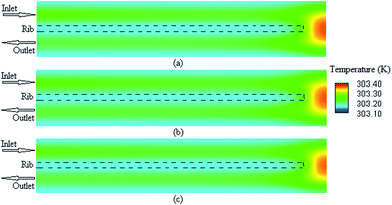
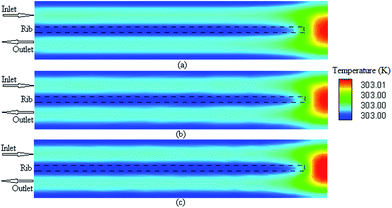
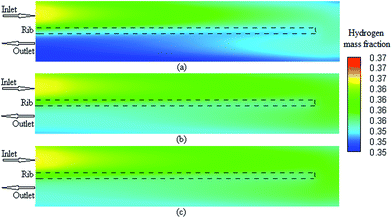
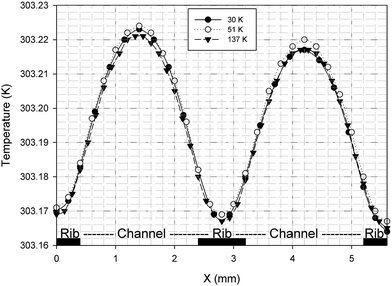
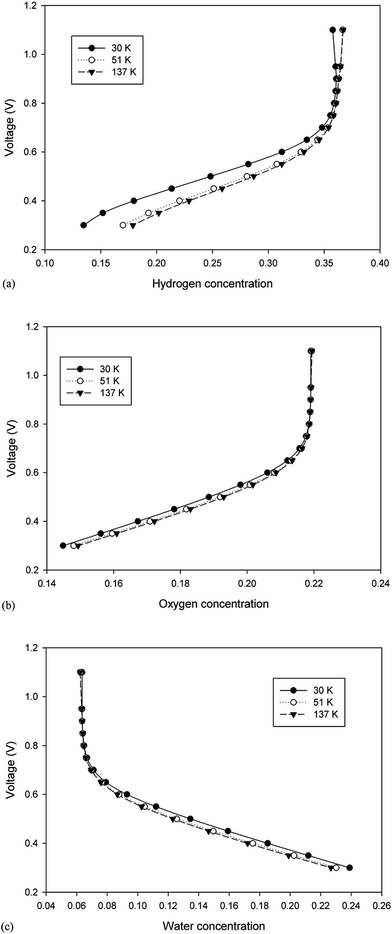
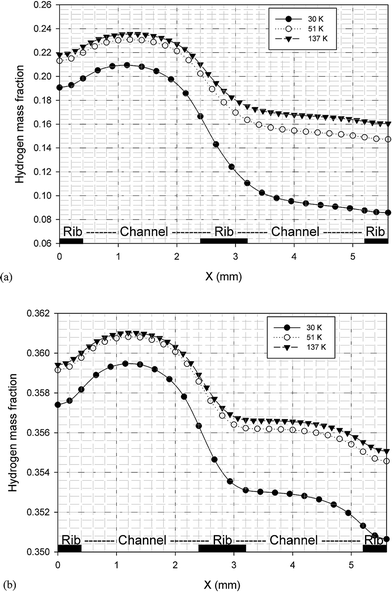
The three-dimensional model presented in this study consists of non-linear, partial differential equations representing the conservation equations of the mass, momentum, species, charges, and energy, which are fully coupled with the electrochemical reactions. The governing equations are summarized in Table 1. All the source/sink terms appearing in the generic governing equations are also presented in Table 2. Other relationships and auxiliary equations such as the electrochemistry, species diffusivities, and equilibrium dissolved water and effective properties are summarized in Table 3. All the experimental and modeling data were obtained from the literature.22 Note that the major parameters chosen to investigate the grid analysis in the PEMFC modeling were obtained from the literature.30–32 These parameters are as follows: current density, ohmic heat source at the anode and cathode, temperature at the anode and cathode, cathode transfer current, hydrogen concentration at the anode, and oxygen and water concentration at the cathode. The corresponding values for all the aforementioned parameters were obtained, checked, and reported at 15 operating voltage points in the range of 0.3–1.1 V for the three model cases with different grid sizes.
Table 1 Governing equations in a PEM fuel cell
| Governing equations |
| Type of equation |
Formula |
Equation number |
| Mass conservation |
∇(ρ![[u with combining right harpoon above (vector)]](https://www.rsc.org/images/entities/i_char_0075_20d1.gif) ) = Sm ) = Sm |
(1) |
| Momentum conservation |
∇(ρ![[u with combining right harpoon above (vector)]](https://www.rsc.org/images/entities/i_char_0075_20d1.gif) ![[u with combining right harpoon above (vector)]](https://www.rsc.org/images/entities/i_char_0075_20d1.gif) ) = −∇p + ∇(μ∇ ) = −∇p + ∇(μ∇![[u with combining right harpoon above (vector)]](https://www.rsc.org/images/entities/i_char_0075_20d1.gif) ) + Su ) + Su |
(2) |
| Species conservation |
∇(![[u with combining right harpoon above (vector)]](https://www.rsc.org/images/entities/i_char_0075_20d1.gif) Ci) = ∇(Deffi∇Ci) + Si Ci) = ∇(Deffi∇Ci) + Si |
(3) |
| Energy conservation |
∇(ρCp![[u with combining right harpoon above (vector)]](https://www.rsc.org/images/entities/i_char_0075_20d1.gif) T) = ∇(keff∇T) + ST T) = ∇(keff∇T) + ST |
(4) |
| Charge conservation |
∇(σeffm∇Φm) = −SΦ |
(5) |
| ∇(σeffs∇Φs) = SΦ |
(6) |
Table 2 Source terms in the PEM fuel cell
| Layer |
Source terms |
| Sm |
Su |
Si |
ST |
SΦ |
| Anode channel |
0 |
0 |
0 |
0 |
0 |
| AGDL |
0 |
 |
0 |
ST = σeffs(∇Φs)2 |
0 |
| ACL |
0 |
 |
 |
 |
Jan |
| PEM |
0 |
0 |
0 |
ST = σeffm(∇Φm)2 |
0 |
| CCL |
0 |
 |
 |
 |
−Jcat |
| CGDL |
0 |
 |
0 |
ST = σeffs(∇Φs)2 |
0 |
| Cathode channel |
0 |
0 |
0 |
0 |
0 |
Table 3 Axillary relations in a PEM fuel cell
| Constitutive equations |
| Type of relation |
Formula |
Equation number |
| Diffusion coefficient |
 |
(7) |
| Bruggman correlation |
Deffi = ε1.5Di, σeffi = ε1.5σi |
(8) |
| Butler–Volmer relation |
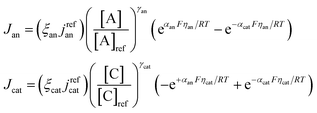 |
(9) and (10) |
| Electrical conductivity |
 |
(11) |
| Membrane water content |
 |
(12) |
| Water activity |
 |
(13) |
| Saturation pressure |
 |
(14) |
2.3. Boundary conditions
Before starting the solution construction of the equations, the boundary conditions of the fuel cell should be specified. In this study, we followed the boundary conditions that were constructed for the PEMFC simulation based on the problem specification. At the inlet of the anode and cathode gas flow channels, the inlet velocities can be calculated as follows:
At the anode side:
| |
 | (15) |
At the cathode side:
| |
 | (16) |
where
ξa and
ξc are the stoichiometric flow ratios of the anode and cathode, respectively.
Am is the actual active area of the membrane and
Ach is the cross-sectional area of the gas channel. No slip and impermeable wall (zero flux) conditions were applied to all external surfaces for the velocity and species mass fraction, respectively. In addition, on the anode bipolar terminal wall, the value of the electrical potential was set to zero, whereas on the cathode terminal wall, it was set as
Φs =
Vcell. Moreover, for the ionic potential, both on the anode and cathode terminal walls, the boundary conditions were set at zero flux.
| |
 | (17) |
2.4. Model implementation
All the abovementioned equations were discretized via the finite volume method. A commercial CFD package, FLUENT 14, was used to numerically simulate the present model. All the material properties and the governing equations source/sink terms were defined by the UDFs, which were written in C programming language and compiled in Fluent. The SIMPLE algorithm was used for the velocity and pressure coupling. The solution was considered to be converged when all the scaled residuals remained constant, less than 10−6. A PC with 2.4 GHz CPU and 4 GB RAM was also employed as the computational platform. During all the simulation runs, no obvious convergence difficulty was observed with the model used in the present study.
3. Results and discussion
3.1. Model validation
To verify the accuracy of the computational model developed in the previous section, the validation of model with the experimental measurements was carried out using the polarization curve. For this purpose, several simulations were performed at different cell potentials to generate the polarization curve (see Fig. 2). Under the given operating conditions, the modeling results were found to be in great agreement with the experimental data obtained from the literature (presented in Table 4).22
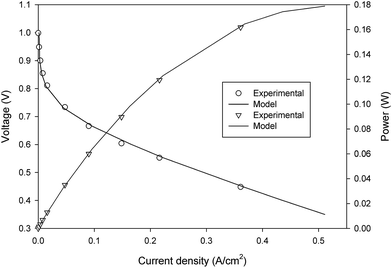 |
| | Fig. 2 A comparision between the experimental and modelling polarization curve data. | |
Table 4 Physical properties for the PEMFC22
| Property |
Value |
| Channel length |
2.8 × 10⁻² m |
| Channel height |
2 × 10⁻³ m |
| Channel width |
2 × 10⁻³ m |
| GDL thickness |
3 × 10⁻⁴ m |
| Catalyst layer thickness |
3 × 10⁻⁵ m |
| Membrane thickness |
1.5 × 10⁻⁴ m |
| Operating temperature |
303 K |
| Gauge pressure at anode/cathode |
2.5/2.5 bar |
| Catalyst layer porosity |
0.4 |
| GDL porosity |
0.7 |
| Membrane permeability |
1.8 × 10⁻¹⁸ m2 |
| Catalyst layer permeability |
1 × 10⁻¹³ m2 |
3.2. Parametric survey
3.2.1. Polarization curve. The polarization curve was used to show the performance level of the cell and could be used to compare the performance of cell in different situations.33 The characteristics of the computed polarization curve were divided into two parts: a steady component including ohmic overvoltages and the thermodynamic potential and the transient component comprising the activation and concentration overvoltage.34 Fig. 3 shows the polarization curve obtained for the three model cases with different grid sizes (30![[thin space (1/6-em)]](https://www.rsc.org/images/entities/char_2009.gif) 000, 51
000, 51![[thin space (1/6-em)]](https://www.rsc.org/images/entities/char_2009.gif) 000, and 137
000, and 137![[thin space (1/6-em)]](https://www.rsc.org/images/entities/char_2009.gif) 000 mesh count). As shown in Fig. 3, there is no significant change in the current density over a wide range of operating voltage for the different grids. Therefore, from a theoretical point of view of the grid independency, it is possible to choose the largest size of mesh (smaller mesh count) for the modeling to decrease the computational time. However, it is required to answer one question that whether there is any larger mesh size that will produce the same result in the polarization curve? Therefore, a new grid independency analysis should be performed at the larger grid size of the first survey. Herein, note that the polarization curve was used as a reference for grid independence.26
000 mesh count). As shown in Fig. 3, there is no significant change in the current density over a wide range of operating voltage for the different grids. Therefore, from a theoretical point of view of the grid independency, it is possible to choose the largest size of mesh (smaller mesh count) for the modeling to decrease the computational time. However, it is required to answer one question that whether there is any larger mesh size that will produce the same result in the polarization curve? Therefore, a new grid independency analysis should be performed at the larger grid size of the first survey. Herein, note that the polarization curve was used as a reference for grid independence.26
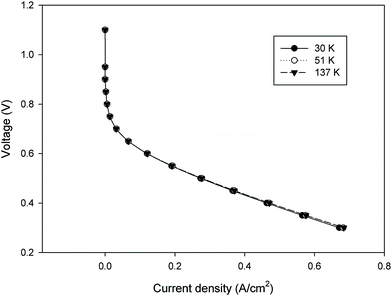 |
| | Fig. 3 The change in the polarization curve for the three model cases different in mesh sizes. | |
It is possible to investigate the current density magnitude at any special zone longitudinal or transverse. Fig. 4 and 5 illustrate the current density magnitude contours in the longitudinal plane between the catalyst and the membrane at low and high voltage, respectively. It is clear that the current density increased with the increasing mesh counts near the land area and u-bend. These figures also show that the difference in the current density for different grid sizes was very obvious in the low operating voltage. In addition, the current density magnitude reduced over the channel length. This probably happens because of the reduced hydrogen concentration along the channel. However, this behaviour was much clearer in the lower level of the operating voltage as compared to the higher level because of the high contrast in the current density magnitude at low voltage. The same results could be achieved when the current density was investigated in the transverse plane. Fig. 6a and b illustrate the current density magnitude in the transverse plane at the centre of the PEMFC between the catalyst and membrane at low and high voltages, respectively. The centre of the PEMFC was chosen to remove the inlet/outlet and u-bend effects on the results. A similar trend can be seen in all the cases for local current density distribution. The minimum current density was at the centre of the channel and increased towards the land area of the collector. The most extreme current densities were placed in the region of the edge between the rib and the flow channel.
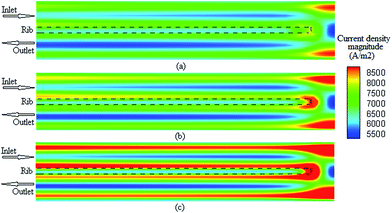 |
| | Fig. 4 The current density magnitude contours between the catalyst and membrane at 0.35 V. (a) Mesh count 30k; (b) mesh count 51k; and (c) mesh count 137k. | |
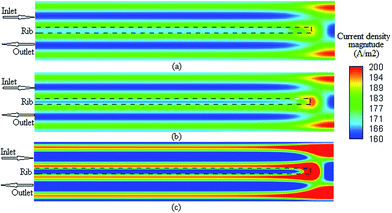 |
| | Fig. 5 The current density magnitude contours between the catalyst and membrane at 0.75 V: (a) mesh count 30k; (b) mesh count 51k; and (c) mesh count 137k. | |
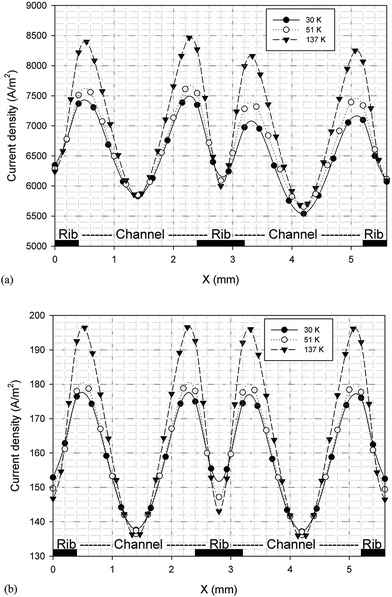 |
| | Fig. 6 The current density magnitude between the catalyst and membrane in the transverse plane for different mesh count: (a) 0.35 V and (b) 0.75 V. | |
3.2.3. Ohmic heat source. Ohmic entropy generation emerges from the resistance of the electron movement through the electrodes and also that of ions through the electrolyte. Law of ohm is connected to both the electron and ion streams while investigating the entropy generation. In addition, entropy creation emerges from the progressions in the amassing of the reactants, amid fuel utilization at the electrode surfaces.38 The ohmic heat source is an important parameter for any non-isothermal fuel cell model. The change in this parameter at the anode and cathode is shown in Fig. 11a and b, respectively; however, the results were similar to those of the anode and cathode temperature and no significant change was detected in different cases. In other words, the ohmic heat source was less sensitive to the grid size.
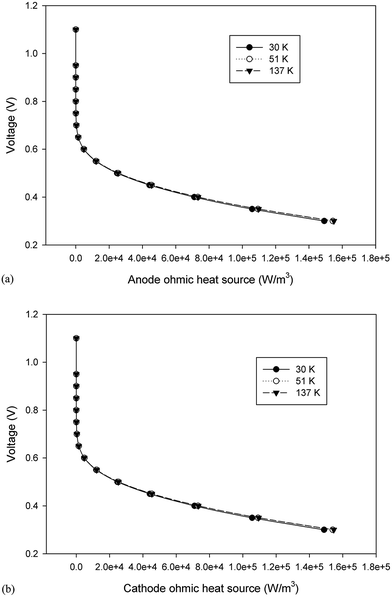 |
| | Fig. 11 The change in the ohmic heat source over the operating voltage range for the three cases different in mesh size. (a) Anode ohmic heat source and (b) cathode ohmic heat source. | |
4. Conclusion
Herein, a 3-D and non-isotheral PEMFC model was conducted to investigate the decisive parameters for performing grid independency analysis in a single serpentine channel of a PEMFC. Some major modeling and operation parameters were obtained over a wide range of operating voltage. First, the results indicated an uncertainty in the accuracy of previous modeling studies using the polarization curve as the grid independence parameter. This uncertainty was much significant especially in the studies in which grid independency analyses were carried out at a specific voltage. The results clearly show that the polarization curve is not enough to check the grid independency in the PEMFC computational fluid dynamic modeling. In our case study, the concentration of the fuel cell reactants and product showed more sensitivity for checking the grid independency as compared to other parameters studied herein. These parameters are the average volumetric concentration of hydrogen at the anode and those of oxygen and water at the cathode. Moreover, our case study results show that the maximum deviation between different cases occurred at the minimum allowable operating voltage of fuel. Although from the current research, it cannot be concluded that a specific parameter, such as the average volumetric hydrogen concentration, is the best parameter to be used in the grid independence test for all PEMFC CFD modeling cases, it can be concluded that grid independence using the polarization curve is not enough and other parameters, such as the fuel and product concentration, should be investigated to ensure that the solution is not dependent on the grid size.
References
- R. I. Klein, J. Comput. Appl. Math., 1999, 109, 123–152 CrossRef.
- K. M. Almohammadi, D. B. Ingham, L. Ma and M. Pourkashan, Energy, 2013, 58, 483–493 CrossRef.
- W. L. Oberkampf and T. G. Trucano, Prog. Aerosp. Sci., 2002, 38, 209–272 CrossRef.
- M. A. R. S. Al-Baghdadi and H. A. K. S. Al-Janabi, Energy Convers. Manage., 2007, 48, 3102–3119 CrossRef CAS.
- T. Berning, D. M. Lu and N. Djilali, J. Power Sources, 2002, 106, 284–294 CrossRef CAS.
- Y. M. Ferng and A. Su, Int. J. Hydrogen Energy, 2007, 32, 4466–4476 CrossRef CAS.
- Y. M. Ferng, Y. C. Tzang, B. S. Pei, C. C. Sun and A. Su, Int. J. Hydrogen Energy, 2004, 29, 381–391 CrossRef CAS.
- G. H. Guvelioglu and H. G. Stenger, J. Power Sources, 2005, 147, 95–106 CrossRef CAS.
- A. Iranzo, M. Muñoz, F. Rosa and J. Pino, Int. J. Hydrogen Energy, 2010, 35, 11533–11550 CrossRef CAS.
- K. Jiao, B. Zhou and P. Quan, J. Power Sources, 2006, 154, 124–137 CrossRef CAS.
- H. Ju, H. Meng and C.-Y. Wang, Int. J. Heat Mass Transfer, 2005, 48, 1303–1315 CrossRef CAS.
- H. Meng, J. Power Sources, 2006, 162, 426–435 CrossRef CAS.
- H. Meng and C.-Y. Wang, Chem. Eng. Sci., 2004, 59, 3331–3343 CrossRef CAS.
- G. Falcucci, E. Jannelli, M. Minutillo and S. Ubertini, J. Fuel Cell Sci. Technol., 2012, 9, 021014 CrossRef.
- V. Krastev, G. Falcucci, E. Jannelli, S. Ubertini and L. Andreassi, Fifth European Fuel Cell Technology & Applications Conference, 2013, EFC13083 Search PubMed.
- S. S. Wei, T. H. Wang and J. S. Wu, Energy, 2014, 69, 553–561 CrossRef.
- A. D. Le and B. Zhou, J. Power Sources, 2010, 195, 5278–5291 CrossRef CAS.
- V. Krastev, G. Falcucci, T. E. Simos and C. Tsitouras, International Conference on Numerical Analysis and Applied Mathematics, 2015, vol. 570006, pp. 1–4 Search PubMed.
- V. K. Krastev, G. Falcucci, E. Jannelli, M. Minutillo and R. Cozzolino, Int. J. Hydrogen Energy, 2014, 39, 21663–21672 CrossRef CAS.
- H. K. Esfeh and M. Hamid, J. Electrochem. Energy Convers. Storage, 2016, 13, 021003 CrossRef.
- B. R. Sivertsen and N. Djilali, J. Power Sources, 2005, 141, 65–78 CrossRef CAS.
- M. S. Ismail, K. J. Hughes, D. B. Ingham, L. Ma and M. Pourkashanian, Appl. Energy, 2012, 95, 50–63 CrossRef CAS.
- S. Kamarajugadda and S. Mazumder, Comput. Chem. Eng., 2008, 32, 1650–1660 CrossRef CAS.
- S. Kamarajugadda and S. Mazumder, J. Power Sources, 2008, 183, 629–642 CrossRef CAS.
- S. Mazumder, J. Electrochem. Soc., 2005, 152, A1633–A1644 CrossRef CAS.
- J.-H. Jang, W.-M. Yan, H.-Y. Li and W.-C. Tsai, Int. J. Hydrogen Energy, 2008, 33, 156–164 CrossRef CAS.
- F. C. Chen, Z. Gao, R. O. Loutfy and M. Hecht, Fuel Cells, 2003, 3, 181–188 CrossRef.
- S. Maharudrayya, S. Jayanti and A. P. Deshpande, J. Power Sources, 2004, 138, 1–13 CrossRef CAS.
- X. Zhu, P. C. Sui and N. Djilali, J. Power Sources, 2008, 181, 101–115 CrossRef CAS.
- S. M. Pourkiaei, M. H. Ahmadi and S. M. Hasheminejad, Mech. Ind., 2016, 17, 105 CrossRef.
- G. Arab, H. Ghadamian and S. Abbasi, Mech. Ind., 2014, 15, 113–121 CrossRef CAS.
- A. Thomas, G. Maranzana, S. Didierjean, J. Dillet and O. Lottin, Mech. Ind., 2012, 13, 255–260 CrossRef CAS.
- G. Hoogers, Fuel cell technology handbook, CRC press, 2002 Search PubMed.
- B. Gou, W. Na and B. Diong, Fuel cells: modeling, control, and applications, CRC press, 2009 Search PubMed.
- H. K. Esfeh and M. K. A. Hamid, Energy Procedia, 2014, 61, 2613–2616 CrossRef CAS.
- H. K. Esfeh and M. K. A. Hamid, Energy Procedia, 2014, 61, 2617–2620 CrossRef CAS.
- L. Wang, A. Husar, T. Zhou and H. Liu, Int. J. Hydrogen Energy, 2003, 28, 1263–1272 CrossRef CAS.
- G. F. Naterer, C. D. Tokarz and J. Avsec, Int. J. Heat Mass Transfer, 2006, 49, 2673–2683 CrossRef CAS.
|
| This journal is © The Royal Society of Chemistry 2017 |
Click here to see how this site uses Cookies. View our privacy policy here.  Open Access Article
 ab,
A. Azarafzac and
M. K. A. Hamid*a
![[thin space (1/6-em)]](https://www.rsc.org/images/entities/char_2009.gif) 000 computational cells, and they created another model by increasing the control volume to 200
000 computational cells, and they created another model by increasing the control volume to 200![[thin space (1/6-em)]](https://www.rsc.org/images/entities/char_2009.gif) 000 to show the grid independence of their study. The average current density at 0.55 V was calculated for both grids, and they reported that a negligible relative error of less than 0.1% was obtained. Although they showed that their base case had enough accuracy to be used in a PEM fuel cell modeling, their grid independence study did not answer the question that whether it was possible to find a model case with less control volume as compared to that of the base case with enough accuracy. Kamarajugadda and Mazumder23,24 developed two computational fluid dynamics models of a polymer electrolyte membrane fuel cell to investigate water management within the membrane and the effect of the cathode catalyst layer structure and composition. The grid independence study was carried out in two cases. In the first case, grid independence was performed by checking the effect of the change of different grid sizes in the gas diffusion layer and catalyst layer on the polarization curve, whereas in the second case, grid independence was carried out by checking the effect of the cell numbers in the membrane on the polarization curve. Although the authors used the polarization curve for the grid independence study, these curves were based on Mazumder's research25 in which the accuracy of the numerical solution was investigated by checking the effect of change in the number of cells across the membrane layer on the water content. Jang et al.26 established a 3-D numerical model of the PEMFC to investigate the performance and transport phenomena in the PEMFCs. They created three models with different mesh sizes to study the mesh independency. They observed that there was no notable difference in the I–V curves of the fuel cell with medium and high computational cell grids; however, the difference in the I–V curves between the low and high grid was significant (the difference reported was approximately 3.9% at an operating voltage of 0.3 V).
000 to show the grid independence of their study. The average current density at 0.55 V was calculated for both grids, and they reported that a negligible relative error of less than 0.1% was obtained. Although they showed that their base case had enough accuracy to be used in a PEM fuel cell modeling, their grid independence study did not answer the question that whether it was possible to find a model case with less control volume as compared to that of the base case with enough accuracy. Kamarajugadda and Mazumder23,24 developed two computational fluid dynamics models of a polymer electrolyte membrane fuel cell to investigate water management within the membrane and the effect of the cathode catalyst layer structure and composition. The grid independence study was carried out in two cases. In the first case, grid independence was performed by checking the effect of the change of different grid sizes in the gas diffusion layer and catalyst layer on the polarization curve, whereas in the second case, grid independence was carried out by checking the effect of the cell numbers in the membrane on the polarization curve. Although the authors used the polarization curve for the grid independence study, these curves were based on Mazumder's research25 in which the accuracy of the numerical solution was investigated by checking the effect of change in the number of cells across the membrane layer on the water content. Jang et al.26 established a 3-D numerical model of the PEMFC to investigate the performance and transport phenomena in the PEMFCs. They created three models with different mesh sizes to study the mesh independency. They observed that there was no notable difference in the I–V curves of the fuel cell with medium and high computational cell grids; however, the difference in the I–V curves between the low and high grid was significant (the difference reported was approximately 3.9% at an operating voltage of 0.3 V).![[thin space (1/6-em)]](https://www.rsc.org/images/entities/char_2009.gif) 000 elements. Maharudrayya et al.28 studied the pressure loss and the flow pattern of a PEMFC via a numerical simulation of the laminar flow through single and curved bend serpentine channels. To analyze the results of the grid independence, calculations for a particular case were conducted in a sharp bend with six different cross-sectional grid sizes and the effect of this difference on the pressure drop was checked. They found that a cross-section with a 20 × 12 size was independent of the grid size. Zhu et al.29 modeled the liquid water dynamic behavior appearing in the gas flow channel of a PEMFC from the gas diffusion layer. They reported that the grid independence analysis was conducted by increasing and decreasing the number of grid cells by 20 and 40%, respectively, as compared to the base case, and water droplet transport and deformation processes were observed with all three grids. Although they reported that grid dependency was carried out, they did not report any of the results for their cases.
000 elements. Maharudrayya et al.28 studied the pressure loss and the flow pattern of a PEMFC via a numerical simulation of the laminar flow through single and curved bend serpentine channels. To analyze the results of the grid independence, calculations for a particular case were conducted in a sharp bend with six different cross-sectional grid sizes and the effect of this difference on the pressure drop was checked. They found that a cross-section with a 20 × 12 size was independent of the grid size. Zhu et al.29 modeled the liquid water dynamic behavior appearing in the gas flow channel of a PEMFC from the gas diffusion layer. They reported that the grid independence analysis was conducted by increasing and decreasing the number of grid cells by 20 and 40%, respectively, as compared to the base case, and water droplet transport and deformation processes were observed with all three grids. Although they reported that grid dependency was carried out, they did not report any of the results for their cases.![[thin space (1/6-em)]](https://www.rsc.org/images/entities/char_2009.gif) 000 computational cells, and two cases were created by increasing and decreasing the grid counts to 137
000 computational cells, and two cases were created by increasing and decreasing the grid counts to 137![[thin space (1/6-em)]](https://www.rsc.org/images/entities/char_2009.gif) 000 and 30
000 and 30![[thin space (1/6-em)]](https://www.rsc.org/images/entities/char_2009.gif) 000, respectively, as compared to those of the base case.
000, respectively, as compared to those of the base case.
![[u with combining right harpoon above (vector)]](https://www.rsc.org/images/entities/i_char_0075_20d1.gif) ) = Sm
) = Sm![[u with combining right harpoon above (vector)]](https://www.rsc.org/images/entities/i_char_0075_20d1.gif)
![[u with combining right harpoon above (vector)]](https://www.rsc.org/images/entities/i_char_0075_20d1.gif) ) = −∇p + ∇(μ∇
) = −∇p + ∇(μ∇![[u with combining right harpoon above (vector)]](https://www.rsc.org/images/entities/i_char_0075_20d1.gif) ) + Su
) + Su![[u with combining right harpoon above (vector)]](https://www.rsc.org/images/entities/i_char_0075_20d1.gif) Ci) = ∇(Deffi∇Ci) + Si
Ci) = ∇(Deffi∇Ci) + Si![[u with combining right harpoon above (vector)]](https://www.rsc.org/images/entities/i_char_0075_20d1.gif) T) = ∇(keff∇T) + ST
T) = ∇(keff∇T) + ST


![[thin space (1/6-em)]](https://www.rsc.org/images/entities/char_2009.gif) 000, 51
000, 51![[thin space (1/6-em)]](https://www.rsc.org/images/entities/char_2009.gif) 000, and 137
000, and 137![[thin space (1/6-em)]](https://www.rsc.org/images/entities/char_2009.gif) 000 mesh count). As shown in Fig. 3, there is no significant change in the current density over a wide range of operating voltage for the different grids. Therefore, from a theoretical point of view of the grid independency, it is possible to choose the largest size of mesh (smaller mesh count) for the modeling to decrease the computational time. However, it is required to answer one question that whether there is any larger mesh size that will produce the same result in the polarization curve? Therefore, a new grid independency analysis should be performed at the larger grid size of the first survey. Herein, note that the polarization curve was used as a reference for grid independence.26
000 mesh count). As shown in Fig. 3, there is no significant change in the current density over a wide range of operating voltage for the different grids. Therefore, from a theoretical point of view of the grid independency, it is possible to choose the largest size of mesh (smaller mesh count) for the modeling to decrease the computational time. However, it is required to answer one question that whether there is any larger mesh size that will produce the same result in the polarization curve? Therefore, a new grid independency analysis should be performed at the larger grid size of the first survey. Herein, note that the polarization curve was used as a reference for grid independence.26


