DOI:
10.1039/C7RA03231E
(Paper)
RSC Adv., 2017,
7, 38935-38944
Synthesis of nanostructured alumina with ultrahigh pore volume for pH-dependent release of curcumin
Received
19th March 2017
, Accepted 23rd July 2017
First published on 9th August 2017
Abstract
In a new approach, a series of nanoporous non-crystalline alumina (NPA) materials was designed and developed by an evaporation-induced self-assembly method in the presence of various weight percentages of tetrabutylammonium bromide (Bu4N+Br−) versus P123 (0, 24, 30, 56 and 100) as the dual structure-directing agents. The effect of different amounts of Bu4N+Br− on the morphology, pore sizes, and surface area of the samples was carefully monitored. The samples were characterized by N2 adsorption–desorption isotherms, X-ray diffraction (XRD), Fourier transform infrared spectroscopy (FT-IR), field emission scanning electron microscopy (FE-SEM), transmission electron microscopy (TEM) and zeta potential instrumentational methods. The obtained samples have relatively high surface areas (up to 415 m2 g−1), great pore volumes (up to 2.00 cm3 g−1) and large pore sizes (up to 23.0 nm). The results indicated that higher pore volume (2.00 cm3 g−1) was obtained when only tetrabutylammonium bromide (namely NPA-100) was used than when only P123 namely NPA-0 (0.5 cm3 g−1) was used as a template. These new supports were used, for the first time, as an inorganic host for poorly soluble guest of curcumin (CUR). XRD analysis confirmed the amorphous state of CUR after being loaded into the NPAs, which is indicative of the full dispersion of the drug into the pores. The in vitro release behavior of these compounds was studied in simulated gastric fluid (SGF, pH = 1.2) and simulated intestinal fluid (SIF, pH = 6.8). The result indicated that the release of insoluble curcumin reached 80% in SGF when it was supported on alumina with ultrahigh pore volume. Moreover, this carrier showed high drug adsorption. The potential of the NPA-100@CUR in protecting SH-SY5Y cells from oxidative stress by toxin 6-OHDA that caused parkinsonian was tested. The results indicated that the formulation neutralizes 6-OHDA toxicity and significantly enhances cell survival.
1. Introduction
Nanoporous materials opened a new area in the tailoring and highlighting nanotechnology1,2 due to their unique properties such as similar pore size, high surface area and tunable structure.3 It can be claimed that mesoporous materials have potential to be used in various fields as ideal adsorbents and catalysts. There are numerous types of nanoporous materials based on the pore size and structure.4–6 The first version of mesoporous materials was fabricated based on silica, and then mesoporous carbons7 and other metal oxides8–10 were eventually developed. Among them, mesoporous silica has widespread potential for drug delivery systems because of its favorable properties such as small size, the surface chemistry of the pores and good biocompatibility.11–13 In this contribution, nanoporous alumina represents a very interesting molecular sieve due to its heat resistance, tolerating pH stress, high surface area, tunable pore size distribution, high density of surface hydroxyl groups, abundant Lewis acid sites, high capacity of loading, low toxicity and high mechanical stability.14,15 Their properties sparked consideration for their use in various applications such as in catalysis,16 adsorbents17 and gas-capturing.18 Several synthetic strategies have been reported by different methods such as sol–gel and evaporation-induced self-assembly (EISA)14,19 relying on different reagents such as (EO)20(PO)70(EO)20 triblock copolymer in the presence of additives such as citric or nitric acid,20 organic acids,21,22 and (trimethylbenzene) TMB.19 They can interact with surface hydroxyl groups of alumina via hydrogen bonding that affects the pore size and shape.23 Thus, there is a connection between the synthesis procedure and the surface chemical properties of alumina.
Generally, the template synthetic method (hard or soft template) is considered to be the most effective route to prepare the nanostructures that enable the tuning of their pore sizes. Using the mixed surfactant/cosurfactant system has been considered as a better method to control the size and shape of the nanoparticles over using single surfactant.24 In cationic surfactant/pluronic systems, it is difficult to obtain a uniform size distribution and the role of the cationic surfactant is not yet clarified.25 The interaction between the ionic surfactant and the triblock polymers (TBP) has been detected to be highly dependent on the nature of the ionic surfactant. In general, the interactions between cationic surfactants and pluronic polymers are less facile than the corresponding interactions between the same polymers and anionic surfactants.26 For cationic surfactants, a weak interaction with TBP has been observed, which is called the synergetic interaction.27 It has also been noticed that this type of mixed surfactant leads to the formation of smaller aggregates.28 In all CTAB–pluronic systems, the hydrophilicity of the pluronics is affected by combining the alkyl tail of the cationic surfactant with the polypropylene oxide core.29 Recently, synthesis of ferric-silica nanoparticles using TBAB as a templating agent and P123 as a regulator of the silicon oxide grain growth has been reported.30 Preparation of nano- and microplates of gold using P123 and TBAB as capping agents is an effective way to produce particles with a controllable shape.31 Curcumin is a naturally derived polyphenol, obtained from a perennial herb, which has various therapeutic features including anti-inflammatory, antitumor, antioxidant and antimicrobial activities,32,33 and specifically, a neuroprotective activity.34 The main disadvantages in using curcumin are its low solubility in water under an acidic media and its rapid hydrolysis under alkaline conditions.35,36 Therefore, the uptake of curcumin on a suitable support with high surface area to generate a reasonable release profile is very crucial in the improvement of the pharmaceutical behavior of curcumin. Attempts have been made to prepare different formulations such as encapsulation of curcumin with liposomes, polymers, micelles or nanoparticles.37–39 Recently, mesoporous silica coated with lipid and β-CD,40,41 tannic acid–Fe(III) complex41,42 and superparamagnetic materials43 has been investigated for the release and target delivery of curcumin. Owing to the pH sensitivity of the mesoporous silica surface, it is useful in increasing the bioavailability of curcumin. In addition to silica, surface engineering metal oxides such as CoFe2O4 and ZnFe2O4 nanoparticles were used by coating with PEG and chitosan, which acted as curcumin delivery vehicles.44 Moreover, some series of bioactive glass substituted with xCe2O3, xGa2O3 and xZnO have applications in drug delivery; however, the rate of release of the drug varies with the change in the concentrations of Ce, Ga and Zn, because curcumin as a hard Lewis base has affinity toward hard Lewis acids such as Ga3+ and Ce3+ ions.45 Nevertheless, the release of curcumin in various media is still disregarded. Therefore, inclusion of drug molecules inside different pores can preserve them in different body fluids.46 The important parameters in drug loading are surface area, pore volume and hydroxyl-rich character of the inorganic support. It was reported that the pore volume of mesoporous carriers is directly related to the drug-loading amount and the drug release rate.47
In addition, there are also a few reports on using nanoporous alumina as a support for drug delivery in comparison with mesoporous silica. During recent years, researchers have been using commercial alumina as a support for drug delivery of ibuprofen,48 while this study deprived using tunable porosity and more hydroxyl-rich density located on the walls, which is a key factor for the support.15 In another study, ketoprophen was loaded into mesoporous alumina and only a single structure-directing agent was used in each synthesis, which limited us from obtaining tailored alumina.49
Herein, future potential applications of amorphous or non-crystalline alumina inspired us to develop new synthetic alumina by controlling the dual structure-directing agents (DSDA) containing quaternary ammonium salts such as tetrabutylammonium bromide (TBAB) and P123 as a new effective mixed template for the preparation of nanoporous alumina. TBAB as a co-surfactant mixed with P123 plays an important role in the assembly of nanoporous alumina. Different TBAB weight percentages of 0, 24, 30, 56 and 100 led to unique platforms. These materials with different traits and varieties of surface area, high pore volume and dissimilar pore size, for the first time, have been used as a support for the release of curcumin. In addition, the weight percentage of 100 for TBAB (in the absence of P123) led to a very high pore volume with an immense potential for prolonged curcumin release, which is a very important factor for drug release that will open important prospects for further applications.
2. Experimental
2.1. Materials and reagents
Aluminum-tri-sec-butoxide (97%) and Pluronic P123 (EO20PO70EO20, Mw = 5800) were obtained from Sigma-Aldrich Co. Tetrabutylammonium bromide (TBAB), hydrochloric acid (HCl, 37%), and absolute ethanol (99.98%) were purchased from Merck Co. Curcumin was obtained from Exir Nano Sina Co. All the materials were of pro-analysis grade and used without further purification.
2.2. Methods
2.2.1. Characterization of the materials. Infrared spectra were recorded on the Shimadzu Model FT-IR 4600 spectrometer. X-ray diffraction patterns were obtained on the Bruker D8 diffractometer with CuKα radiation. The morphology of the samples was examined via field emission scanning electron microscopy (FE-SEM) with a Mira 3-XMU system under high vacuum at an ambient temperature with a beam voltage of 10–20 kV. Transmission electron microscopy (TEM) was performed using the PHILIPS EM 208 microscope. The surface areas of inner pore walls were evaluated by the Brunauer–Emmett–Teller (BET) method using Belsorp mini. The pore volume and pore size distributions were calculated from the adsorption branches of isotherms using the Barrett–Joyner–Halenda (BJH) model. The zeta potential of nanomaterials was measured using a Zetasizer ZS, Malvern Instruments. In vitro tests for curcumin release were carried out using the UV-Vis spectra of solutions in the range of 200–500 nm using the DR 5000 HACH spectrophotometer.
2.2.2. Synthesis of amorphous nanoporous alumina (NPA-n). The nanoporous alumina materials (NPA-n) were synthesized under EISA approach. The weight percentage of TBAB was obtained using the following eqn (1):| |
 | (1) |
Different weight percentages of TBAB (0, 24, 30, 56 and 100 denoted as NPA-0, NPA-24, NPA-30, NPA-56 and NPA-100, respectively) were added to a mixture of EtOH (20 mL) and HCl (37%, 1.3 mL) and stirred at 40 °C for 3 h. Then, 2.46 g (9.9 mmol) of aluminum-tri-sec-butoxide was added to the reaction mixture at the same temperature, and the mixture was stirred for 20 h. Finally, the solution was poured into a Petri dish and dried at 60 °C for 24 h. In this step, to remove the template, the obtained samples were annealed by raising the temperature up to 550 °C at a heating rate of 1 °C min−1 and kept for 5 h.
2.2.3. Loading of curcumin into nanoporous alumina (NPA-n@CUR). In this study, the aim was to obtain the accurate drug-loading amount of 16.66%, because higher percentages did not result in a suitable release profile. In detail, curcumin was dissolved in ethanol to obtain a highly concentrated solution, which was then mixed with a certain amount of carrier to yield samples with a drug–alumina ratio of 1![[thin space (1/6-em)]](https://www.rsc.org/images/entities/char_2009.gif) :5 (w/w). Curcumin weighing 0.0067 g (0.019 mmol) was dissolved in EtOH (0.5 mL) and then, 0.0337 g of the desired NPA-n was added to the solutions under vigorous stirring. After 12 h, the solvent of each reaction mixture was removed using a rotary evaporator and the solid was collected for next experiments.
:5 (w/w). Curcumin weighing 0.0067 g (0.019 mmol) was dissolved in EtOH (0.5 mL) and then, 0.0337 g of the desired NPA-n was added to the solutions under vigorous stirring. After 12 h, the solvent of each reaction mixture was removed using a rotary evaporator and the solid was collected for next experiments.
2.2.4. Adsorption drug. In the adsorption test,50 33.5 mg of NPA-n carriers was dispersed in 12 mL of methanol solution of CUR (6.7 mg). The resulting mixture was stirred at room temperature for 12 h. Following this, all samples were centrifuged and the supernatant CUR was monitored using a UV-visible spectrophotometer at a wavelength of 428 nm. The amount of the adsorbed drug in equilibrium state was calculated from the curcumin concentration in the solution before and after adsorption according to eqn (2):| |
 | (2) |
where Qo (mg g−1) is the amount of curcumin adsorbed in the equilibrium state; Co (mg dm−3) and Ce (mg dm−3) represent the initial and equilibrium concentrations of curcumin, respectively; V (dm3) is the volume of adsorbate solution and m (g) is the mass of alumina adsorbents.
2.2.5. In vitro drug release experiments. The in vitro drug release experiment was performed in two different release media (simulated gastric fluid (SGF), pH = 1.2 and simulated intestinal fluid (SIF), pH = 6.8) at 35 °C under stirring at 125 rpm in a dark room. For each test, 0.05 g of the desired NPA-n@CUR sample was added to each of these two buffers and studied independently. The concentration of the released curcumin was analyzed using a UV-Vis spectrophotometer at λmax = 428 nm by a blank correction method.American Type Culture Collection (ATCC) with Catalog #: CRL-2266.
2.2.6. Cell culture and MTT viability assay. To assay the drug activity, different concentrations of the prepared sample were used, and for each of them a SH-SY5Y (American Type Culture Collection (ATCC) with Catalog #: CRL-2266) neuroblastoma cell line was used. These cells were cultured in Dulbecco's Modified Eagle's medium (DME), which was supplemented with L-glutamine, penicillin and streptomycin (1%) and fetal bovine serum (10%). Then, it was incubated at 37 °C under an atmosphere of CO2 (5%). The cells were split by trypsinization when they reached 85–90% confluence. LD50 dose of 6-hydroxy dopamine (6-OHDA) toxin was obtained by treating the cells with their various concentrations under 3-(4,5-dimethyl-2-thiazolyl)-2,5-diphenyl tetrazolium bromide (MTT) viability assay for 12 h. For this purpose, a 0.5 mg mL−1 stock solution of MTT (Sigma) was prepared in PBS (phosphate buffered saline) with pH = 7.2, and filter sterilization was carried out before storing it at 4 °C until use. From this stock solution, 20–180 mL of free DME serum was added in each well and incubated the cells at 37 °C with under 5% CO2 for 3 h. Finally, this medium was replaced with 200 mL of DMSO (dimethyl sulfoxide). Then, the cells were incubated for 5 min and the absorbance was measured at 580 nm. The percentage of survival for controlling cells was determined and the data normalized to control, and their survival percentage was obtained. In order to examine the effect of NPA-100@CUR on cell survival, the cells were expanded and cultured in 96-well plates for 24 h. Serial concentrations of the nanodrug were prepared in DME and they were added to the cells for 12 h. Eventually, we added the LD50 equivalent of 6-OHDA to the cells and incubated them for another 12 h. Finally, the cells were subjected to the MTT assay.
2.2.7. Statistical analyses. All data were collected and converted to graphs using Microsoft Office 2013 Excel. Then, statistical data were analyzed using SPSS version 17. Cellular data are expressed as mean ± standard error of the mean of two or more separate experiments. Each assay was carried out in triplicates. Student's t-test was used to analyze the differences between two different groups. Differences among three or more groups were analyzed by one-way analysis of variance (ANOVA), followed by a post hoc Duncan multiple-comparisons test. We considered a value of P < 0.05 as statistically significant and P < 0.01 or P < 0.001 as highly significant.
3. Results and discussion
3.1. N2 adsorption–desorption isotherms
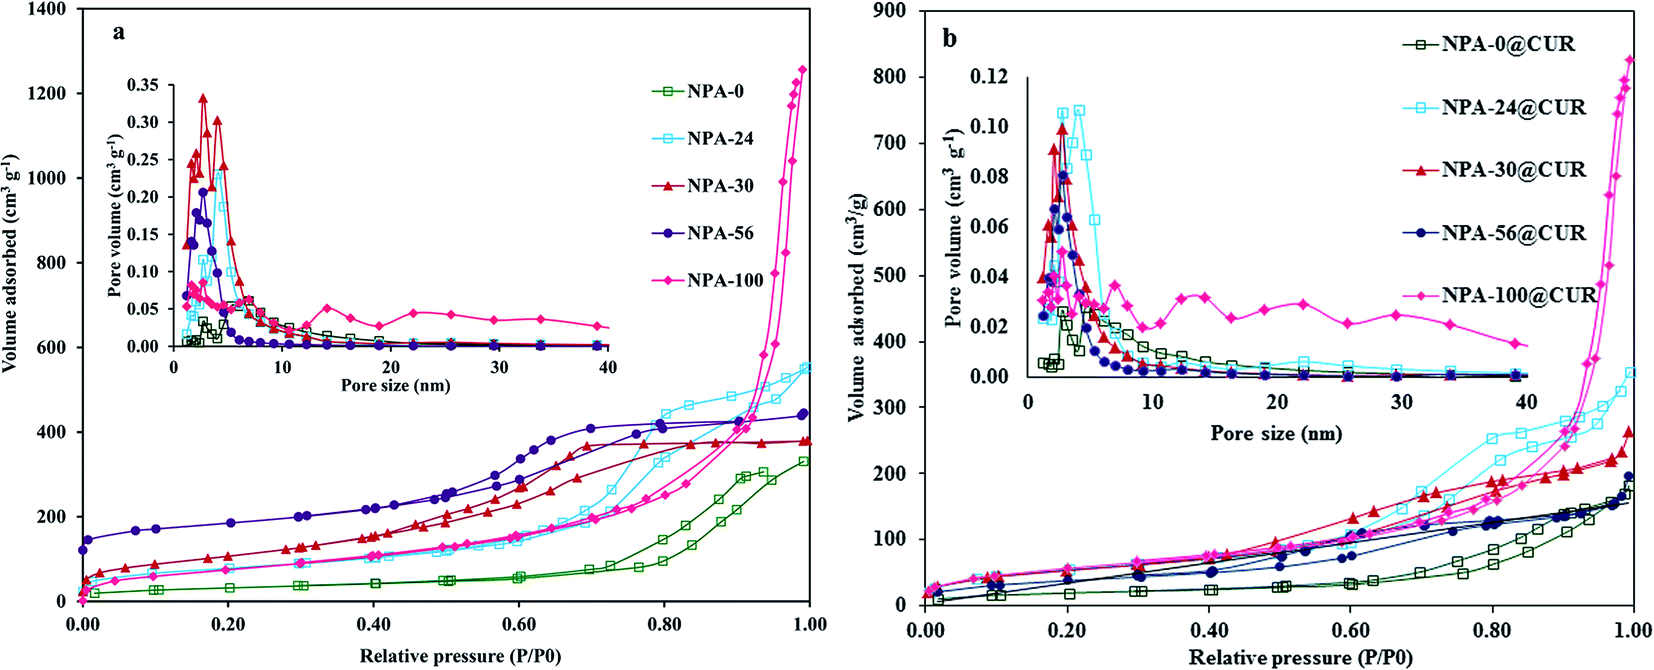
Nitrogen adsorption and desorption isotherms of the nanoporous alumina and CUR loaded samples are depicted in Fig. 1 and the detailed textural parameters are listed in Table 1.
 |
| | Fig. 1 N2 adsorption–desorption isotherms of (a) NPA-n and (b) NPA-n@CUR. | |
Table 1 Results of BET analysis for all samples
| Sample |
BET surface area (m2 g−1) |
Pore volume (cm3 g−1) |
Pore size (nm) |
| NPA-0 |
114 |
0.5 |
17.91 |
| NPA-24 |
277 |
0.83 |
12.12 |
| NPA-30 |
415 |
0.60 |
5.64 |
| NPA-56 |
313 |
0.52 |
6.74 |
| NPA-100 |
346 |
2.00 |
23.00 |
| NPA-0@CUR |
70 |
0.27 |
15.81 |
| NPA-24@CUR |
196 |
0.53 |
10.88 |
| NPA-30@CUR |
194 |
0.40 |
8.11 |
| NPA-56@CUR |
137 |
0.30 |
8.50 |
| NPA-100@CUR |
207 |
1.30 |
8.50 |
In this study, the mixtures of TBAB and P123 with various weight percentages of TBAB (e.g. NPA-0, NPA-24, NPA-30, NPA-56 and NPA-100) are used as DSDA for synthesis of a series of NPAs under acidic conditions to generate different mesoscopic structures. By changing the weight percentage of TBAB, the pore size, surface area and pore volume got altered, and hence, the hydrophobic curcumin was loaded into NPA-n in order to obtain different drug release behaviors. N2 adsorption–desorption isotherms for bare NPA-n materials and NPA-n@CUR, before (Fig. 1a) and after (Fig. 1b) drug loading, show a type IV isotherm51 with sharp capillary condensation at high relative pressures, with H1-type hysteresis loop with well-defined pore channels. Similarly, the adsorption–desorption isotherms of NPA-100 showed type IV isotherm and H3-type hysteresis loop with a narrow gap in the volume difference at high relative pressures, reflecting textural larger pores formed between foam-like particles.52
The sample NPA-0, which was synthesized only using P123, has a low surface area of 114 m2 g−1, but when the weight percentage of TBAB reached 30, there is an increment in the surface area up to its maximum amount (415 m2 g−1). Taking this into account, when TBAB alone was used as the template (sample NPA-100), it showed unique and extraordinary specific pore volume (2.00 cm3 g−1), surface area (346 m2 g−1) and pore size (23 nm) in comparison to the other samples using P123 as the only structure-directing agent.20 The high pore volume of the nanoscale metal–organic and silica compounds may be due to the aggregation of quaternary ammonium ions.53,54 When TBAB alone was used for the synthesis, the capillary condensation step shifted gradually from the relative pressure (P/P0) of about 0.5 to 1. This observation for NPA-100 proves the onset of capillary condensation and indicates it as an intensively porous structure. This new nanoporous alumina NPA-100 with intriguing porosity parameters, particularly high surface area and excellent pore volume (2.0 cm3 g−1), is a good candidate for the inclusion of different molecules. On the other hand, the elimination of P123 did not show any inhibiting activity in the formation of the new nanoporous alumina in the presence of Bu4N+Br− with promising properties that were not reported to date.30 Moreover, TBAB has short, less hydrophobic butyl groups that can be located on the hydrophobic/hydrophilic interface in P123 (PEO–PPO–PEO), but it does not inosculate into PPO domains or interact weakly with PPO.26 Therefore, these effects may result in less orientation of nanoporous alumina.31 In addition, TBAB can move more freely than other cationic surfactants, leading to the less-oriented structure and resulting in diversity of morphologies due to alumina aggregation.55 For NPA-56, the surface area decreases due to the increase in the weight ratio of TBAB when the optimum weigh ratio of 30 fails to enhance the surface area, which indicates that excess of TBAB would impair the role of P123 in the structure formation. It can be assumed that at optimum molar weight in the one-step assembly process, a high surface area was created,56,57 so that the existence of P123 could create mesoporous channels in order to avoid collapsed meso-structures. Moreover, for NPA-100 with only TBAB as the surfactant, the surface area was decreased due to the existence of acidic medium (HCl).58
By loading curcumin into nanoporous materials (NPA-n), the specific surface area and pore volume decreased for all samples (Fig. 1b and Table 1), which indicates the incorporation of CUR into the pores and their interaction with the hydroxyl groups. A reduction in the pore diameter after loading was noticed for NPA-0@CUR, NPA-24@CUR and NPA-100@CUR, whereas a pore size enlargement was determined for NPA-30@CUR and NPA-56@CUR samples that could be assigned to the total filling of smaller pores and the remaining several free larger pores.59 Moreover, the increase in pore size can be attributed to an inhomogeneous distribution of CUR molecules in pores (Table 1)60 and blocking of smaller pore size during the loading process.12 The pore size distribution of the latter carriers clearly shows this phenomenon (Fig. 1a). The closure point (P/P0) of the hysteresis loop was decreased for all samples, indicating a decrease in pore sizes.
3.2. FE-SEM analysis
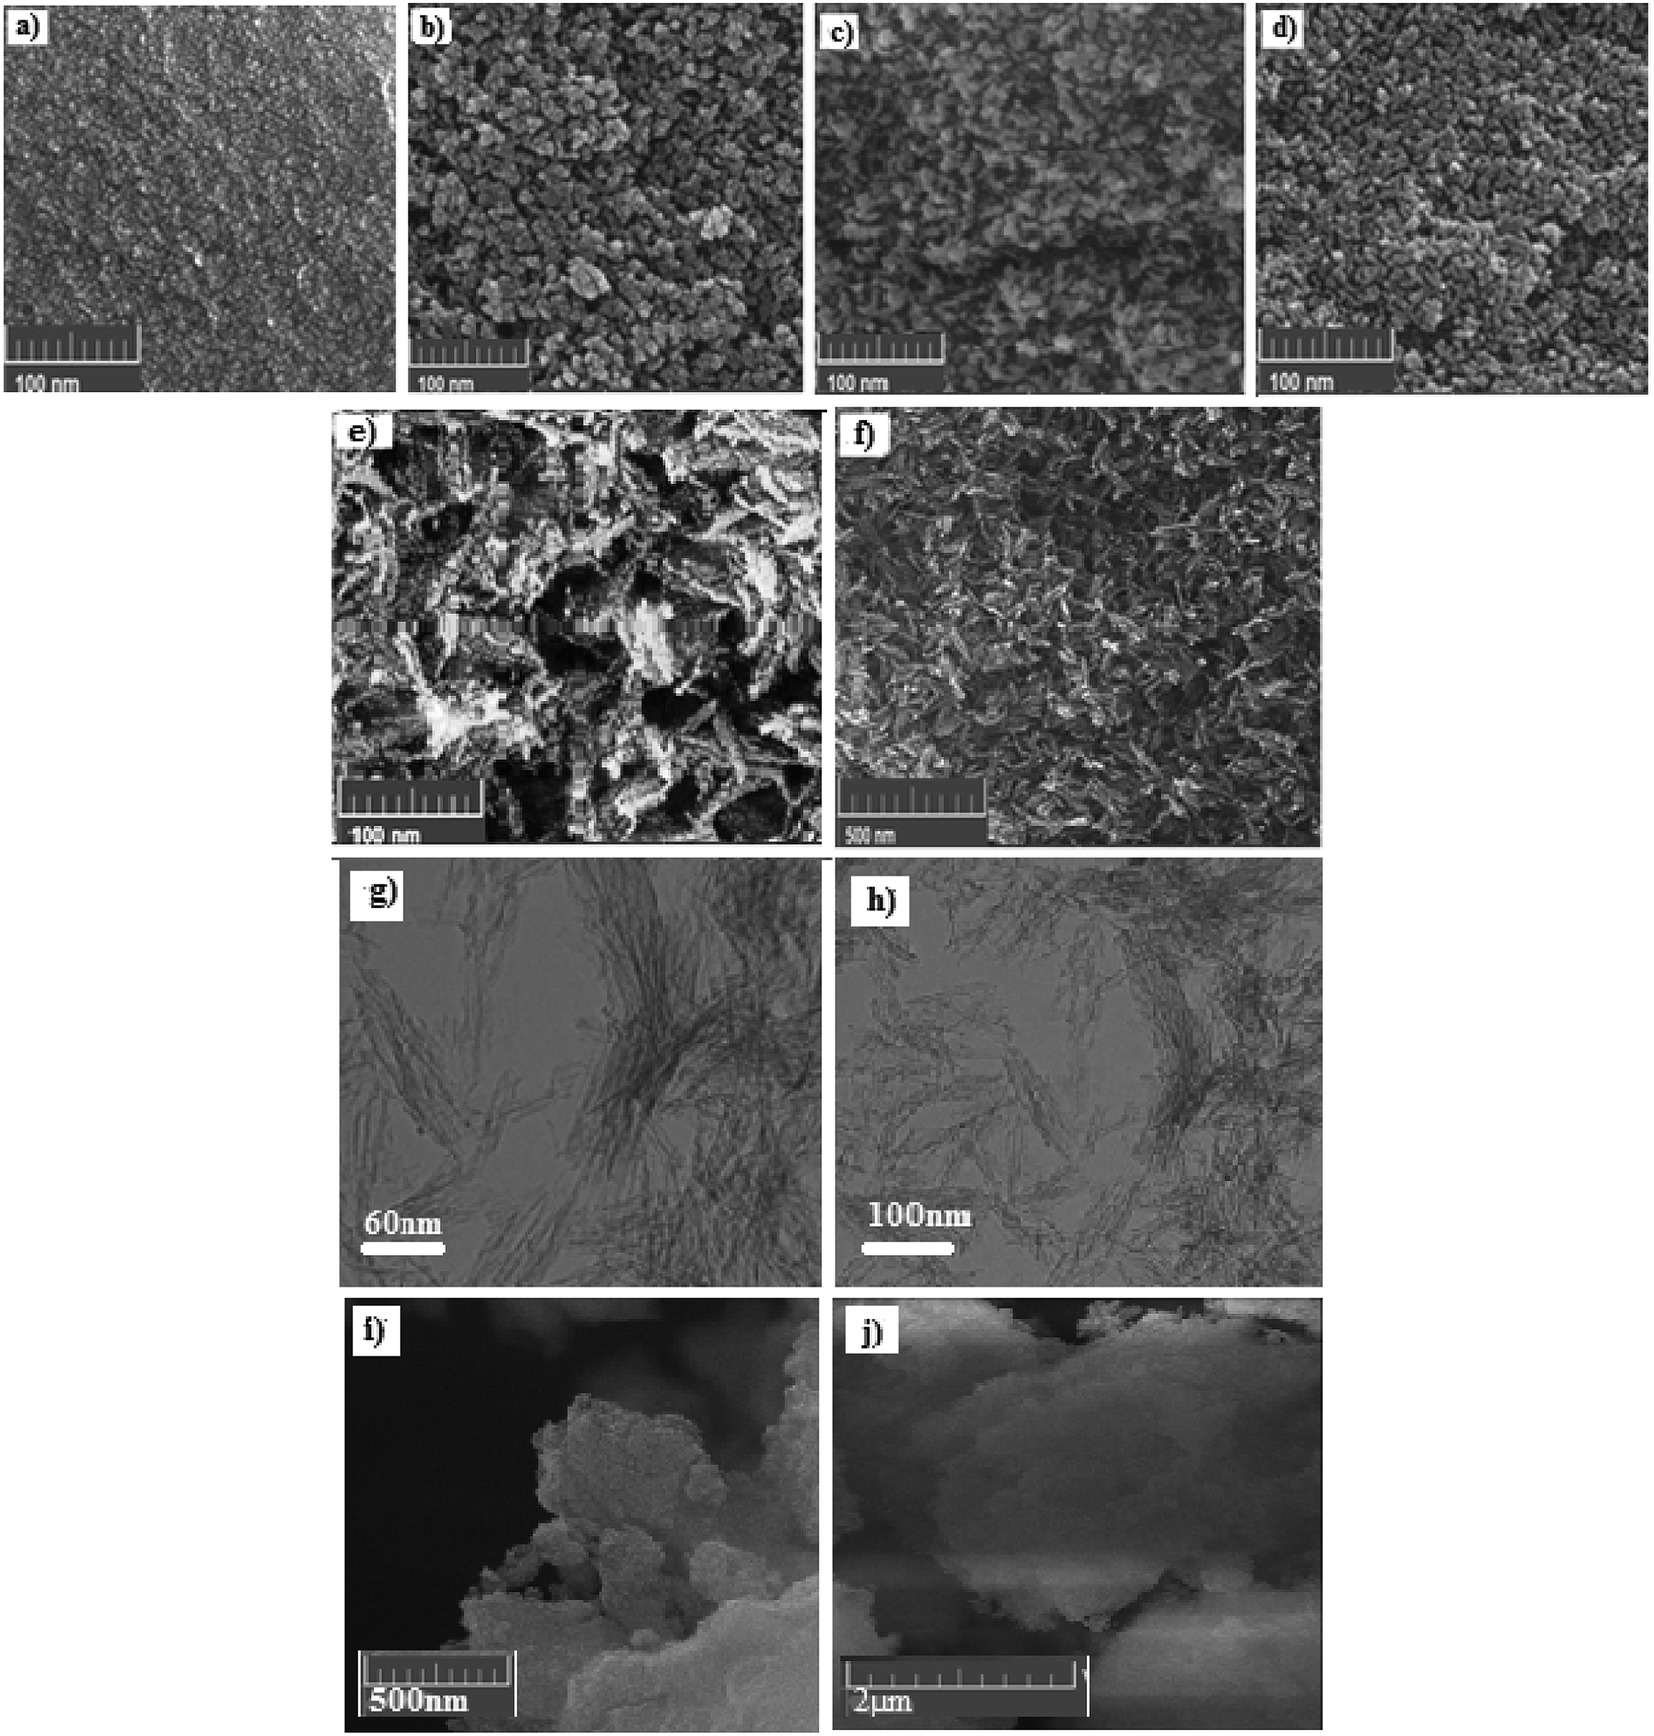
FE-SEM images of all synthesized samples and drug-loaded mesoporous carriers (NPA-100@CUR) are shown in Fig. 2; their high pore volume and high drug release rate in both media were analyzed to study the morphology of NPA-n, which is obtained under various conditions using different weight percentages of TBAB, as mentioned earlier in this study. All samples that contain P123 are nanoparticles and have a relatively spherical shape. The smallest nanoparticle is related to NPA-30, and BET analysis indicated a larger surface area (415 m2 g−1) for NPA-30 than for NPA-100 (346 m2 g−1) with different nanoflake shapes. SEM photograph of NPA-100@CUR revealed that CUR is well dispersed into the mesopore, since no pattern for crystalline CUR was observed in XRD. Moreover, a decrease in pore volume indicated the incorporation of CUR into the mesopore.
 |
| | Fig. 2 FE-SEM images of (a) NPA-0, (b) NPA-24, (c) NPA-30, (d) NPA-56, (e, f) NPA-100, (g, h) TEM image and (i, j) SEM image of NPA-100@CUR. | |
3.3. FT-IR characterization
To determine the interaction of curcumin with the NPA-n materials, FT-IR was used. All supports show broad bands at about 1635 and 3500 cm−1, which are attributed to –OH bending and stretching vibrations, respectively61 (Fig. 3a). The observed bands in 600–873 cm−1 region can be ascribed to Al–O bending vibrations and Al–OH wagging or rocking mode of molecular water in amorphous alumina,62 and the appearance of bands in this region represents aluminum ions in the octahedral and tetrahedral environments.63 The peak at 1384 cm−1 belongs to flexural vibrations of hydroxyl groups.64 As can be seen in Fig. 3b, pure curcumin shows several peaks at 3511 cm−1 (–OH vibration), 2943 cm−1 (C–H stretching vibration of –C–O–CH3), 1603 cm−1 (C![[double bond, length as m-dash]](https://www.rsc.org/images/entities/char_e001.gif) C benzene inter-ring stretching), 1629 and 1509 cm−1 (stretching vibrations of CO), 1282 cm−1 (aromatic C–O stretching), 1428 cm−1 (olefinic C–H bending vibration), 1371 cm−1 (CH3 bending) and 800–880 cm−1 (out-of-plane C–CH of aromatic ring). The observed band at 1000–1300 cm−1 in CUR can be typically attributed to symmetric and asymmetric C–O–C chains.65–67 Fig. 3b reveals the existence of the CUR on NPA-n. The sharp peak of CO stretching at 1514 cm−1 that shifted from 1509 cm−1 can be due to a hydrogen bond with the enol form of CUR. Moreover, the shift of CO vibration peaks from 1629 to 1625 cm−1, 1603 to 1600 cm−1 and 1282 to 1287 cm−1, and high reduction of intensity at 1428 cm−1 and 1603 cm−1 can be ascribed to the interaction of drug molecules with the supports.
C benzene inter-ring stretching), 1629 and 1509 cm−1 (stretching vibrations of CO), 1282 cm−1 (aromatic C–O stretching), 1428 cm−1 (olefinic C–H bending vibration), 1371 cm−1 (CH3 bending) and 800–880 cm−1 (out-of-plane C–CH of aromatic ring). The observed band at 1000–1300 cm−1 in CUR can be typically attributed to symmetric and asymmetric C–O–C chains.65–67 Fig. 3b reveals the existence of the CUR on NPA-n. The sharp peak of CO stretching at 1514 cm−1 that shifted from 1509 cm−1 can be due to a hydrogen bond with the enol form of CUR. Moreover, the shift of CO vibration peaks from 1629 to 1625 cm−1, 1603 to 1600 cm−1 and 1282 to 1287 cm−1, and high reduction of intensity at 1428 cm−1 and 1603 cm−1 can be ascribed to the interaction of drug molecules with the supports.
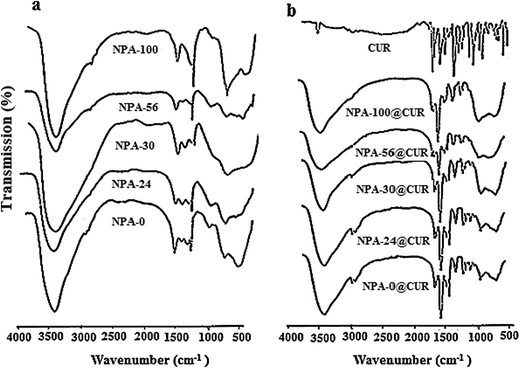 |
| | Fig. 3 FT-IR images of NPA-n materials (a) before and (b) after loading pure drug. | |
3.4. XRD analysis
XRD patterns of the samples are shown in Fig. 4a. This figure indicates that all NPA-n are amorphous alumina. This result is reasonable due to the fact that these samples are calcined at 550 °C, whereas the crystallization temperature should be in the range of 800–900 °C.68 As shown in Fig. 4b, characteristic diffraction peaks of CUR are not detected in the drug-loaded NPA-n, indicating that nano-sized pores restricted crystal formation of the drug, which is an advantage in the preparation of the nanodrugs.69 It was supposed that the crystallization of CUR was remarkably hindered and suppressed when constrained into nanoporous alumina.70 Since XRD pattern of curcumin is crystalline, amorphous XRD of NPA-n@CUR revealed that most of the drug is dispersed inside the pores interacting with the Al–OH groups located in the pore walls. This phenomenon is confirmed by decreasing the pore volume after loading the drug onto the NPA-n surface. These XRD patterns confined to the pores of an amorphous carrier and proved that CUR did not crystallize on the surface of the carrier; therefore, the solubility of curcumin (as insoluble drug) was increased substantially.71
 |
| | Fig. 4 XRD patterns of NPA-n materials, (a) before and (b) after curcumin loading. | |
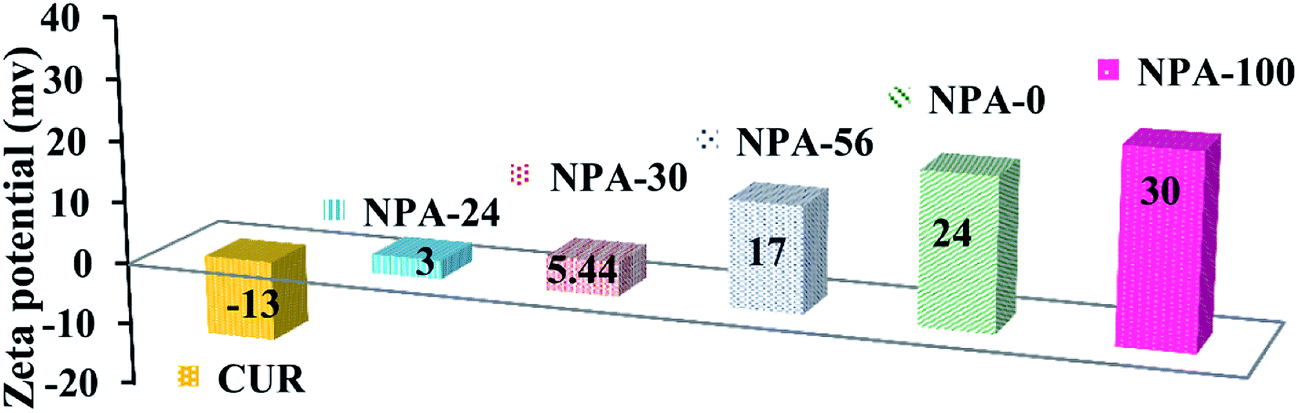
3.5. Zeta potential analysis
Zeta potential (ζ) was measured for all NPA-n samples to obtain the surface charges. Therefore, all of the materials were dispersed in an aqueous phase. The obtained results are presented in Fig. 5. All platforms of NPA-n had positive surface charges (from +3 to +30 mV), whereas in the case of pure curcumin, the surface charge was negative (−13 mV). As can be seen, the positive charge of NPA-n gets increased directly by enhancing the n or TBAB portion of the substrate versus P123. TBAB (quaternary ammonium ion) increases the surface charge density72 because of the positive character of the ammonium ion (Bu4N+) versus the neutral character of P123 polymer. According to Elsheikh's report, concerning the effect of zeta potential of the nanocarrier on the stability of these compounds in an aqueous medium,73 NPA-100 with the highest positive number (+30 mV) is the most suitable support for loading the drug. Therefore, maximum Δζ between NPA-100 and curcumin increases the probability of slowing down the release rate as a key factor in drug delivery.74
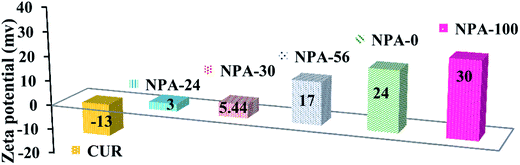 |
| | Fig. 5 Zeta potential of synthesized NPAs. | |
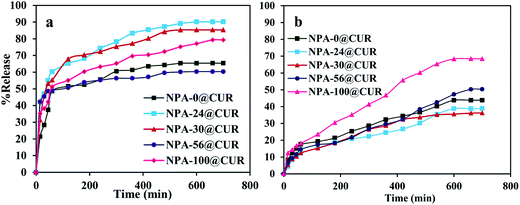
3.6. In vitro drug release
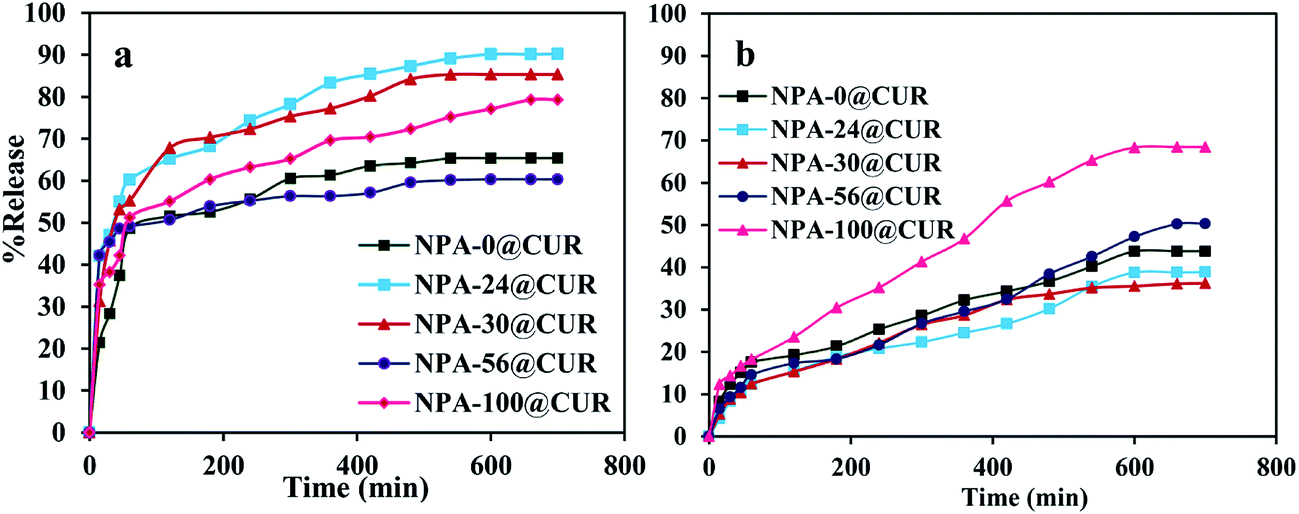
As mentioned in Section 2.2.4, the in vitro drug release experiment was performed in two different release media. With the aim to analyze the effect of pH change on the release assay, CUR was loaded into the nanoporous matrix until it acted as a device for the drug release. The experiments were evaluated under simulated gastric fluid (pH = 1.2, SGF) and simulated intestinal fluid (pH = 6.8, SIF) because the CUR loaded into the nanopores has to be passed when administrated orally. The profiles of release are shown in Fig. 6. Releases of five loaded curcumin on various nanoporous aluminas into SGF (Fig. 6a) exhibited two types of release behaviors; an initial fast and then slow release. About 48, 60, 55, 49 and 51% of CUR were released during 50 min from NPA-0, NPA-24, NPA-30, NPA-56 and NPA-100, respectively. The final CUR release reached 65, 90, 85, 60 and 79% within 12 h, respectively. Then, the release profile became constant with time, indicating cessation of curcumin release.75 Clearly, the drug uptake took place close to the mouth channel or onto the nanoporous surface of the carriers, which caused an increase in the release rate of the drug. In other words, the presence of drug in the outer pores of mesoporous materials76 slows the drug release as a result of the highly ionizable phenolic acid group present on the nanoporous surface. There are unreleased curcumin in the carriers because of the intermolecular hydrogen bonding between the drug and hydroxyl groups located on the surface.77 Therefore, the reduced electrostatic attraction promoted faster release from mesoporous carriers. This profile was confirmed by the zeta potential for NPA-6 (+3 mV) and CUR (−13 mV). Curcumin has a hard Lewis base feature with a pKa of 8.3 and is well known as a negatively charged drug that gets protonated in the acidic medium of the in vitro test and altered to ionic form, which undergoes fast release, and the solubility increases in SGF.78 Therefore, the release profile is promoted faster in this medium by considering the high contact between the aggregated drug on the nanoporous surface and the acidic release medium;79 this interaction is very weak in the presence of an acidic medium. On the other hand, about 43, 38, 36, 50 and 68% curcumin were released from SIF at the same supports over a period of 12 h (Fig. 6b). It was observed that NPA-100 with high pore volume is a super carrier for curcumin release in the both media (79% in SGF and 68% in SIF). Large pore volume makes it facile for the diffusion and adsorption of biomolecules.80,81 Consequently, this profile of drug showed that NPA-100 can be investigated as a suitable carrier for curcumin release. In addition, different surface areas, pore volumes and pore sizes in nanocarriers result in difference in the time needed for the drug molecules to diffuse from the pores into media.82 Adsorption test of CUR was carried out for NPA-n mesopores. All NPA-0, NPA-24, NPA-30, NPA-56 and NPA-100 samples exhibited adsorption capacities of 4.27, 5.76, 5.37, 4.65 and 5.91 mg. The NPA-100 has high capacity for adsorption of drug and is a suitable carrier for drug. Moreover, based on these results, it seems that the adsorption and release of CUR will be mainly affected by the electrostatic attraction.83
 |
| | Fig. 6 In vitro release behavior of curcumin loaded NPA-n in (a) SGF and (b) SIF. | |
 |
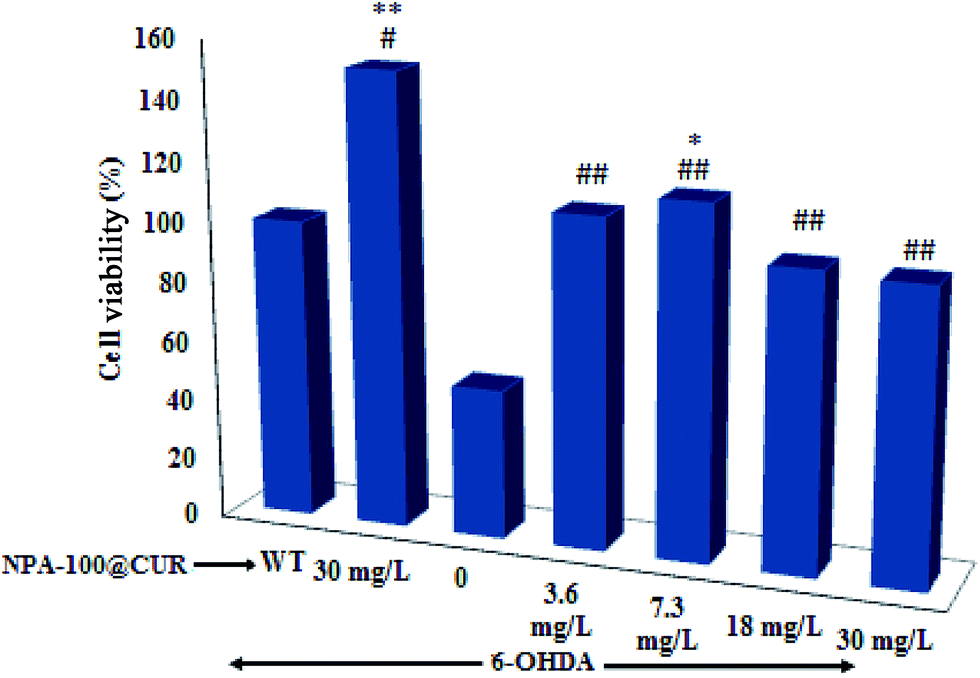
| | Fig. 7 The protecting effect of NPA-100@CUR on SH-SY5Y cells. Each column represent data collected from two separate experiments each carried out in triplicate. Statistical differences between samples treated with various concentrations of the drug with the wild-type (WT) cells are indicated by * or **, whereas their differences with the untreated control (column 3) are indicated by ##. 6-OHDA, 6-hydroxy dopamine; CUR, curcumin. | |
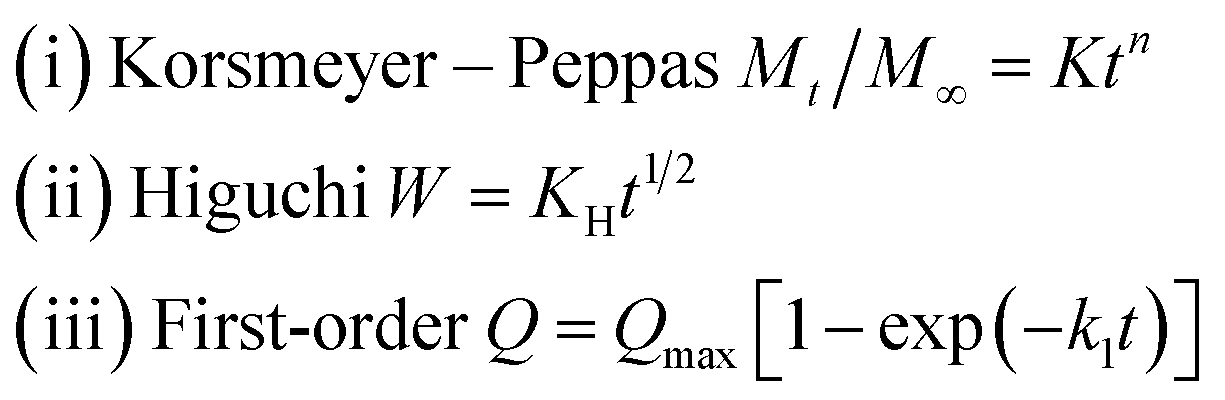
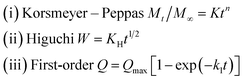
3.7. Release kinetic
To study the characteristics and the kinetics of released curcumin from all supports, we applied the first-order, Korsmeyer–Peppas and Higuchi models (eqn (3)), and the data are presented in Table 2:| |
 | (3) |
where Mt/M∞ is the fractional CUR release percentage at time t; K, KH and K1 are the rate constants; W is the proportion of drug release at time t; Q is the amount of drug release as a function of time; Qmax is the maximum amount of drug release and n is the diffusional exponent that shows the drug transport mechanism. Based on the Korsmeyer–Peppas equation, the values of n ≤ 0.45 are well known for Fickian diffusion. The values of n between 0.45 and 0.89 are attributed to non-Fickian or anomalous transport. An exponent value of 0.89 is indicative of case II transport and typical zero-order release for n > 0.89, respectively.84 Fitting of the NPA-n@CUR to the Korsmeyer–Peppas model shows n values less than 0.45 for the samples in SGF, which followed a Fickian diffusion mechanism, and the initial release is fast in these cases.85 On the other hand, the n value for SIF was between 0.48 and 0.63, defining a non-Fickian diffusion process. Next, the kinetics parameter of the Higuchi model was evaluated. The data for NPA-n@CUR at pH = 1.2 and pH = 6.8 show that the entire release system followed this model because of their higher linear correlation coefficients (r2 > 0.94). The correlation coefficient values of different formulations are low in the first-order model. Thus, this model was not used to distinguish the mechanism in NPA-n@CUR. Moreover, from the Korsmeyer–Peppas and the Higuchi model, good linear fits were achieved at pH = 6.8.
Table 2 Results of kinetic fitting parameters of the in vitro CUR released from different supportsa
| Release media |
Formula |
First-order model, R2 |
Higuchi model, R2 |
Korsmeyer–Peppas model |
| n |
R2 |
| K, rate constant; n, the release exponent; R, correlation coefficient. |
| SGF (pH = 1.2) |
NPA-0@CUR |
0.7578 |
0.9434 |
0.22 |
0.7299 |
| NPA-24@CUR |
0.7361 |
0.9434 |
0.19 |
0.6886 |
| NPA-30@CUR |
0.7634 |
0.9434 |
0.20 |
0.6998 |
| NPA-56@CUR |
0.7634 |
0.9434 |
0.09 |
0.4050 |
| NPA-100@CUR |
0.7458 |
0.9434 |
0.21 |
0.7147 |
| SIF (pH = 6.8) |
NPA-0@CUR |
0.789 |
0.9845 |
0.48 |
0.9380 |
| NPA-24@CUR |
0.7989 |
0.9845 |
0.55 |
0.9486 |
| NPA-30@CUR |
0.9744 |
0.9434 |
0.51 |
0.9486 |
| NPA-56@CUR |
0.7815 |
0.9434 |
0.63 |
0.9753 |
| NPA-100@CUR |
0.7567 |
0.9845 |
0.60 |
0.9701 |
3.8. Cell viability
The cell viability assay showed that while treatment of SH-SY5Y cells with 6-OHDA per second reduced the cell viability to 56%, exposure of the cells to NPA-100@CUR neutralized the toxicity and boosted cell viability (P < 0.01), and 7.3 mg L−1 of the drug increased the viability to 96% (Fig. 7). However, beyond this concentration of the drug, cell viability showed no tangible increase. As shown in Fig. 7, treatment with the drug per second increased the cell viability by over 140%, indicating that NPA-100@CUR has stimulated cell growth as its mechanism of cell protection against toxicity.
4. Conclusion
In summary, for the first time, TBAB and P123 were found as new template mixtures for the synthesis of nanoporous amorphous alumina materials with various porosities and zeta potential charges (ζ = +3 to +30). Using TBAB alone demonstrated an incredibly large pore volume (2 cm3 g−1) of alumina materials. Enhancement of TBAB versus P123, also, increased the positive surface charge up to +30 for NPA-100. Significant improvement in curcumin release with diminished initial burst was particularly observed for NPA-100@CUR. Considering kinetic data, the Higuchi and Korsmeyer–Peppas models were chosen as the best parent models for NPA-n@CUR at pH = 6.8. In addition, the MTT assay showed the best enhanced cell viability of 96% for NPA-100@CUR.
Conflict of interest
There are no conflicts of interest to declare.
Acknowledgements
We thank Chemistry & Chemical Engineering Research Center of Iran (CCERCI) for making the conditions to accomplish this study in CCERCI as well as Dr Gardaneh for MTT tests and Mr Forouzandeh for reviewing the manuscript.
References
- C. Detavernier, J. Dendooven, S. P. Sree, K. F. Ludwig and J. A. Martens, Chem. Soc. Rev., 2011, 40, 5242–5253 RSC.
- R. E. Morris and P. S. Wheatley, Angew. Chem., Int. Ed., 2008, 47, 4966–4981 CrossRef CAS PubMed.
- B. Yahyaei and S. Azizian, Chem. Eng. J., 2012, 209, 589–596 CrossRef CAS.
- L. Nie, A. Meng, J. Yu and M. Jaroniec, Sci. Rep., 2013, 3, 3215 CrossRef PubMed.
- D. Bradshaw, A. Garai and J. Huo, Chem. Soc. Rev., 2012, 41, 2344–2381 RSC.
- W. Schwieger, A. G. Machoke, T. Weissenberger, A. Inayat, T. Selvam, M. Klumpp and A. Inayat, Chem. Soc. Rev., 2016, 45, 3353–3376 RSC.
- C. Liang, Z. Li and S. Dai, Angew. Chem., Int. Ed., 2008, 47, 3696–3717 CrossRef CAS PubMed.
- B. Liu and R. T. Baker, J. Mater. Chem., 2008, 18, 5200 RSC.
- I. Tamiolakis, I. N. Lykakis, A. P. Katsoulidis and G. S. Armatas, Chem. Commun., 2012, 48, 6687 RSC.
- A. Khazraei, A. Tarlani, N. Naderi, J. Muzart, Z. A. Kaabi and M. Eslami-moghadam, Appl. Surf. Sci., 2017, 422, 873–882 CrossRef CAS.
- Y. Zhang, Z. Zhi, T. Jiang, J. Zhang, Z. Wang and S. Wang, J. Controlled Release, 2010, 145, 257–263 CrossRef CAS PubMed.
- M. Sari Yilmaz, A. Palantoken and S. Piskin, J. Non-Cryst. Solids, 2016, 437, 80–86 CrossRef CAS.
- B. Abedi, R. A. Tarlani, S. Jamehbozorgi and A. Niazi, J. Sol-Gel Sci. Technol., 2017, 1–12 Search PubMed.
- K. Niesz, P. Yang and G. A. Somorjai, Chem. Commun., 2005, 1986–1987 RSC.
- A. Tarlani, M. Abedini, M. Khabaz and M. M. Amini, J. Colloid Interface Sci., 2005, 292, 486–492 CrossRef CAS PubMed.
- J. N. D. De León, V. Petranovskii, J. A. De Los Reyes, G. Alonso-Nuñez, T. A. Zepeda, S. Fuentes and J. L. García-Fierro, Appl. Catal., A, 2014, 472, 1–10 CrossRef.
- S. Ghosh, K. P. Dey and M. K. Naskar, J. Am. Ceram. Soc., 2013, 96, 28–31 CrossRef CAS.
- J. G. Seo, M. H. Youn and I. K. Song, Int. J. Hydrogen Energy, 2009, 34, 1809–1817 CrossRef CAS.
- Q. Wu, F. Zhang, J. Yang, Q. Li, B. Tu and D. Zhao, Microporous Mesoporous Mater., 2011, 143, 406–412 CrossRef CAS.
- Q. Yuan, A.-X. Yin, C. Luo, L.-D. Sun, Y.-W. Zhang, W.-T. Duan, H.-C. Liu and C.-H. Yan, J. Am. Chem. Soc., 2008, 130, 3465–3472 CrossRef CAS PubMed.
- F. Huang, Y. Zheng, Y. Xiao, Y. Zheng, G. Cai and K. Wei, Mater. Lett., 2011, 65, 244–246 CrossRef CAS.
- A. Tarlani and M. P. Zarabadi, Solid State Sci., 2013, 16, 76–80 CrossRef CAS.
- R. Bleta, P. Alphonse, L. Pin, M. Gressier and M.-J. Menu, J. Colloid Interface Sci., 2012, 367, 120–128 CrossRef CAS PubMed.
- M. U. Anu Prathap, B. Thakur, S. N. Sawant and R. Srivastava, Colloids Surf., B, 2012, 89, 108–116 CrossRef CAS PubMed.
- A. S. Poyraz, C. Albayrak and Ö. Dag, Microporous Mesoporous Mater., 2008, 115, 548–555 CrossRef CAS.
- E. Force, Langmuir, 2001, 1, 5742–5747 Search PubMed.
- R. Wang, Y. Tang and Y. Wang, Langmuir, 2014, 30, 1957–1968 CrossRef CAS PubMed.
- B. L. Newalkar, Microporous Mesoporous Mater., 2004, 73, 161–170 CrossRef CAS.
- A. S. Poyraz, C. Albayrak and Ö. Dag, Microporous Mesoporous Mater., 2008, 115, 548–555 CrossRef CAS.
- R. S. Prakasham, G. S. Devi, K. R. Laxmi and C. S. Rao, J. Phys. Chem. C, 2007, 111, 3842–3847 CAS.
- L. Wang, X. Chen, J. Zhan and Y. Chai, J. Phys. Chem. B, 2005, 3189–3194 CrossRef CAS PubMed.
- B. B. Aggarwal and K. B. Harikumar, Int. J. Biochem. Cell Biol., 2009, 41, 40–59 CrossRef CAS PubMed.
- M. M. Yallapu, M. Jaggi and S. C. Chauhan, Drug Discovery Today, 2012, 17, 71–80 CrossRef CAS PubMed.
- Y. Jaisin, A. Thampithak, B. Meesarapee, P. Ratanachamnong, A. Suksamrarn, L. Phivthong-ngam, N. Phumala-Morales, S. Chongthammakun, P. Govitrapong and Y. Sanvarinda, Neurosci. Lett., 2011, 489, 192–196 CrossRef CAS PubMed.
- J. K. Lin, M. H. Pan and S. Y. Lin-Shiau, BioFactors, 2000, 13, 153–158 CrossRef CAS PubMed.
- K. M. Nelson, J. L. Dahlin, J. Bisson, J. Graham, G. F. Pauli and M. A. Walters, J. Med. Chem., 2017, 60, 1620–1637 CrossRef CAS PubMed.
- I. M. El-Sherbiny and H. D. C. Smyth, Mol. Pharmaceutics, 2012, 9, 269–280 CrossRef CAS PubMed.
- V. S. Gota, G. B. Maru, T. G. Soni, T. R. Gandhi, N. Kochar and M. G. Agarwal, J. Agric. Food Chem., 2010, 58, 2095–2099 CrossRef CAS PubMed.
- C.-H. Liu and F.-Y. Chang, Chem. Pharm. Bull., 2011, 59, 172–178 CrossRef CAS PubMed.
- S. Kim, R. Diab, O. Joubert, N. Canilho and A. Pasc, Colloids Surf., B, 2016, 140, 161–168 CrossRef CAS PubMed.
- P. Huang, B. Zeng, Z. Mai, J. Deng, Y. Fang, W. Huang, H. Zhang, J. Yuan, Y. Wei and W. Zhou, J. Mater. Chem. B, 2016, 4, 46–56 RSC.
- Y. Zou, J. Zhong, R. Pan, Z. Wan, J. Guo, J. Wang, S. Yin and X. Yang, Int. J. Food Sci. Technol., 2017, 1–8 Search PubMed.
- S. F. Chin, K. S. Iyer, M. Saunders, G. S. P. Tim, C. Buckley, M. Paskevicius and C. L. Raston, Chem.–A Eur. J., 2009, 15, 5661–5665 CrossRef CAS PubMed.
- V. J. Sawant, S. R. Bamane, R. V. Shejwal and S. B. Patil, J. Magn. Magn. Mater., 2016, 417, 222–229 CrossRef CAS.
- S. Shruti, A. J. Salinas, E. Ferrari, G. Malavasi, G. Lusvardi, A. L. Doadrio, L. Menabue and M. Vallet-Regi, Microporous Mesoporous Mater., 2013, 180, 92–101 CrossRef CAS.
- T. Asefa and Z. Tao, Chem. Res. Toxicol., 2012, 25, 2265–2284 CrossRef CAS PubMed.
- S. Nastase, L. Bajenaru, C. Matei, R. A. Mitran and D. Berger, Microporous Mesoporous Mater., 2013, 182, 32–39 CrossRef CAS.
- S. K. Das, S. Kapoor, H. Yamada and A. J. Bhattacharyya, Microporous Mesoporous Mater., 2009, 118, 267–272 CrossRef CAS.
- S. San Roman, J. Gullón, M. del Arco and C. Martín, J. Pharm. Sci., 2016, 105, 2146–2154 CrossRef CAS PubMed.
- X. Wang, P. Liu and Y. Tian, Microporous Mesoporous Mater., 2011, 142, 334–340 CrossRef CAS.
- C. Sangwichien, G. L. Aranovich and M. D. Donohue, Colloids Surf., A, 2002, 206, 313–320 CrossRef CAS.
- J. Xu, A.-R. Ibrahim, X. Hu, Y. Hong, Y. Su, H. Wang and J. Li, Microporous Mesoporous Mater., 2016, 231, 1–8 CrossRef CAS.
- J. Yanyan, W. Chunyu, Z. Yongcun, S. Jiangwei, W. Jingyuan, L. Fei and X. Feng-Shou, J. Phys. Chem. C, 2008, 112, 19367–19371 Search PubMed.
- X. Liu, Z. Q. Shen, H. H. Xiong, Y. Chen, X. N. Wang, H. Q. Li, Y. T. Li, K. H. Cui and Y. Q. Tian, Microporous Mesoporous Mater., 2015, 204, 25–33 CrossRef CAS.
- L. Wang, X. Chen, J. Zhan, Y. Chai, C. Yang, L. Xu, W. Zhuang and B. Jing, 2005, 3189–3194.
- A. Manuscript, R. Society, A. Manuscripts, T. A. Manuscript, A. Manuscripts, R. Society and A. Manuscript.
- H. Xia, G. Wan, G. Chen and Q. Bai, Mater. Lett., 2017, 192, 5–8 CrossRef CAS.
- A. S. Poyraz and Ö. Dag, J. Phys. Chem. C, 2009, 113(43), 18596–18607 CAS.
- D. Berger, L. Bajenaru, S. Nastase, R. Mitran and C. Matei, Microporous Mesoporous Mater., 2014, 206, 150–160 CrossRef.
- J. Li, L. Xu, H. Wang, B. Yang, H. Liu, W. Pan and S. Li, Mater. Sci. Eng., C, 2016, 59, 710–716 CrossRef CAS PubMed.
- R. Chakravarty, R. Ram, R. Mishra, D. Sen, S. Mazumder, M. R. A. Pillai and A. Dash, Ind. Eng. Chem. Res., 2013, 52, 11673–11684 CrossRef CAS.
- G. Xue, X. Huang, N. Zhao, F. Xiao and W. Wei, RSC Adv., 2015, 5, 22972 RSC.
- A. Boumaza, L. Favaro, J. Lédion, G. Sattonnay, J. B. Brubach, P. Berthet, A. M. Huntz, P. Roy and R. Tétot, J. Solid State Chem., 2009, 182, 1171–1176 CrossRef CAS.
- Y. Hu, C. Li, F. Gu and J. Ma, Ind. Eng. Chem. Res., 2007, 46, 8004–8008 CrossRef CAS.
- M. Anwar, I. Ahmad, M. H. Warsi, S. Mohapatra, N. Ahmad, S. Akhter, A. Ali and F. J. Ahmad, Eur. J. Pharm. Biopharm., 2015, 96, 162–172 CrossRef CAS PubMed.
- C. S. Mangolim, C. Moriwaki, A. C. Nogueira, F. Sato, M. L. Baesso, A. M. Neto and G. Matioli, Food Chem., 2014, 153, 361–370 CrossRef CAS PubMed.
- A. Anitha, M. Sreeranganathan, K. P. Chennazhi, V. K. Lakshmanan and R. Jayakumar, Eur. J. Pharm. Biopharm., 2014, 88, 238–251 CrossRef CAS PubMed.
- S. M. Grant and M. Jaroniec, J. Mater. Chem., 2012, 22, 86–92 RSC.
- J. Li, L. Xu, B. Yang, H. Wang, Z. Bao, W. Pan and S. Li, Int. J. Pharm., 2015, 492, 191–198 CrossRef CAS PubMed.
- Y. Hu, J. Wang, Z. Zhi, T. Jiang and S. Wang, J. Colloid Interface Sci., 2011, 363, 410–417 CrossRef CAS PubMed.
- S. Nastase, L. Bajenaru, C. Matei, R. A. Mitran and D. Berger, Microporous Mesoporous Mater., 2013, 182, 32–39 CrossRef CAS.
- J. He, C. Yang, X. Xiong and B. Jiang, J. Polym. Sci., Part A: Polym. Chem., 2012, 50, 2889–2897 CrossRef CAS.
- M. A. Elsheikh, Y. S. Elnaggar, E. Y. Gohar and O. Y. Abdallah, Int. J. Nanomed., 2012, 7, 3787–3802 CAS.
- D. Li, X. Huang, Y. Wu, J. Li, W. Cheng, J. He, H. Tian and Y. Huang, Biomater. Sci., 2016, 4, 272–280 RSC.
- S. S. Mandal, D. Jose and A. J. Bhattacharyya, Mater. Chem. Phys., 2014, 1–7 Search PubMed.
- R. A. García-Muñoz, V. Morales, M. Linares, P. E. González, R. Sanz and D. P. Serrano, J. Mater. Chem. B, 2014, 2, 7996–8004 RSC.
- S. Sundar, R. Mariappan and S. Piraman, Powder Technol., 2014, 266, 321–328 CrossRef CAS.
- M. Salem, S. Rohani and E. R. Gillies, RSC Adv., 2014, 4, 10815 RSC.
- A. G. B. Pereira, A. R. Fajardo, S. Nocchi, C. V. Nakamura, A. F. Rubira and E. C. Muniz, Carbohydr. Polym., 2013, 98, 711–720 CrossRef CAS PubMed.
- S. M. L. dos Santos, K. A. B. Nogueira, M. de Souza Gama, J. D. F. Lima, I. J. da Silva Júnior and D. C. S. de Azevedo, Microporous Mesoporous Mater., 2013, 180, 284–292 CrossRef.
- Y. Javadzadeh, R. Bairami Atashgah, M. Barzegar-Jalali, F. Soleimani, G. Mohammadi, A. Sabzevari and K. Adibkia, Colloids Surf., B, 2014, 116, 751–756 CrossRef CAS PubMed.
- Y. Hu, J. Wang, Z. Zhi, T. Jiang and S. Wang, J. Colloid Interface Sci., 2011, 363, 410–417 CrossRef CAS PubMed.
- M. Mi, X. Dan, S. Liu, J. Ma and J. Hua, Microporous Mesoporous Mater., 2014, 199, 40–49 CrossRef.
- N. A. Peppas and J. J. Sahlin, Int. J. Pharm., 1989, 57, 169–172 CrossRef CAS.
- D. Carriazo, M. del Arco, C. Martín, C. Ramos and V. Rives, Microporous Mesoporous Mater., 2010, 130, 229–238 CrossRef CAS.
|
| This journal is © The Royal Society of Chemistry 2017 |
Click here to see how this site uses Cookies. View our privacy policy here. 
 Open Access Article
 This Open Access Article is licensed under a Creative Commons Attribution-Non Commercial 3.0 Unported Licence
 *b and
Hamid Reza Aghabozorg*ac
*b and
Hamid Reza Aghabozorg*ac