 Open Access Article
Creative Commons Attribution 3.0 Unported Licence
A dodecanethiol-functionalized Ag nanoparticle-modified ITO anode for efficient performance of organic light-emitting devices†
Jayaraman Jayabharathi *,
Ganapathy Abirama Sundari,
Venugopal Thanikachalam
 ,
Palanivel Jeeva and
Sekar Panimozhi
Department of Chemistry, Annamalai University, Annamalainagar 608 002, Tamilnadu, India. E-mail: jtchalam2005@yahoo.co.in; Tel: +91 9443940735
First published on 8th August 2017
Abstract
The electroluminescence intensity of a dodecanethiol-functionalized silver (DT-Ag) NP/CPB:Ir(mpidmb)2(acac) film was increased by about 2.23 times in comparison with that of a control device, CPB:Ir(mpidmb)2(acac), due to coupling between excitons of emissive layer and the localized surface plasmon resonance (LSPR) of DT-Ag NPs. The current efficiency of a device with a DT-Ag NPs layer at 100 cd cm−2 (42.3 cd A−1) was 17.0 cd A−1 higher than that of the control device (25.3 cd A−1). The increase in current efficiency in the case of DT-Ag NP-coated devices was strongly related to the energy transfer between radiated light generated from the CBP:Ir(mpidmb)2(acac) emissive layer and the LSPR excited by the DT-Ag NPs layer.
1. Introduction
Organic light-emitting devices (OLEDs) have received attention from researchers for their applications in flexible displays and lighting sources.1–4 Their external quantum efficiency (EQE) is affected via tuning their electron–hole recombination, spin static factor, photoluminescence efficiency, and out-coupling efficiency.5–7 Although the internal quantum efficiency (ηint) of OLEDs has been increased (∼100%), their external quantum efficiency is comparatively low (∼30%) for applications in mass production.8–14 Metal-enhanced luminescence has been analysed using silver and gold nanoparticles15–17 due to their surface plasmon resonance (SPR), and other metals such as copper18 and aluminium19 and semiconducting materials such as zinc oxide20 have also been reported to enhance luminescence and device lifetime. Metal-enhanced luminescence involves the interaction of luminophores with metallic nanoparticles owing to an increase in radiative rate after the emission is coupled with far-field scattering by enhancing their absorption upon an increase in the local electric field. Spectral overlap between the SPR of metal nanoparticles and the emission of the luminophore plays a key role in luminescence enhancement.21–25 Several materials have been studied as an HIL in OLEDs such as metal oxides,26 RuO,27 O2 plasma-treated Ag anodes,28 poly(bis[6-bromo-N-(2-ethylhexyl)carbazol-3-yl]),29 MoO3,30 copper(II) phthalocyanine,31 poly(3,4-ethylenedioxythiophene):poly(styrene sulfonate) (PEDOT:PSS),32 transition metal oxides,33 nanocarbon electrodes,34 and graphene oxide.35 However, the utilization of noble metal nanoparticles as an HIL will provide an additional benefit in the form of plasmonic enhancement; in other words, coupling between surface plasmons of the metal and the emission of the device contributes to optical enhancement, which further increases device efficiency.Metal nanoparticles (NPs) have been utilised as a hole injection layer in phosphorescent OLEDs to increase their external efficiency36–42 by the effective coupling of excitons in the emissive layer with the localized surface plasmon resonance (LSPR) of the metal NPs.43 However, an increase in efficiency (∼25%) was achieved in OLEDs with Au NPs as a hole injection layer owing to the agglomeration of Au NPs. A significant increase in electroluminescence intensity was obtained with Au-doped ZnO as a hole injection layer.6 However, the agglomeration of Au NPs in ZnO causes variations in LSPR wavelength. Hence, detailed investigations are necessary to improve device performance using inorganic–organic nanocomposites.
Here, we report an increase in device efficiency using dodecanethiol-functionalized Ag (DT-Ag) NPs as a hole injection layer and iridium(III) bis-4-(E)-2-(1-(4-methoxyphenyl)-1H-phenanthro[9,10-d]imidazolato-N,C2)(acetylacetonate) [Ir(mpidmb)2(acac)] as the emissive layer. The electroluminescence (EL) intensity of the DT-Ag NPs/CPB:Ir(mpidmb)2(acac) film was increased by a factor of about 2.23 in comparison with that of a control device based on CPB:Ir(mpidmb)2(acac) owing to coupling between excitons in the emissive layer and the LSPR of the DT-Ag NPs. DT-Ag NPs with a density of 35 μm−2 at the anode/HTL junction in OLEDs using CBP:Ir(mpidmb)2(acac) as the emissive layer led to an enhancement in emission intensity, which was attributed to an increase in the radiative rate (kr) of the OLEDs. The increased current efficiency of devices with a DT-Ag NPs layer was strongly related to energy transfer between radiated light generated from the CBP:Ir(mpidmb)2(acac) emissive layer and the LSPR excited by the DT-Ag NPs layer.
2. Experiment and characterization
The chemicals required for synthesizing the Ir(mpidmb)2(acac) emissive layer (Scheme S1†) and the nanomaterials, namely, bare Ag and DT-Ag NPs, were purchased from Sigma-Aldrich. To confirm the structure of the synthesized materials, spectral measurements were carried out using a Bruker spectrometer (400 MHz) for NMR and an Agilent LCMS VL SD for the mass of samples. The oxidation potential measured by a CHI 630A potentiostat electrochemical analyzer was used to determine the HOMO energy of the emissive layer. Absorption (λabs) and band gap information were recorded using a Lambda 35 spectrophotometer and a Lambda 35 with an RSA-PE-20 integrating sphere, respectively. The emission wavelength (λemi) of Ir(mpidmb)2(acac) was measured using a PerkinElmer LS55 fluorescence spectrometer, and its quantum yield (QY) was calculated from the equation: , where ϕunk is the unknown QY, ϕstd is the QY of a standard sample, Iunk is the unknown emission intensity, Istd is the emission intensity of the standard, Aunk is the unknown absorbance, Astd is the absorbance of the standard, ηunk is the unknown refractive index, and ηstd is the refractive index of the standard. The required QY of the film was measured with an integrating sphere (quartz plate). The decomposition temperature (Td) and glass transition temperature (Tg) were measured with a PerkinElmer thermal analysis system (10 °C min−1; nitrogen flow rate 100 mL min−1) and a NETZSCH DSC-204 calorimeter (10 °C min−1 under a nitrogen atmosphere), respectively. The morphology of the nanomaterials was studied with a JEOL JEM 2100 high-resolution transmission electron microscope (200 kV; resolution 0.1 nm), and the oxidation state of silver in DT-Ag NPs was determined by XPS (X-ray photoelectron spectroscopy) using an ESCA-3 Mark II spectrometer (VG) with Al Kα (1486.6 eV) radiation. Scanning electron microscopy (SEM) images and energy-dispersive X-ray spectra (EDS) were recorded with a JEOL JSM-5610 microscope equipped with a back electron (BE) detector and an FEI Quanta FEG microscope, respectively. TEM (transmission electron microscopy) images of the nanomaterials were recorded using a Philips transmission electron microscope with a 200 kV electron beam, and SAED (selected-area electron diffraction) patterns were recorded with a Philips transmission electron microscope with a CCD camera (200 kV). Powder XRD patterns were recorded with an Equinox 1000 diffractometer using Cu Kα radiation (1.5406 Å; current 30 mA; 40 kV).
2.1. Fabrication of OLEDs
Green OLEDs with a configuration of ITO without (I) or with DT-Ag NPs at a density of 6 μm−2 (II), 35 μm−2 (III) or 45 μm−2 (IV)/NPB (13 nm)/CBP:Ir(mpidmb)2(acac) (30 nm)/LiF (1 nm)/Al (100 nm) were made by vacuum deposition (5 × 10⁻⁶ torr) on ITO with a resistance of 20 Ω per square. Ir(mpidmb)2(acac) and LiF were used as the emissive layer (EML) and electron transport layer (ETL), respectively. Dispersion of the bare colloidal solution gave a very low density of less than 5 μm−2. Centrifugation at a low speed of 2000 rpm yielded a density of 6 μm−2, whereas centrifugation at higher speeds of 5000 rpm and 6000 rpm led to a density of 35 μm−2 and 45 μm−2, respectively. Furthermore, an increase in centrifugation speed gave a higher density of Ag NPs with notable agglomeration. Hence, we set a limit at the optimized density of 45 μm−2. The spin coating of all samples was carried out at 3000 rpm for 30 seconds. The hole injection properties of DT-Ag NPs were analysed by the fabrication of hole-only devices with a configuration of ITO (with or without DT-Ag NPs)/NPB/LiF/Al. The deposition of organic materials onto ITO was carried out at a rate of 0.1 nm s−1, and LiF was thermally evaporated on the surface of the organic layer. The thicknesses of all layers were measured using a quartz crystal thickness monitor, and measurements of current density (J)–voltage (V)–luminescence (L) (J–V–L) were made with a Keithley 2400 source meter.2.2. Computational details
The optimized geometry and HOMO and LUMO contour maps of Ir(mpidmb)2(acac)44 were determined with the Gaussian 09 package [DFT/B3LYP/LANL2DZ/6-31G(d,p)].2.3. 4-((E)-2-(1-(4-Methoxyphenyl)-1H-phenanthro[9,10-d]imidazol-2-yl)vinyl)-N,N-dimethylbenzenamine (mpidmb)
The vinyl-substituted phenanthroimidazole was synthesised by refluxing 9,10-phenanthrenequinone (5 mmol), (E)-3-(4-(dimethylamino)phenyl)acrylaldehyde (5 mmol), 4-methoxybenzenamine (6 mmol) and ammonium acetate (61 mmol) in ethanol (20 mL) for 12 h under an N2 stream and was extracted with dichloromethane. After purification, the compound was characterised by spectral techniques. Mp 244 °C. Anal. calcd for C32H27N3O: C, 81.85; H, 5.80; N, 8.95. Found: C, 81.82; H, 5.78; N, 8.92. 1H NMR (400 MHz, CDCl3): δ 2.98 (s, 6H), 3.96 (s, 3H), 6.42 (d, J = 16.0 Hz, 1H), 6.57 (s, 3H), 6.70 (d, J = 8.4 Hz, 1H), 6.78 (d, J = 8.4 Hz, 1H), 7.07 (d, J = 16.4 Hz, 1H), 7.16 (d, J = 8.4 Hz, 2H), 7.29–7.37 (m, 4H), 7.54–7.64 (m, 3H), 8.31 (s, 1H), 8.67 (d, J = 8.0 Hz, 1H). 13C NMR (100 MHz, CDCl3): δ 40.24, 55.69, 112.09, 115.26, 117.92, 122.92, 124.08, 125.36, 127.29, 128.44, 129.96, 132.04, 137.55, 139.86, 140.63, 141.40, 146.53, 150.51, 151.41. MALDI-TOF MS: m/z 469.9 [M+]; calcd 469.6.2.4. Iridium(III) bis-4-(E)-2-(1-(4-methoxyphenyl)-1H-phenanthro[9,10-d]imidazolato-N,C2)(acetylacetonate) [Ir(mpidmb)2(acac)]
The vinyl-substituted phenanthroimidazole (mpidmb) (2.2 mmol) and iridium(III) chloride trihydrate (1 mmol) in 2-ethoxyethanol![[thin space (1/6-em)]](https://www.rsc.org/images/entities/char_2009.gif) :
:![[thin space (1/6-em)]](https://www.rsc.org/images/entities/char_2009.gif) H2O (3
H2O (3![[thin space (1/6-em)]](https://www.rsc.org/images/entities/char_2009.gif) :
:![[thin space (1/6-em)]](https://www.rsc.org/images/entities/char_2009.gif) 1) were refluxed under an N2 stream at 120 °C, and the dimer that formed (1 mmol) was refluxed with acetylacetone (2.2 mmol) and potassium carbonate (2.5 mmol) in 2-ethoxyethanol (5 mL) at 120 °C under an N2 stream. The green iridium(III) acetylacetonate complex was washed with hexane and petroleum ether and characterized by NMR spectral techniques.45 Mp 244 °C. Anal. calcd for C69H64IrN6O4: C, 67.19; H, 5.23; N, 6.81. Found: C, 67.14; H, 5.20; N, 6.79. 1H NMR (400 MHz, CDCl3): δ 1.88 (s, 6H), 2.54 (s, 6H), 2.91 (s, 12H), 5.29 (s, 1H), 6.57 (d, J = 8.8 Hz, 1H), 7.18–7.27 (m, 6H), 7.38 (s, 1H), 7.45–7.49 (t, 6H), 7.60–7.73 (m, 12H), 8.46 (s, 1H), 8.66–8.77 (m, 8H), 8.87 (d, J = 7.6 Hz, 4H). 13C NMR (100 MHz, CDCl3): δ 9.60, 11.50, 40.15, 55.56, 111.50, 120.73, 122.75, 123.04, 123.44, 124.00, 124.35, 125.25, 126.10, 127.10, 128.10, 128.94, 130.25, 130.72, 139.56, 150.39. MALDI-TOF MS: m/z 1233.9 [M+]; calcd 1233.6.
1) were refluxed under an N2 stream at 120 °C, and the dimer that formed (1 mmol) was refluxed with acetylacetone (2.2 mmol) and potassium carbonate (2.5 mmol) in 2-ethoxyethanol (5 mL) at 120 °C under an N2 stream. The green iridium(III) acetylacetonate complex was washed with hexane and petroleum ether and characterized by NMR spectral techniques.45 Mp 244 °C. Anal. calcd for C69H64IrN6O4: C, 67.19; H, 5.23; N, 6.81. Found: C, 67.14; H, 5.20; N, 6.79. 1H NMR (400 MHz, CDCl3): δ 1.88 (s, 6H), 2.54 (s, 6H), 2.91 (s, 12H), 5.29 (s, 1H), 6.57 (d, J = 8.8 Hz, 1H), 7.18–7.27 (m, 6H), 7.38 (s, 1H), 7.45–7.49 (t, 6H), 7.60–7.73 (m, 12H), 8.46 (s, 1H), 8.66–8.77 (m, 8H), 8.87 (d, J = 7.6 Hz, 4H). 13C NMR (100 MHz, CDCl3): δ 9.60, 11.50, 40.15, 55.56, 111.50, 120.73, 122.75, 123.04, 123.44, 124.00, 124.35, 125.25, 126.10, 127.10, 128.10, 128.94, 130.25, 130.72, 139.56, 150.39. MALDI-TOF MS: m/z 1233.9 [M+]; calcd 1233.6.
2.5. Synthesis of dodecanethiol-functionalised silver nanoparticles (DT-Ag NPs)
About 0.1 mL dodecanethiol (DT) was added slowly under stirring to 10 mL of 3 × 10⁻² M AgNO3 in ethanol. Then, 25 mL of a solution of NaBH4 in ethanol was added slowly and stirring was continued for a further 2 h. The reaction mixture was kept at −18 °C for 4 h, and the cooled solution was dried and the powder that formed was washed with toluene followed by alcohol to remove unreacted dodecanethiol.3. Results and discussion
3.1. Characterisation of dodecanethiol-functionalized silver nanoparticles (DT-Ag NPs)
The FT-IR spectra of as-synthesized dodecanethiol-functionalized silver nanoparticles (DT-Ag NPs) and dodecanethiol are displayed in Fig. 1. For dodecanethiol, two bands due to asymmetric [ν(CH2)as] and symmetric [ν(CH2)s] methylene stretching are observed at 2920 and 2850 cm−1, respectively, whereas for DT-Ag NPs these two bands are shifted from 2920 and 2850 cm−1 to 2914 and 2847 cm−1, respectively.46–48 The bands due to twisting, rocking and wagging around 1400–1150 cm−1 indicate that the methylene moieties of the methylene chain adopt a trans zigzag configuration.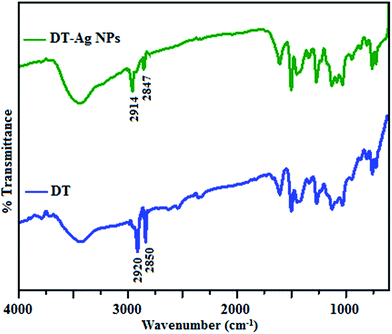 | ||
| Fig. 1 FT-IR spectra of dodecanethiol (DT) and dodecanethiol-functionalized silver nanoparticles (DT-Ag NPs). | ||
The 1H NMR spectra of dodecanethiol and DT-Ag NPs are presented in Fig. 2. The α-methylene and β-methylene groups of DT resonate at 2.50 and 1.62 ppm, respectively, whereas the thiol proton resonates at 1.39 ppm.49–51 The signal of the methyl protons on the C-12 carbon appears at 0.85 ppm,42 whereas the signals of the other protons on the C3–C11 carbons appear as a multiplet at 1.3 ppm.52 The 1H resonances of DT-Ag NPs are broadened in comparison with those of bare DT, which reveals fast spin relaxation due to mutual dipolar interaction with the ordered methylene chain.53 The absence of signals of thiol and α-methylene protons confirms the formation of DT-Ag NPs. The β-methylene protons and those on the C3–C11 and C-12 carbons resonate at 1.72, 1.35 and 0.90 ppm, respectively. The absence of an α-methylene resonance for DT-Ag NPs indicates a strong interaction between sulfur atoms and the nano-Ag surface.54 Furthermore, DFT results confirm stronger bonding between Ag and S (EBE = 2.23 eV), and the calculated Ag–S stretching frequency is 650 cm−1.
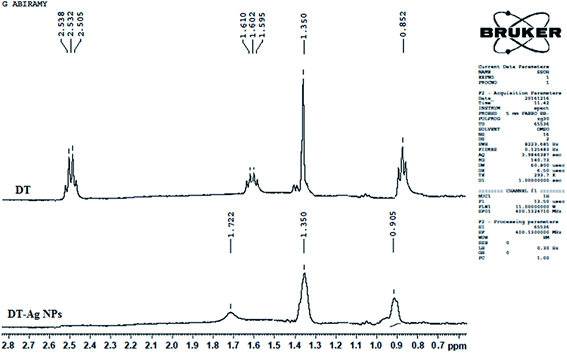 | ||
| Fig. 2 1H NMR spectra of dodecanethiol (DT) and dodecanethiol-functionalized silver nanoparticles (DT-Ag NPs). | ||
The X-ray diffractogram of DT-Ag NPs is shown in Fig. 3. The diffraction peaks at Bragg angles of 38.6° (111), 38.3° (200), 44.0° (220), 64.9° (222) and 74.0° (311) correspond to pure silver. These five specific peaks due to (111), (200), (220), (222) and (311) planes of DT-Ag NPs indicate a face-centered cubic (fcc) structure, and the prominent peaks in the XRD pattern indicate the purity of DT-Ag NPs.55 Additional reflections with peaks at low angles corresponding to large unit cells are also observed for DT-Ag nanoparticles. Such a lattice can only result from the periodic arrangement of DT-Ag NPs: the trans zigzag configuration of capping DT molecules leads to strong interactions of the methylene chain with superlattice structures. The average crystallite size deduced from the Debye–Scherrer equation [D = kλ/β![[thin space (1/6-em)]](https://www.rsc.org/images/entities/char_2009.gif) cos
cos![[thin space (1/6-em)]](https://www.rsc.org/images/entities/char_2009.gif) θ, where D is the average crystal size, k is the Scherrer coefficient, λ is the X-ray wavelength, θ is the Bragg angle, and β is the full width at half maximum intensity] is 7.0 nm and the surface area is 150.93 m2 g−1.
θ, where D is the average crystal size, k is the Scherrer coefficient, λ is the X-ray wavelength, θ is the Bragg angle, and β is the full width at half maximum intensity] is 7.0 nm and the surface area is 150.93 m2 g−1.
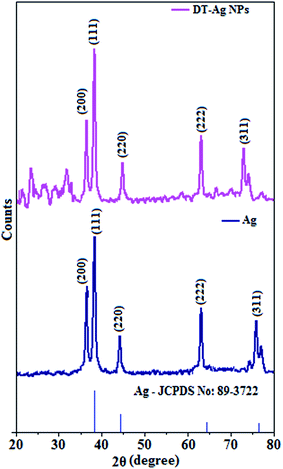 | ||
| Fig. 3 X-ray diffraction patterns of Ag and dodecanethiol-functionalized silver nanoparticles (DT-Ag NPs). | ||
Thermal analysis of DT-Ag NPs showed a gradual weight loss of 35% from 170 °C to 310 °C, which was due to the desorption of chemisorbed DT from the surface of DT-Ag NPs. Furthermore, a sharp endothermic transition peak at 129.1 °C, which appeared below the weight loss temperature, might be attributed to melting of the superlattice of DT-Ag NPs.56 The high thermal decomposition temperature (Td) of DT-Ag NPs will favour film formation in OLEDs (Fig. 4). The metallic nature of silver in DT-Ag NPs was confirmed by XPS analysis (Fig. 5). The single band at 284.9 eV corresponds to C–C bonded atoms in dodecanethiolate. The S 2p signal is somewhat weak, which was attributed to the small scattering cross-section of the sulphur atom and also the presence of a small amount of material.57 The doublet at 162.0 eV and 162.8 eV was attributed to S 2p3/2 and S 2p1/2 peaks of thiolate species, respectively, and peaks due to sulfinate (165.5 eV) as well as sulfonate (168.0 eV) species are completely absent.58 The carbon and sulphur regions of the XPS spectrum are consistent with the presence of dodecanethiolate on silver clusters. The Ag 2p5/2 (368.1 eV) and Ag 2p3/2 (374.2 eV) peaks were attributed to metallic silver (368.0 and 374.0 eV), and the high symmetry of the silver peaks proves that the valence of silver did not change. A TEM image of DT-Ag NPs shows that the particles are dispersed uniformly owing to the attachment of DT ligands on the surface of DT-Ag NPs. The extent of agglomeration of Ag NPs decreased owing to the interaction of DT ligands with the surface of DT-Ag NPs. The TEM image shows the spherical nature of the particles with a size of 7.2 nm (Fig. 6). The d-spacing (2.35 Å) between the lattice fringes of the silver nanocrystals corresponds to the (111) planes of face-centered cubic (fcc) silver and is in accordance with the XRD d-spacing (2.31 Å) between (111) planes of an fcc silver crystal (JCPDS no. 89-3722). The diffraction rings with bright circular spots in the SAED pattern are indexed to the (111), (200), (220), (311) and (222) planes, respectively, of fcc silver (Fig. 6). Fig. 6 reveals that each nanoparticle is separated from its neighbouring nanoparticles, which indicates that the silver nanoparticles were modified by dodecanethiol with a homogeneous size distribution. UV-vis measurements show a surface plasmon resonance absorption at 380 nm,59,60 and the composition of DT-Ag NPs was demonstrated by EDX (Fig. 6). The peaks observed in the range of 3.0–3.5 keV represent the binding energies of sulphur and silver elements, whereas the peaks at 1.2 keV and 2.0 keV represent the binding energies of copper and silicon elements. The copper peaks correspond to the TEM holding grid and the silicon peak corresponds to the detector.
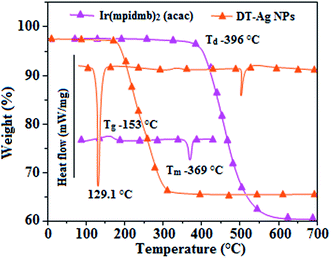 | ||
| Fig. 4 DSC and TGA of dodecanethiol-functionalized silver nanoparticles (DT-Ag NPs) and Ir(mpidmb)2(acac). | ||
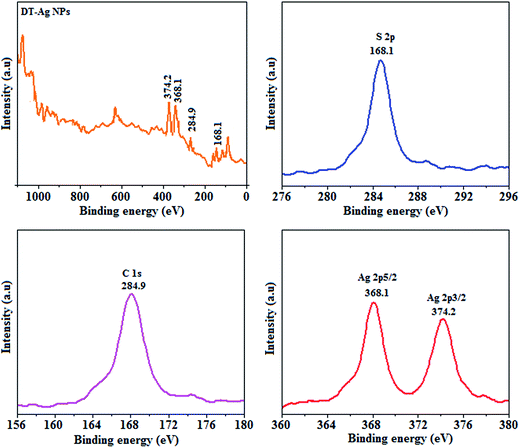 | ||
| Fig. 5 X-ray photoelectron spectra (XPS) of dodecanethiol-functionalized silver nanoparticles (DT-Ag NPs). | ||
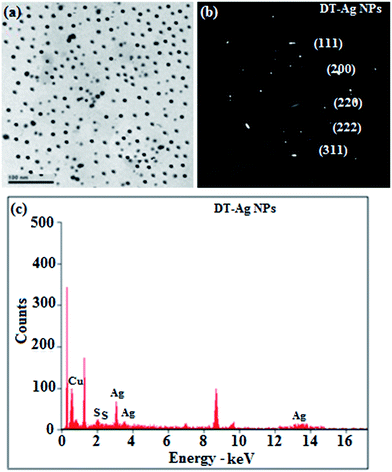 | ||
| Fig. 6 (a) HR-TEM image; (b) SAED pattern; (c) EDAX spectrum of dodecanethiol-functionalized silver nanoparticles (DT-Ag NPs). | ||
3.2. Characterisation of Ir(mpidmb)2(acac) emissive layer
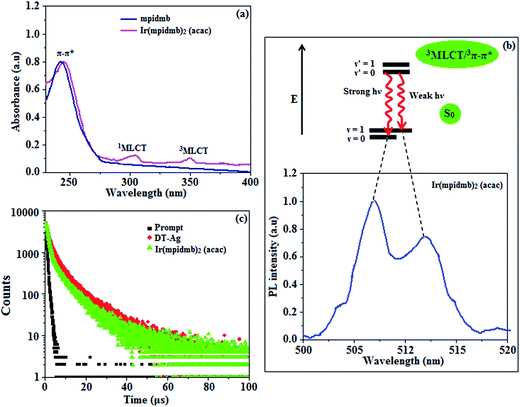
The UV-vis absorption (λabs) spectra of the organometallic complex Ir(mpidmb)2(acac) in CH2Cl2 and the free ligand (mpidmb) are shown in Fig. 7. The intense absorption in the ultraviolet region (248 nm), which occurs at the same energy for mpidmb, arises from a π–π* transition of the cyclometalated ligand. The other two bands at 304 and 345 nm can be attributed to MLCT transitions (spin-allowed) to a singlet excited state [1MLCT ← S0] and a triplet excited state [3MLCT ← S0], respectively, which both originate from the interaction of the ligand with the iridium center of Ir(mpidmb)2(acac). The intensity of the 3MLCT ← S0 transition is closest to that of the 1MLCT ← S0 transition, which shows that the 3MLCT ← S0 transition is strongly symmetry-allowed by spin–orbit coupling.61–68 The spin–orbit coupling was enhanced by the closeness in energy of the π–π* and MLCT states and the heavy-atom effect of the iridium(III) ion in the complex.The broad luminescence spectrum and absorption peaks show that the excited triplet states of Ir(mpidmb)2(acac) possess predominant 3MLCT character. The green emitter Ir(mpidmb)2(acac) displays strong luminescence in both solution and film states from its triplet manifold. The broad phosphorescence spectrum of Ir(mpidmb)2(acac) displays green emissions at 503 and 493 nm (Fig. 7), and the PL quantum yield (Φ) was measured to be 0.52. In general, phosphorescence spectra from a ligand-centered 3π–π* state are vibronic, whereas PL spectra from a 3MLCT state display broad shapes.63–66 The absence of emission spectra with a vibronic structure for the organometallic complex Ir(mpidmb)2(acac) indicates that the emissions occur from a well-equilibrated emissive state and have MLCT character, which is further confirmed by the phosphorescence lifetime of 1.62 μs.
The wavefunction (Φ) of the triplet state (ΦT) of the iridium complex is a mixture of ΦT(π–π*) and ΦT(MLCT),69 i.e., ΦT = aΦT(π–π*) + bΦT(MLCT) [where a and b are normalized coefficients and ΦT(π–π*) and ΦT(MLCT) are the wavefunctions of the 3(π–π*) and 3(MLCT) excited states, respectively: when a > b the triplet state is dominated by the 3π–π* state, whereas when b > a the triplet state is dominated by the 3MLCT excited state]. The broad shape of the PL spectrum of Ir(mpidmb)2(acac) reveals that the excited state has a large contribution from the 3MLCT state. The two peaks observed at 503 and 493 nm are attributed to electronic transitions from vibrational levels of the triplet state (3MLCT/3π–π*) to the ground state (S0), as shown by the Franck–Condon electronic transitions in Fig. 7.
The peak with higher intensity originated from the ν′ = 0 → ν = 0 transition from the 3MLCT/3π–π* state to the S0 state, whereas the shoulder peak with lower intensity was derived from the ν′ = 0 → ν = 1 electronic transition.70,71 The gain in intensity can be expressed as  [where S is the Huang–Rhys factor, which is correlated to the intensity of vibration from the excited 3MLCT/3π–π* state to the ground state and is defined by
  , where ω is the vibrational frequency, M is the reduced mass, and ΔQ is the displacement of potential energy surfaces between the S0 and excited states]. The structural distortion upon excitation is explained by the ratio of the heights of the two emission peaks, i.e.,
  .72 The rate constants for radiative (kr) and non-radiative (knr) decay are calculated from the following equations: Φ = ΦISC{kr/(kr + knr)}, kr = Φ/τ, knr = (1/τ) − (Φ/τ) and τ = (kr + knr)−1 [where Φ is the quantum yield, τ is the lifetime, and ΦISC is the intersystem crossing yield]. The average radiative lifetime of Ir(mpidmb)2(acac) is 1.62 μs and its PL quantum yield (Φ) is 0.52. For iridium(III) complexes, ΦISC is assumed to be 1.0 owing to spin–orbit interactions due to the heavy-atom effect of iridium.73 The rate constants reveal that the radiative emission (3.2 × 10⁸ s−1) of Ir(mpidmb)2(acac) is dominant with respect to the non-radiative transition (3.0 × 10⁸ s−1).
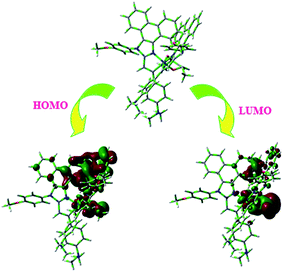
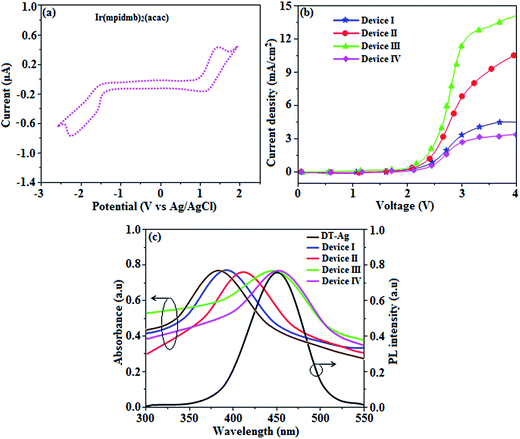
From DFT [DFT/LANL2DZ/6-31G(d,p)] analysis, it was shown that the highest occupied molecular orbital (HOMO) is predominantly composed of d(Ir) and π(C^N) states, whereas the lowest unoccupied molecular orbital (LUMO) is localized on the C^N ligand of the iridium complex (Fig. 8). The electrochemical behaviour of Ir(mpidmb)2(acac) was investigated using cyclic voltammetry with the ferrocene/ferrocenium couple as an internal reference and 0.1 M tetra(n-butyl)ammonium hexafluorophosphate as a supporting electrolyte (Fig. 9). The reversible one-electron oxidation wave at Eox1/2 = 0.31 V vs. Fc/Fc+ shows the electrochemical stability of the complex. The HOMO energy of the complex (HOMO: −5.11 eV)74,75 can be determined from the half-wave oxidation potential and the energy of the ferrocene/ferrocenium redox couple [EHOMO (eV) = −(Eox + 4.8)], whereas the LUMO energy (−2.63 eV) can be calculated by subtracting the optical band gap energy from the HOMO level [ELUMO = EHOMO − 1239/λonset]. Thermal characterization (Td5 and Tg) of Ir(mpidmb)2(acac) was performed via DSC and TGA measurements to test its suitability for film formation. TGA of Ir(mpidmb)2(acac) showed a high decomposition temperature (Td5) of 401 °C, a high glass transition temperature (Tg) of 154 °C and a melting point (Tm) of 366 °C (Fig. 4). The green Ir(mpidmb)2(acac) emissive layer exhibits excellent thermal properties and can be subjected to vacuum evaporation without decomposing.
The optimized geometry and HOMO and LUMO contour maps of the green Ir(mpidmb)2(acac) emissive layer were determined using the Gaussian 09 package with the DFT/LANL2DZ/6-31G(d,p) basis set (Fig. 8). The Ir(mpidmb)2(acac) complex exhibits a distorted octahedral geometry around the iridium atom with two cyclometalated mpidmb ligands and one ancillary acetylacetonate (acac) ligand. The mpidmb ligands adopt an eclipsed configuration in which the two nitrogen atoms N(5) and N(7) exhibit a trans N,N chelate conformation, and the Ir–N distances range between 2.04 and 2.08 Å. The cyclometalated carbon atoms C(12) and C(21) are in mutual cis positions with respect to the iridium atom, and the Ir–C distances range between 1.99 and 2.05 Å, owing to the stronger Ir–C bonding interaction of the mpidmb ligand, which weakens Ir–C bonds in trans positions. The electron-rich phenyl fragments of Ir(mpidmb)2(acac) exert a strong influence and a trans effect; thus, the trans C,C conformation is thermodynamically higher in energy and kinetically more labile, which is referred to as the transphobia effect67 and is confirmed by the fact that the Ir–C bond length Ir–Cav = 2.02 Å is shorter than the Ir–N bond length Ir–Nav = 2.06 Å.65
3.3. Electroluminescence performance
The root-mean-square roughnesses of the bare device and devices with DT-Ag NPs with densities of 6 μm−2, 35 μm−2 and 45 μm−2 were 2.32, 3.06, 3.68 and 3.78 nm, respectively (Fig. S1†), which indicates that the monodisperse NPs with surface plasmon absorption in the visible region are suitable for optoelectronic devices (Scheme S2†).76 The size of agglomerates of DT-Ag NPs increased with an increase in the density of DT-Ag NPs, and the corresponding average size of agglomerates of DT-Ag NPs in the devices with densities of DT-Ag NPs of 6 μm−2, 35 μm−2 and 45 μm−2 were 7.0, 25.0 and 35.0 nm, respectively. Hole-only devices were fabricated to compare the amount of hole current generated in hole-only devices with and without DT-Ag NPs. The current densities in hole-only devices at 3.0 V were 3.4 mA cm−2 (I – bare), 6.9 mA cm−2 (II – 6 μm−2), 11.5 mA cm−2 (III – 35 μm−2) and 2.8 mA cm−2 (IV – 45 μm−2), respectively. The maximum current density of 11.5 mA cm−2 achieved with the DT-Ag NPs layer with a density of 35 μm−2 (III) indicates that the inserted DT-Ag layer generates holes effectively from the ITO anode, which migrate toward the Al cathode (Fig. 9).The density of Ag NPs is a dominant factor in the control of device performance in this context. In general, metal nanoparticles have a definite surface potential (zeta potential) owing to the surface plasmons (charges) that surround them. Hence, the dispersal of nanoparticles on a semiconductor surface could alter the characteristics of the surface, in particular its vacuum level. In our case, the presence of Ag NPs is expected to alter the vacuum level of ITO, and as a result the hole injection barrier at the ITO/NPB interface is stabilised. Fortunately, the injection barrier is reduced (Fig. S2 and S3†) and hole conduction in OLEDs is enhanced. Hence, this kind of shift in vacuum level is possible with the optimized density of Ag NPs on ITO. A variety of hole injection layers have been used in OLEDs, for example, PEDOT:PSS, MoO3, NiO and WO3. The role of these materials in this context is to introduce an additional energy level at the anode/HTL interface, which may be their work function or HOMO level, which might help to reduce the hole injection barrier. In this case, nanoparticles help to reduce the injection barrier because of their surface potential; in other words, dispersing them on an ITO surface could alter the characteristics of the surface, in particular its vacuum level. The determination of the optimized coverage of Ag NPs is crucial for obtaining a reduced injection barrier at the anode/HTL interface.71 At low coverage, these nanoparticles can trap incoming holes instead of transporting them.71
X-ray photoelectron spectroscopy (XPS) was performed for both bare ITO and ITO with dispersed DT-Ag NPs to determine the hole injection (HI) efficiency of DT-Ag NPs. The hole injection barrier (HIB) at the anode/HTL interface junction was calculated from the equation ϕB = IE − ϕanode [where IE is the ionization energy of NPB and ϕanode is the work function of the anode material]. The shift observed for DT-Ag NPs indicates that the injection barrier was reduced, with the result that the ϕanode energy level was stabilized. The reduced hole injection barrier (HIB) at the ITO:NPB interface can be determined using the Richardson–Schottky thermionic emission model  [where Richardson's constant A* = 120 A cm−2 K−2 at m* = m0,
  , ϕB is the zero-field injection barrier, KB is the Boltzmann constant, T is the absolute temperature, and E is the electric field strength]. The device parameter for hole-only devices with bare ITO was added to the equation, and the zero-field injection barrier was calculated to be −0.93 eV, and the reduced hole injection barrier for ITO coated with DT-Ag NPs was calculated to be 0.84 eV. The reduced hole injection barrier (HIB) with the optimized coverage of DT-Ag NPs suggests an idea for hole enhancement in OLEDs. Fig. S2† shows XPS spectra of bare ITO and ITO coated with DT-Ag NPs [In 3d (3d3/2 and 3d5/2) and Sn 3d (3d3/2 and 3d5/2)], and a red shift in the peaks for both In and Sn (0.94 eV for In; 0.95 eV for Sn) was observed for ITO coated with DT-Ag NPs in comparison with bare ITO. This kind of peak shift was observed when a carrier (hole) injection material was deposited on ITO with the result that the energy level was stabilized (Fig. S3†), which was due to the formation of an electric double layer by Ag NPs.77
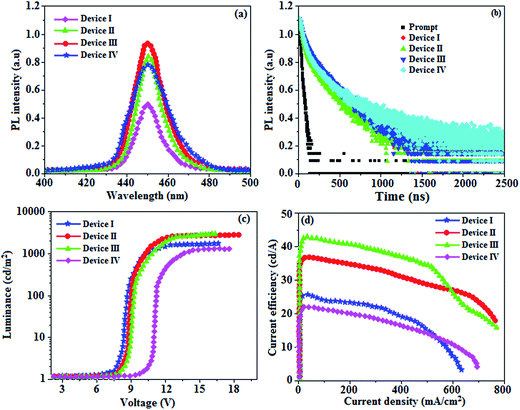
The absorption spectra (λabs) of devices I–IV reveal that the absorption peaks at 392 nm for device I (without DT-Ag NPs) and 412, 449, and 451 nm for devices II, III, and IV, respectively (with DT-Ag NPs), are related to the LSPR wavelength of DT-Ag NPs, and the LSPR peak of DT-Ag NPs in solution was observed at 384 nm (Fig. 9). The red shift in the absorption peak for the devices is due to the agglomeration of DT-Ag NPs that results from an increase in the density of DT-Ag NPs. The coupling of excitons in the emissive layer with the LSPR of DT-Ag NPs significantly tuned the emission rate. The emission intensity of the ITO/DT-Ag NPs/NPB/CBP:Ir(mpidmb)2(acac)/LiF/Al film was higher by a factor of 2.23 in comparison with the ITO/NPB/CBP:Ir(mpidmb)2(acac)/LiF/Al film (Fig. 10). The increase in emission intensity was due to the LSPR effect of the emissive layer via DT-Ag NPs, which resulted in an increase in the absorption of incident light by concentrating it into a local electromagnetic hot spot.78,79 An enhancement in emission intensity was observed with a well-matched spectral overlap between the LSPR of DT-Ag NPs and the emission peak of the emissive layer (Fig. 9). Therefore, these DT-Ag NPs are suitable for OLEDs that use an acetylacetonate iridium complex as the emissive layer, as their optical absorption peak is located in a broad region from 390 to 451 nm, which overlaps the peak of the emissive layer at 450 nm. When the local electromagnetic field of excitons in the emissive layer overlaps the LSPR of DT-Ag NPs, a coupling effect appears between the excitons and the LSPR (Fig. 10) owing to the transfer of energy between them, which results in the generation of new channels for emission. Because the high-momentum scattering speed of LSPR is faster than the decay speed of the excitons, this results in effective coupling between the excitons and the LSPR and thereby enhances the intensity of the radiation.43
When an interlayer based on DT-Ag NPs exists at a specific distance with respect to the emissive layer and the emission wavelength of the emitter (λemi) is close to the wavelength of the LSPR (λabs), energy transfer results between excitons and the LSPR. The energy transfer efficiency (E) is related not only to the distance between the acceptor and the donor (r0) but also to the critical energy transfer distance (R0) [FRET].76 According to Forster's theory of non-radiative energy transfer, the energy transfer efficiency (E) can be determined by the following equations:
When the wavelength of the absorption (λabs) spectrum of the LSPR in DT-Ag NPs matches that of the emission spectrum (λemi), the dominant PL peak corresponds to the emission frequency of CBP:Ir(mpidmb)2(acac), which results in an increase in efficiency. The PL peak for the CBP:Ir(mpidmb)2(acac) emissive layer is located close to the LSPR peak of DT-Ag NPs, with the result that coupling occurs between excitons and the LSPR. The decay time (Fig. 7) of the DT-Ag NPs/CBP:Ir(mpidmb)2(acac) film is faster than that of the CBP:Ir(mpidmb)2(acac) film owing to coupling between excitons and the LSPR, which results in an enhancement in radiative intensity.83,84 The PL decay times of devices I–IV were 416.0, 381.7, 328.4 and 246.9 ns, respectively. The variations in the PL decay times of devices I–IV were related to exciton quenching that was due to an overlap with the LSPR. The reduction in the lifetime of triplet excitons in devices II–IV was due to coupling between triplet excitons in the CBP:Ir(mpidmb)2(acac) emissive layer and the LSPR induced by DT-Ag NPs (Fig. 10). The effective surface plasmons generated in the vicinity of the surface of DT-Ag NPs and the increase in luminescence intensity were due to coupling between excitons and the LSPR of DT-Ag NPs. As a consequence, excitons in the emissive layer recombined either radiatively or non-radiatively via the interaction between the excitons and the LSPR. An overlap in the electromagnetic field originating from agglomerates of DT-Ag NPs induced non-radiative decay of excitons owing to destructive interference with the LSPR. LSPR leads to a very high density of states and a high local electromagnetic field near the surface of DT-Ag NPs. A higher decay rate is then expected owing to the strong coupling between excitons and the LSPR. This shows that not only the distance between the emitter and DT-Ag NPs but also the distance between adjacent DT-Ag NPs in the interlayer play important roles in determining the coupling between the LSPR and excitons in OLEDs.
A high density of DT-Ag NPs in the interlayer will result in the quenching of excitons, which is induced by strong overlap coupling between the excitons and plasmon excitations of the DT-Ag NPs. The control device (I) without DT-Ag NPs exhibited a maximum luminance of 1486 cd m−2 and a current efficiency of 25.3 cd A−1 at 8.0 V (Fig. 10). The devices with DT-Ag NPs with densities of 6 μm−2 (II) and 35 μm−2 (III) exhibited enhanced performance in comparison with the control device (I). The operating voltages of devices II (8.3 V) and III (8.6 V) at a density of DT-Ag NPs of 6 μm−2 (II) and 35 μm−2 (III) were almost the same as that of device I (8.0 V) without DT-Ag NPs. This indicates that the presence of DT-Ag NPs did not significantly affect the number of holes injected from the ITO anode into the CBP:Ir(mpidmb)2(acac) emissive layer. However, the operating voltage of device IV with DT-Ag NPs with a density of 45 μm−2 was higher than those of devices I–III owing to the leakage of current resulting from the large size of the DT-Ag NPs. The maximum luminances of the devices coated with DT-Ag NPs with densities of 6 μm−2 (II), 35 μm−2 (III) and 45 μm−2 (IV) were 2699, 2746 and 1308 cd m−2, respectively. The increased luminances of devices II and III in comparison with that of the bare device I were due to the coupling effect between excitons of the CBP:Ir(mpidmb)2(acac) emissive layer and the LSPR of DT-Ag NPs. The maximum current efficiencies of devices II–IV were 36.6 (at 8.3 V), 42.3 (at 8.6 V) and 21.6 (at 10.6 V) cd A−1, respectively. The increased luminance efficiency of devices II and III in comparison to the bare device I was due to increased luminance resulting from energy transfer via the coupling effect between excitons in CBP:Ir(mpidmb)2(acac) and the LSPR in the DT-Ag NPs layer. The current efficiency of device III with a density of DT-Ag NPs of 35 μm−2 at 100 cd m−2 was 17.7 cd A−1 higher than that of device I owing to increased luminance resulting from energy transfer via the coupling effect between excitons in the emissive layer and the LSPR in DT-Ag NPs. Moreover, the current efficiencies of the devices without DT-Ag NPs and with a density of DT-Ag NPs of 35 μm−2 at 1 cd m−2 were 38.3 and 46.0 cd A−1, respectively, whereas those at 10 cd m−2 were 32.3 and 44.9 cd A−1, respectively. The roll-off current efficiency of the device with a density of DT-Ag NPs of 35 μm−2 was lower than that of the device without DT-Ag NPs owing to exciton quenching resulting from the overlap with the LSPR.33 Even though the magnitude of exciton quenching in device IV with a density of DT-Ag NPs of 45 μm−2 was greater than that in device III with a density of DT-Ag NPs 35 μm−2 owing to an increase in the overlap with the LSPR, the current efficiency of device IV with a density of DT-Ag NPs 45 μm−2 was lower than that of the other devices owing to the leakage of current originating from the large size of the DT-Ag NPs.
4. Conclusions
The use of DT-Ag NPs with a density of 35 μm−2 at the anode/HTL junction in OLEDs using CBP:Ir(mpidmb)2(acac) as the emissive layer led to an enhancement in emission intensity, which was attributed to an increase in the radiative rate of the OLEDs. TEM images reveal that DT-Ag NPs were uniformly dispersed owing to the attachment of DT ligands to the surfaces of Ag NPs. The superposition of the absorption spectrum of DT-Ag NPs on the PL spectrum of the CBP:Ir(mpidmb)2(acac) emissive layer contributed to a coupling effect between the emission from the emissive layer and the LSPR of DT-Ag NPs, which resulted in an increase in out-coupling efficiency. The current efficiency of devices with a DT-Ag NPs layer at 100 cd cm−2 (42.3 cd A−1) was 17.0 cd A−1 higher than that of a control device (25.3 cd A−1). The increase in the current efficiency of devices with a DT-Ag NPs layer was strongly related to effective energy transfer between radiated light generated from the CBP:Ir(mpidmb)2(acac) emissive layer and the LSPR excited by the DT-Ag NPs layer.Acknowledgements
One of the authors, Dr J. Jayabharathi, thanks the Department of Science and Technology (EMR/2014/000094), Defence Research and Development Organization (213/MAT/10-11), Council of Scientific and Industrial Research [No. 01/(2707)/13EMR-II], University Grant Commission (36-21/2008) and Nano Mission (SR/NM/NS-1001/2016) for financial support. The authors would like to thank Mr P. Justin Jesuraj for scientific discussions related to plasmonic couplings with organic molecules.References
- S. Hofle, M. Pfaff, H. Do, C. Bernhard, D. Gerthsen, U. Lemmer and A. Colsmann, Org. Electron., 2014, 15, 337–341 CrossRef.
- S. Hofle, M. Bruns, S. Strassle, C. Feldmann, U. Lemmer and A. Colsmann, Adv. Mater., 2013, 25, 4113–4116 CrossRef PubMed.
- T. Chiba, Y. J. Pu, R. Miyazaki, K. Nakayama, H. Sasabe and J. Kido, Org. Electron., 2011, 12, 710–715 CrossRef CAS.
- K. S. Lee, I. Lim, S. H. Han and T. W. Kim, Org. Electron., 2014, 15, 343–347 CrossRef CAS.
- D. H. Kim and T. W. Kim, Org. Electron., 2014, 15, 3452–3457 CrossRef CAS.
- Y. H. Lee, D. H. Kim, K. H. Yoo and T. W. Kim, Appl. Phys. Lett., 2014, 105, 183303–183305 CrossRef.
- Y. H. Choi, Y. P. Jeon, D. C. Choo and T. W. Kim, Org. Electron., 2015, 22, 197–201 CrossRef CAS.
- F. B. Dias, K. N. Bourdakos, V. Jankus, K. C. Moss, K. T. Kamtekar, V. Bhalla, J. Santos, M. R. Bryce and A. P. Monkman, Adv. Mater., 2013, 25, 3707–3714 CrossRef CAS PubMed.
- E. L. Williams, K. Haavisto, J. Li and G. E. Jabbour, Adv. Mater., 2007, 19, 197–202 CrossRef CAS.
- S. O. Jeon, K. S. Yook, C. W. Joo and J. Y. Lee, Org. Electron., 2010, 11, 881–886 CrossRef CAS.
- F. Kessler, Y. Watanabe, H. Sasabe, H. Katagiri, M. K. Nazeeruddin, M. Gratzel and J. Kido, J. Mater. Chem. C, 2013, 1, 1070–1075 RSC.
- S. Y. Kim, W. I. Jeong, C. Mayr, Y. S. Park, K. H. Kim, J. H. Lee, C. K. Moon, W. Brutting and J. J. Kim, Adv. Funct. Mater., 2013, 23, 3896–3900 CrossRef CAS.
- H. W. Chang, J. Lee, S. Hofmann, Y. H. Kim, L. M. Meskamp, B. Lussem, C. C. Wu, K. Leo and M. C. Gather, J. Appl. Phys., 2013, 113, 204502–204508 CrossRef.
- T. Bocksrocker, J. Hoffmann, C. Eschenbaum, A. Pargner, J. Preinfalk, F. M. Flaig and U. Lemmer, Org. Electron., 2013, 14, 396–401 CrossRef CAS.
- K. Sokolov, G. Chumanov and T. M. Cotton, Anal. Chem., 1998, 70, 3898–3905 CrossRef CAS PubMed.
- P. P. Pompa, L. Martiradonna, A. D. Torre, F. D. Sala, L. Manna, M. D. Vittorio, F. Calabi, R. Cingolani and R. Rinaldi, Nat. Nanotechnol., 2006, 1, 126–130 CrossRef CAS PubMed.
- C. D. Geddes and J. R. Lakowicz, J. Fluoresc., 2002, 12, 121–129 CrossRef.
- Y. Zhang, K. Aslan, M. J. R. Previte and C. D. Geddes, Appl. Phys. Lett., 2007, 90, 173116–173123 CrossRef.
- K. Ray, M. H. Chowdhury and J. R. Lakowicz, Anal. Chem., 2007, 79, 6480–6487 CrossRef CAS PubMed.
- A. Dorfman, N. Kumar and J. I. Hahm, Adv. Mater., 2006, 18, 2685–2690 CrossRef CAS.
- Y. Chen, K. Munechika, I. J. L. Plante, A. M. Munro, S. E. Skrabalak, Y. Xia and D. S. Ginger, Appl. Phys. Lett., 2008, 93, 053106 CrossRef.
- F. Tam, G. P. Goodrich, B. R. Johnson and N. J. Halas, Nano Lett., 2007, 7, 496–501 CrossRef CAS PubMed.
- Y. Chen, K. Munechika and D. S. Ginger, Nano Lett., 2007, 7, 690–696 CrossRef CAS PubMed.
- M. Thomas, J. J. Greffet and R. Carminati, Appl. Phys. Lett., 2004, 85, 3863–3865 CrossRef CAS.
- P. Bharadwaj and L. Novotny, Opt. Express, 2007, 15, 14266–14274 CrossRef CAS PubMed.
- K. Hong and J. L. Lee, Electron. Mater. Lett., 2011, 7, 77–91 CrossRef CAS.
- S. Y. Kim, J. M. Baik, H. Yu, K. Y. Kim, Y. H. Tak and J. L. Lee, Appl. Phys. Lett., 2005, 87, 072105 CrossRef.
- H. W. Choi and S. Y. Kim, Appl. Phys. Lett., 2005, 86, 012104 CrossRef.
- H. Y. Cho, E. J. Park, J. H. Kim and L. S. Park, J. Nanosci. Nanotechnol., 2008, 8, 4916–4922 CrossRef CAS PubMed.
- J. W. Ma, Z. Liang, C. Jin, X. Y. Jiang and Z. L. Zhang, Solid State Commun., 2009, 149, 214–217 CrossRef CAS.
- K. Narayan, G. M. Rao, A. M. M. Varma and T. Srinivas, Curr. Appl. Phys., 2013, 13, 18–25 CrossRef.
- M. P. D. Jong, L. J. V. IJzendoorn and M. J. A. D. Voigt, Appl. Phys. Lett., 2000, 77, 2255–2257 CrossRef.
- L. W. Tan, R. A. Hatton, G. Latini, J. M. Shannon and S. R. P. Silva, Nanotechnology, 2008, 19, 485706–485709 CrossRef PubMed.
- R. A. Hatton, A. J. Miller and S. R. P. Silva, J. Mater. Chem., 2008, 18, 1183–1192 RSC.
- Z. Zhong, Y. Dai, D. Ma and Z. Y. Wang, J. Mater. Chem., 2011, 21, 6040–6045 RSC.
- F. Li, X. Li, J. Zhang and B. Yang, Org. Electron., 2007, 8, 635–639 CrossRef CAS.
- K. U. Yang, K. C. Choi and C. W. Ahn, Appl. Phys. Lett., 2009, 94, 173301–173303 CrossRef.
- A. Fujiki, T. Uemura, N. Zettsu, M. Akai-Kasaya, A. Saito and Y. Kuwahara, Appl. Phys. Lett., 2010, 96, 043307 CrossRef.
- Y. Xiao, J. P. Yang, P. P. Cheng, J. J. Zhu, Z. Q. Xu, Y. H. Deng, S. T. Lee, Y. Q. Li and J. X. Tang, Appl. Phys. Lett., 2012, 100, 013308 CrossRef.
- F. Yan and X. W. Sun, Appl. Phys. Lett., 2013, 102, 043303–043304 CrossRef.
- F. Liu and J. M. Nunzi, Appl. Phys. Lett., 2011, 99, 123302–123303 CrossRef.
- K. Xu, Y. Li, W. Zhang, L. Zhang and W. Xie, Curr. Appl. Phys., 2014, 14, 53–56 CrossRef.
- A. Kumar, R. Srivastava, P. Tyagi, D. S. Mehta and M. N. Kamalasanan, Org. Electron., 2012, 13, 159–165 CrossRef CAS.
- M. J. Frisch, G. W. Trucks, H. B. Schlegel, G. E. Scuseria, M. A. Robb, J. R. Cheeseman, G. Scalmani, V. Barone, B. Mennucci, G. A. Petersson, H. Nakatsuji, M. Caricato, X. Li, H. P. Hratchian, A. F. Izmaylov, J. Bloino, G. Zheng, J. L. Sonnenberg, M. Hada, M. Ehara, K. Toyota, R. Fukuda, J. Hasegawa, M. Ishida, T. Nakajima, Y. Honda, O. Kitao, H. Nakai, T. Vreven, J. A. Montgomery Jr, J. E. Peralta, F. Ogliaro, M. Bearpark, J. J. Heyd, E. Brothers, K. N. Kudin, V. N. Staroverov, R. Kobayashi, J. Normand, K. Raghavachari, A. Rendell, J. C. Burant, S. S. Iyengar, J. Tomasi, M. Cossi, N. Rega, J. M. Millam, M. Klene, J. E. Knox, J. B. Cross, V. Bakken, C. Adamo, J. Jaramillo, R. Gomperts, R. E. Stratmann, O. Yazyev, A. J. Austin, R. Cammi, C. Pomelli, J. W. Ochterski, R. L. Martin, K. Morokuma, V. G. Zakrzewski, G. A. Voth, P. Salvador, J. J. Dannenberg, S. Dapprich, A. D. Daniels, O. Farkas, J. B. Foresman, J. V. Ortiz, J. Cioslowski and D. J. Fox, Gaussian (Revision A.02), Gaussian, Inc., Wallingford, CT, 2009 Search PubMed.
- M. Nonoyama, Benzo(h)quinolin-10-yl-N iridium(III) complexes, Bull. Chem. Soc. Jpn., 1974, 47, 767–768 CrossRef CAS.
- Y. Lin, A. Böker, J. He, K. Sill, H. Xiang, C. Abetz, X. Li, J. Wang, T. Emrick, S. Long, Q. Wang, A. Balazs and T. P. Russell, Nature, 2005, 343, 55–59 CrossRef PubMed.
- S. C. Park, B. J. Kim, C. J. Hawker, E. J. Kramer, J. Bang and J. S. Ha, Macromolecules, 2007, 40, 8119–8124 CrossRef CAS.
- K. Aissou, G. Fleury, G. Pecastaings, T. Alnasser, S. Mornet, G. Goglio and G. Hadzi-ioannou, Langmuir, 2011, 27, 14481–14488 CrossRef CAS PubMed.
- B. A. Korgel, S. Fullam, S. Conolly and D. Fitzmaurice, J. Phys. Chem. B, 1998, 102, 8379–8388 CrossRef CAS.
- J. He, P. Kanjanaboos, N. L. Frazer, A. Weis, X. M. Lin and H. M. Jaeger, Small, 2010, 6, 1449–1456 CrossRef CAS PubMed.
- X. Zhou, J. M. El Khoury, L. Qu, L. Dai and Q. Li, J. Colloid Interface Sci., 2007, 308, 381–384 CrossRef CAS PubMed.
- G. Canzi, A. A. Mrse and C. P. Kubiak, J. Phys. Chem. C, 2011, 115, 7972–7978 CAS.
- T. P. Ang and W. S. Chin, J. Phys. Chem. B, 2005, 109, 22228–22236 CrossRef CAS PubMed.
- R. H. Terrill, T. A. Postlethwaite, C. Chen, C. D. Poon, A. Terzis, A. Chen, J. E. Hutchison, M. R. Clark, G. Wignall, J. D. Londono, R. Surperfine, M. Falvo, C. S. Johnson Jr, E. T. Samulski and R. W. Murray, J. Am. Chem. Soc., 1995, 117, 12537–12548 CrossRef CAS.
- X. Liu, A. Wang, X. Wang, C. Yuan and T. Zhang, Chem. Commun., 2008, 3187–3189 RSC.
- A. Badia, S. Singh, L. Demers, L. Cuccia, G. R. Brown and R. B. Lennox, Chem.–Eur. J., 1996, 2, 359–363 CrossRef CAS.
- S. R. Johnson, S. D. Evans, S. W. Mahon and A. Ulman, Langmuir, 1997, 13, 51 CrossRef CAS.
- Z. Mekhalif, J. Riga, J. J. Pireaux and J. Delhalle, Langmuir, 1997, 13, 2285 CrossRef CAS.
- M. M. Oliveira, D. Ugarte, D. Zanchet and A. J. Zarbin, J. Colloid Interface Sci., 2005, 292, 429–435 CrossRef CAS PubMed.
- D. G. Angelescu, M. Vasilescu, M. Anastasescu, R. Baratoiu, D. Donescu and V. S. Teodorescu, Colloids Surf., A, 2012, 394, 57–66 CrossRef CAS.
- B. X. Mi, P. F. Wang, M. W. Liu, H. L Kwong, N. B. Wong, C. S. Lee and S. T. Lee, Chem. Mater., 2003, 15, 3148–3151 CrossRef CAS.
- J. D. Priest, G. Y. Zheng, N. Goswami, D. M. Eichhorn, C. Woods and D. P. Rillema, Inorg. Chem., 2000, 39, 1955–1963 CrossRef.
- J. Jayabharathi, V. Thanikachalam, K. Saravanan and N. Srinivasan, J. Fluoresc., 2011, 21, 507–519 CrossRef CAS PubMed.
- K. Saravanan, N. Srinivasan, V. Thanikachalam and J. Jayabharathi, J. Fluoresc., 2011, 21, 65–80 CrossRef CAS PubMed.
- J. Jayabharathi, V. Thanikachalam, N. Srinivasan and K. Saravanan, J. Fluoresc., 2011, 21, 596–606 Search PubMed.
- J. Jayabharathi, V. Thanikachalam and K. Saravanan, J. Photochem. Photobiol., A, 2009, 208, 13–20 CrossRef CAS.
- S. Lamansky, P. Djurovich, D. Murphy, F. Abdel Razzaq, H. F. Lee, C. Adachi, P. E. Burrows, S. R. Forrest and M. E. Thompson, J. Am. Chem. Soc., 2001, 123, 4304–4312 CrossRef CAS PubMed.
- M. G. Colombo, A. Hauser and H. U. Gudel, Inorg. Chem., 1993, 32, 3088–3092 CrossRef CAS.
- S. Okada, K. Okinaka, H. Iwawaki, M. Furugori, M. Hashimoto, T. Mukaide, J. Kamatani, S. Igawa, A. Tsuboyama, T. Takiguchi and K. Ueno, Dalton Trans., 2005, 9, 1583–1590 RSC.
- K. C. Tang, K. L. Liu and I. C. Chen, Chem. Phys. Lett., 2004, 386, 437–441 CrossRef CAS.
- (a) D. S. Mcclure, J. Chem. Phys., 1949, 17, 905–913 CrossRef CAS; (b) W. L. Leong, P. S. Lee, S. G. Mhaisalkar, T. P. Chen and A. Dodabalapur, Appl. Phys. Lett., 2007, 90, 042906 CrossRef.
- H. Bassler and B. Schweitzer, Acc. Chem. Res., 1999, 32, 173–182 CrossRef.
- N. J. Turro, V. Ramamurthy and J. C. Scaiano, Modern Molecular Photochemistry of Organic Molecules, 2012 Search PubMed.
- (a) J. Liu, Z. Zeng, X. Cao, G. Lu, L. H. Wang, Q. L. Fan, W. Huang and H. Zhang, Small, 2012, 8, 3517–3522 CrossRef CAS PubMed; (b) Z. Wang, Y. Feng, S. Zhang, Y. Gao, Z. Gao, Y. Chen, X. Zhang, P. Lu, B. Yang, P. Chen, Y. Mab and S. Liuc, Phys. Chem. Chem. Phys., 2014, 16, 20772–20779 RSC.
- J. Pei, W. L. Yu, J. Ni, Y. H. Lai, W. Huang and A. J. Heeger, Macromolecules, 2001, 34, 7241–7248 CrossRef CAS.
- A. Kumar, P. Tyagi, R. Srivastava, D. S. Mehta and M. N. Kamalasanan, Appl. Phys. Lett., 2013, 102, 203304–203305 CrossRef.
- P. J. Jesuraj, K. Jeganathan, M. Navaneethan and Y. Hayakawa, Synth. Met., 2016, 211, 155–160 CrossRef CAS.
- M. H. Huang, S. Mao, H. Feick, H. Yan, Y. Wu, H. Kind, E. Weber, R. Russo and P. Yang, Science, 2001, 292, 1897–1899 CrossRef CAS PubMed.
- W. Ji, H. Zhao, H. Yang and F. Zhu, Org. Electron., 2015, 22, 154–159 CrossRef CAS.
- L. Cyril, J. K. Earl and W. M. Sperry, Biochemists Handbook, E & F.N. Spon, London, 1961 Search PubMed.
- Y. J. Hu, Y. Liu and L. X. Zhang, J. Mol. Struct., 2005, 750, 174–178 CrossRef CAS.
- A. N. Bordenyuk, C. Weeraman, A. Yatawara, H. D. Jayathilake, I. Stiopkin, Y. Liu and A. V. Benderskii, J. Phys. Chem. C, 2007, 111, 8925–8933 CAS.
- D. H. Kim and T. W. Kim, Org. Electron., 2016, 34, 262–266 CrossRef CAS.
- W. Zhu, J. Yu, B. Qian, T. Xiao, G. Zhai and B. Wei, Synth. Met., 2016, 220, 621–627 CrossRef CAS.
Footnote |
| † Electronic supplementary information (ESI) available. See DOI: 10.1039/c7ra07080b |
| This journal is © The Royal Society of Chemistry 2017 |

