 Open Access Article
Tin doped PrBaFe2O5+δ anode material for solid oxide fuel cells†
Guohui Dong ,
Chunyang Yang,
Fei He,
Yanmei Jiang,
Chunlei Ren,
Yun Gan,
Myongjin Lee and
Xingjian Xue
 *
*
Department of Mechanical Engineering, University of South Carolina, Columbia, SC 29208, USA. E-mail: xue@cec.sc.edu
First published on 25th April 2017
Abstract
Ceramic anodes have many advantages over cermet anodes for solid oxide fuel cells. We report the synthesis and characterization of Sn doped double perovskite PrBaFe(2−x)SnxO5+δ (x = 0–0.3) anode materials. Different crystal structures were observed depending on the Sn doping level and gas atmosphere. The materials demonstrated excellent stability in both reducing and redox atmospheres at elevated temperatures. The oxygen content in the as-prepared PrBaFe(2−x)SnxO5+δ was nonlinearly correlated to the Sn doping level and reached maximum values around x = 0.1. After the reducing treatment, the oxygen content linearly decreased with increasing Sn doping level. The electrical conductivity of bulk PrBaFe(2−x)SnxO5+δ (x = 0.1) reached 63.6 S cm−1 at 800 °C in humidified hydrogen. At 750 °C, the surface exchange coefficient and bulk diffusivity of PrBaFe(2−x)SnxO5+δ reached the maximum values of 4.42 × 10⁻⁶ m s−1 and 6.04 × 10⁻⁷ m2 s−1, respectively, in the reducing process when the Sn doping level was x = 0.1. The activation energies of surface exchange coefficient and bulk diffusivity of PrBaFe(2−x)SnxO5+δ (x = 0.1) were 0.22 eV and 0.16 eV, respectively, in the reducing process. The area specific resistance of the PrBaFe(2−x)SnxO5+δ (x = 0.1) anode was 0.095–0.285 Ω cm2 from 850–750 °C in humidified hydrogen, better than or comparable to the best ceramic anodes in the literature.
1. Introduction
Solid oxide fuel cells (SOFCs) are energy conversion devices that convert the chemical energy in fuels directly to electrical energy in an environmentally benign and highly efficient manner.1 SOFCs can utilize fuels of not only hydrogen but also various hydrocarbons and even carbon, demonstrating excellent fuel flexibility.2 Since fuels are oxidized at the anode electrode, multiple functionalities are required for anode materials. These include stability in a reducing atmosphere, high catalytic activity, and high conductivity, as well as chemical and thermal compatibility with the electrolyte. Traditional anode materials are nickel cermets, where nickel is mixed with electrolyte materials. While Ni-cermet anodes show excellent catalytic activity and high electrical conductivity, they also suffer from the issues of redox instability, micro-morphology instability induced by nickel agglomeration, carbon coking and sulphur poisoning.3 Together these issues affect structural integrity and reliability, conductivity and electrochemical reaction sites, and surface catalytic activity, deteriorating both the electrochemical performance and long-term stability of SOFCs.To overcome the disadvantages of Ni-cermet anode, alternative cermet anode such as Cu–CeO2–YSZ cermet has been studied to replace Ni-cermet.4 Although the Cu-based anode may improve carbon and sulphur tolerance, its catalytic activity is lower than Ni-cermet towards fuel oxidation. Therefore, noble metal catalysis of Ru–CeO2 was later on applied directly on the Ni-cermet anode to achieve high catalytic activity while retaining the advantages of Ni-cermet anode.5 Since SOFCs are operated at high temperatures (above 500 °C), it is almost unavoidable to have metal particle agglomerations under long-term operations regardless of types of cermet anodes. This in turn leads to a variety of issues as mentioned above. It is well-known that cermet anodes are composite electrodes with metal phase as an electronic conductor and ceramic (electrolyte material) phase as an ionic conductor. As a consequence, electrochemical reactions are confined at triple phase boundaries, where metal and electrolyte material as well as gas phase meet together.
To avoid intrinsic drawbacks of cermet anodes, mixed ionic and electronic conductors (MIECs) of ABO3 type simple perovskites have been studied as anode materials such as La0.75Sr0.25Cr0.5Mn0.5O3 (LSCM)6 and its derivatives,7 where the A-site is usually occupied by La, Sr, Y or their combination while the B-site is occupied by the first row transition metals, e.g., Sc, Ti, V, Cr, Mn, Fe. The MIEC anode materials of double perovskites have also been investigated, including Sr2Mg1−xMnxMoO6−δ,8 and Sr2Fe1.5Mo0.5O6−δ.9 The AA′B2O5+δ-type double perovskites have been widely studied as cathode materials for SOFCs,10,11 where the A-site is typically an element in the lanthanide series Ln, e.g., Pr, Sm, Nd, and Gd, while the A′-site is either Ba or Sr, or their combination. The B-site cation, to a large degree, is related to catalytic activity of layered perovskite, and therefore is usually selected from the first row transition metals. Recently, AA′B2O5+δ-type double perovskites have also been studied as anode materials, such as PrBaMn2O5+δ and its derivatives.12–14 It has been experimentally confirmed that Fe-based AA′B2O5+δ-type double perovskites, e.g., LnBaFe2O5+δ (Ln = lanthanides), are chemically and thermally stable in a reducing atmosphere at high temperature of 1000 °C.15 This result indicates that such Fe-based double perovskites could be potentially used as anode materials for SOFCs. However, their electrical conductivity and catalytic activity are relatively low, further advancement is needed to improve electrochemical kinetic properties while maintaining their stability in reducing atmosphere at high temperatures.
In this research, Tin doped PrBaFe2O5+δ double perovskites, i.e., PrBaFe(2−x)SnxO5+δ (x = 0, 0.05, 0.1, 0.15, 0.2, 0.3) were investigated as anode material for SOFCs. The materials were synthesized using a combustion method. The crystal structures, compositions, stability, electrical conductivity and electrochemical kinetic properties, as well as electrochemical performance as anode material of SOFCs were systematically characterized.
2. Results and discussion
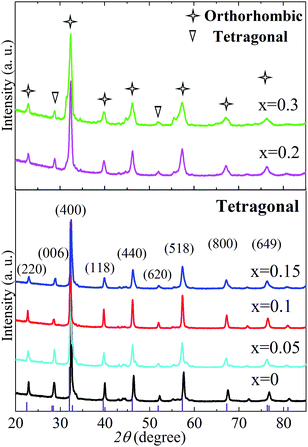
The phase structures of LnBaFe2O5+δ (Ln = La, Gd, Nd, Sm, Eu) as widely reported were either tetragonal (space groups: P4/mmm (123)), or much lower symmetric orthorhombic (Pmmm (47)). The tetragonal crystal structures (P4/mmm (123)) of LnBaFe2O5+δ (Ln = La, Gd, Nd, Sm, Eu) have very similar XRD patterns according to the Inorganic Crystal Structure Database (ICSD). The substitution of lanthanide element Pr for La, Gd, Nd, Sm or Eu at A site would not affect the crystal structure due to their similar outer electronic structures, valences and ionic radius. Fig. 1 shows the XRD patterns of the synthesized PrBaFe(2−x)SnxO5+δ (x = 0, 0.05, 0.1, 0.15, 0.2, 0.3) powder samples. The diffraction peaks of PrBaFe(2−x)SnxO5+δ (x = 0, 0.05, 0.1, 0.15) can be well indexed to the single phase of tetragonal Barium Iron Praseodymium Oxide (PBFO), and are identical to those of the tetragonal LaBaFe2O5.5 (JCPDS, no. 00-057-0089). The diffraction peaks of PrBaFe(2−x)SnxO5+δ (x = 0.2, 0.3) can be indexed to the mixture of tetragonal and orthorhombic PBFO. The diffraction peaks of orthorhombic PBFO are similar to those of orthorhombic GdBaFe2O5.013 (JCPDS, no. 01-072-6547).The as-prepared PrBaFe(2−x)SnxO5+δ (x = 0, 0.05, 0.1, 0.15, 0.2, 0.3) powder samples were heat-treated at 800 °C for 24 h in a reducing atmosphere, where the gas mixture H2![[thin space (1/6-em)]](https://www.rsc.org/images/entities/char_2009.gif) :
:![[thin space (1/6-em)]](https://www.rsc.org/images/entities/char_2009.gif) N2 = 1
N2 = 1![[thin space (1/6-em)]](https://www.rsc.org/images/entities/char_2009.gif) :
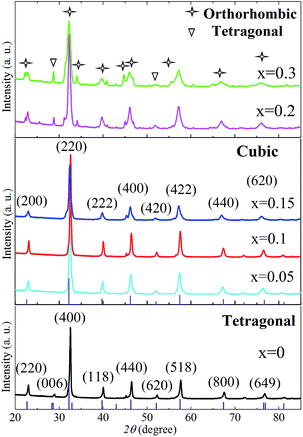
:![[thin space (1/6-em)]](https://www.rsc.org/images/entities/char_2009.gif) 9 in volume ratio was humidified. Fig. 2 shows the XRD patterns of the powders after the reducing treatment. Compared to those before the reducing treatment (Fig. 1), the XRD pattern of PrBaFe(2−x)SnxO5+δ (x = 0) shows no obvious change except that the peak intensity of (006) decreased, indicating its good chemical and phase stability. Interestingly, the (006) diffraction peak disappeared in the XRD patterns of PrBaFe(2−x)SnxO5+δ (x = 0.05, 0.1, 0.15) after reducing treatment, which can be well indexed to the pure phase of cubic supercell PrBaFe2O5+δ (space group: Pm
9 in volume ratio was humidified. Fig. 2 shows the XRD patterns of the powders after the reducing treatment. Compared to those before the reducing treatment (Fig. 1), the XRD pattern of PrBaFe(2−x)SnxO5+δ (x = 0) shows no obvious change except that the peak intensity of (006) decreased, indicating its good chemical and phase stability. Interestingly, the (006) diffraction peak disappeared in the XRD patterns of PrBaFe(2−x)SnxO5+δ (x = 0.05, 0.1, 0.15) after reducing treatment, which can be well indexed to the pure phase of cubic supercell PrBaFe2O5+δ (space group: Pm![[3 with combining macron]](https://www.rsc.org/images/entities/char_0033_0304.gif) m (221)). It is noteworthy that the diffraction peaks of cubic supercell PrBaFe2O5+δ are quite similar to those of La0.5Ba0.5FeO2.955 (space group: Pm
m (221)). It is noteworthy that the diffraction peaks of cubic supercell PrBaFe2O5+δ are quite similar to those of La0.5Ba0.5FeO2.955 (space group: Pm![[3 with combining macron]](https://www.rsc.org/images/entities/char_0033_0304.gif) m (221), JCPDS, no. 01-080-1054), however the lattice parameters of the former are two times those of the latter. These observations imply a phase transition of PrBaFe(2−x)SnxO5+δ (x = 0.05, 0.1, 0.15) from the tetragonal to the cubic during the reducing treatment. The diffraction peaks of PrBaFe(2−x)SnxO5+δ (x = 0.2, 0.3) are still the mixture of tetragonal and orthorhombic PrBaFe2O5+δ, showing no obvious change before and after the reducing treatment.
m (221), JCPDS, no. 01-080-1054), however the lattice parameters of the former are two times those of the latter. These observations imply a phase transition of PrBaFe(2−x)SnxO5+δ (x = 0.05, 0.1, 0.15) from the tetragonal to the cubic during the reducing treatment. The diffraction peaks of PrBaFe(2−x)SnxO5+δ (x = 0.2, 0.3) are still the mixture of tetragonal and orthorhombic PrBaFe2O5+δ, showing no obvious change before and after the reducing treatment.
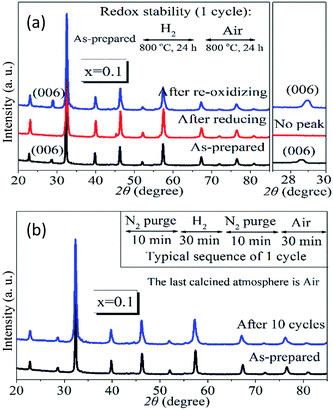
The redox stability of PrBaFe(2−x)SnxO5+δ (x = 0.1) was examined at 800 °C in a cycling atmosphere, where a reducing (humidified 10% H2 + 90% N2) and oxidizing (air) atmosphere were changed alternatively with nitrogen as a purging gas in between. In the long cycling treatment, both the reducing period and oxidizing period were 24 h; while in the short cycling treatment, the reducing period and oxidizing period were 30 min. Fig. 3a shows the XRD patterns of PrBaFe(2−x)SnxO5+δ (x = 0.1) at different stages of one long cycling treatment. A phase transition was observed from the tetragonal to cubic when the as-prepared powder was treated in a reducing atmosphere for a half cycle. The cubic phase was then changed back to the tetragonal phase after oxidizing treatment for another half cycle. Fig. 3b shows the XRD patterns of PrBaFe(2−x)SnxO5+δ (x = 0.1) before and after 10 short cycle treatment. Obviously, the as-prepared PrBaFe(2−x)SnxO5+δ (x = 0.1) was the tetragonal phase; after 10 cycling treatment, the structure of PrBaFe(2−x)SnxO5+δ (x = 0.1) was still tetragonal, indicating excellent redox stability.
The chemical compositions (metal ion molar ratio) of as-prepared PrBaFe(2−x)SnxO5+δ (x = 0, 0.05, 0.1, 0.15, 0.2, 0.3) were determined by Inductively Coupled Plasma-Optical Emission Spectrometer (ICP-OES) technique. As shown in Table S1,† the resultant compositions and molar ratios of Pr/Ba, Fe/Ba and Sn/Ba are very close to the nominal values even though a little bit deviations of less than 2% exist. The energy dispersive X-ray analysis (EDS) technique was further employed to examine element distribution and doping uniformity of the powders, including the as-synthesized PrBaFe(2−x)SnxO5+δ (x = 0, 0.1, 0.15, 0.3) and heat-treated powders at 800 °C for 24 h in the humidified gas mixture of 10% H2 + 90% N2. The results are shown in Fig. S1–S3.† The peak intensity of Sn element increased obviously with increasing the doping level of Sn element (Fig. S1†), however the peak intensity of other elements did not show any observable change. For a given Sn doping level, the EDS of the powders did not show any observable changes before and after the reducing treatment. The SEM images in Fig. S2 and S3† indicate that the particle size of the powders decreases with increasing Sn doping levels. The corresponding EDS mappings show that the elements are uniformly distributed, no element separation or aggregation can be observed.
Since oxygen nonstoichiometry of powder samples usually affects the density of charge carriers and conducting mechanism in the bulk, the oxygen content (5 + δ) in PrBaFe(2−x)SnxO5+δ (x = 0, 0.05, 0.1, 0.15, 0.2, 0.3) was determined using iodometric titration technique. The iodometric measurements were carried out at least three times for every single samples. The titration results showing good repeatability were then averaged for the determination of δ values. The oxygen content in PrBaFe(2−x)SnxO5+δ cannot be obtained directly from iodometry experiment. Further analysis is needed for this purpose. It is assumed that trivalent and higher valence state of iron cations (the average valence is denoted as F+) are reduced to their divalent state ferrous ion, while trivalent and lower valence state of tin element (the average valence is denoted as S+) are oxidized to their tetravalent state tin cations according to the following reactions (1) and (2):
 | (1) |
 | (2) |
The average valence of the transition metal cations FeF+ and SnS+ can be determined from the quantity of the liberated iodine, I3−, which is measured by the titration of Na2S2O3 with the starch as an indicator using the following reactions (3) and (4):
| I2 + I− = I3− | (3) |
| I2 + 2S2O32− = 2I− + S4O62− | (4) |
The balance equation of Na2S2O3 titration can be described as,
 | (5) |
The valence balance of Pr3+, Ba2+, FeF+ and SnS+ cations and O2− anion in PrBaFe(2−x)SnxO5+δ can be represented as,
| 3 + 2 + (2 − x) × F + x × S = 2 × (5 + δ) | (6) |
Combining (5) with (6), gives,
 | (7) |
For the preparation of Na2S2O3 standard solution, the deionized water was boiled to remove dissolved air and kill bacteria, then cooled down to room temperature. The deionized water was then used to prepare the standard solution with the concentrations of Na2S2O3 ∼0.1 N and Na2CO3 0.2 g L−1 respectively. The prepared Na2S2O3 solution was sealed in a brown glass flask, and placed in dark environment at room temperature for about 10 days.
The actual concentration of Na2S2O3 standard solution needs to be calibrated by titration method, where the Na2S2O3 solution was used to titrate the solution mixture of K2Cr2O7, KI and 6 N HCl in dark environment at room temperature for about 10 min. The detailed reactions are described in (8) and (9),
| Cr2O72− + 6I− + 14H+ = 2Cr3+ + 3I2 + 7H2O | (8) |
| I2 + 2S2O32− = 2I− + S4O62− | (9) |
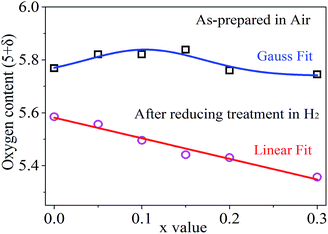
Given the concentrations of K2Cr2O7 solution and KI solution, the actual concentration of Na2S2O3 standard solution was calculated from above calibrations. The measurement and analysis results are shown in Fig. 4 and Table S2.† The oxygen content (5 + δ) in the as-synthesized powder samples increased with increasing the Sn doping levels in the range of 0 ≤ x ≤ 0.1, and reached a peak value around x = 0.1. Beyond the Sn doping level of 0.1, the oxygen content decreased with increasing the Sn doping levels. Clearly, the oxygen contents are nonlinearly correlated with Sn doping levels in the as-synthesized powder samples. This nonlinear correlation could be resulted from the complex valence state changes of Sn(IV) ↔ Sn(II) ↔ Sn(I) and Fe(VI) ↔ Fe(iii) ↔ Fe(II), and their competing interactions. Reordering eqn (6), one can obtain,
| 2δ = (S − F) × x + 2 × F − 5 | (10) |
In the PrBaFe2O5+δ sample where the Sn doping level is 0, the calculated average valence state of Fe is F ≈ 3.27. With a little amount of Sn doping (e.g., x ≤ 0.1), the initial valence state of Sn in PrBaFe(2−x)SnxO5+δ is close to 4, i.e., S ≈ 4, and S − F > 0. As a result, the oxygen content increases with increasing x value. When a relatively large amount of Sn was doped into the B-site of PrBaFe2O5+δ (e.g., x > 0.1), part of valence states of Sn in PrBaFe(2−x)SnxO5+δ was prone to decrease, resulting in a mixed valence of Sn(II) and Sn(IV). Accordingly, the average valence state of Sn decreased. This could lead to the situations where S − F ≈ 0 or even S − F < 0 and the fact that oxygen content in PrBaFe(2−x)SnxO5+δ decreased with increasing Sn doping levels, i.e., x values.
Interestingly, the oxygen content is linearly correlated with the Sn doping levels after the powder samples of PrBaFe(2−x)SnxO5+δ (x = 0, 0.05, 0.1, 0.15, 0.2, 0.3) were reduced at 800 °C for 24 h in a humidified gas mixture of 10% H2 + 90% N2. Simple curve-fitting (Fig. 4) gives,
| 5 + δ = 5.5818 − 0.7786 × x | (11) |
Combining eqn (10) with (11), one can readily obtain that the average valence state of Fe is F = 3.08, which is close to Fe(III), while the average valence state of Sn is S = 1.53, implying the coexistence of Sn(II) and Sn(I). These analysis indicate that the oxygen loss in the reduced powders of PrBaFe(2−x)SnxO5+δ (x = 0, 0.05, 0.1, 0.15, 0.2, 0.3) was mainly induced by the valence state decrease of Sn although Fe also brought a slight decrease in valence state. Therefore, the B-site doping of Sn in PrBaFe2O5+δ is an effective way to introduce oxygen deficiency.
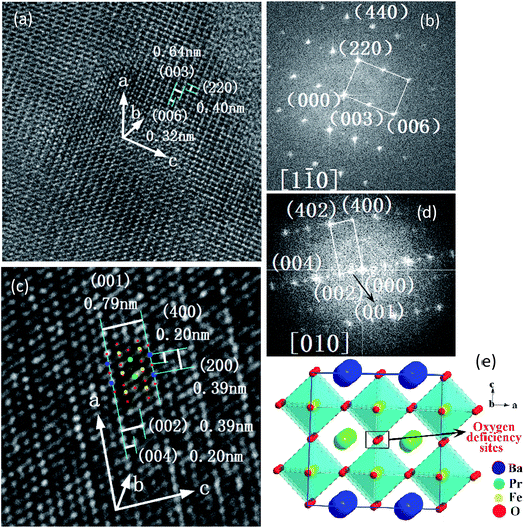
The crystal structures of PrBaSnxFe2−xO5+δ (x = 0.1) before and after reducing treatment were further characterized using TEM technique. Shown in Fig. 5a and b are the TEM image and the corresponding fast Fourier transform (FFT) diffraction of PrBaSnxFe2−xO5+δ (x = 0.1) sample respectively before reducing treatment. As can be seen from Fig. 5a, the inter-planar distances of (220) and (006) are about 0.40 and 0.32 nm respectively. The diffraction spots of (220) and (006) along the [1![[1 with combining macron]](https://www.rsc.org/images/entities/char_0031_0304.gif) 0] zone axis in Fig. 5b correspond to the 2θ of 22.7 and 28.7 degree of XRD patterns in Fig. 1 respectively. These results agree well with those of JCPDS, no. 00-057-0089, where the d(220) ≈ 0.395 nm and d(006) ≈ 0.317 nm. The inter-planar distance of (003) measured from Fig. 5a is 0.64 nm, approximately two times that of d(006). The d(003) ≈ 0.64 nm is also approximately 1.6 times that of the lattice parameter a ≈ 0.394 nm in a simple cubic perovskite La0.5Ba0.5FeO2.955 (space group: Pm
0] zone axis in Fig. 5b correspond to the 2θ of 22.7 and 28.7 degree of XRD patterns in Fig. 1 respectively. These results agree well with those of JCPDS, no. 00-057-0089, where the d(220) ≈ 0.395 nm and d(006) ≈ 0.317 nm. The inter-planar distance of (003) measured from Fig. 5a is 0.64 nm, approximately two times that of d(006). The d(003) ≈ 0.64 nm is also approximately 1.6 times that of the lattice parameter a ≈ 0.394 nm in a simple cubic perovskite La0.5Ba0.5FeO2.955 (space group: Pm![[3 with combining macron]](https://www.rsc.org/images/entities/char_0033_0304.gif) m (221), JCPDS, no. 01-080-1054). Combining these observations with XRD patterns in Fig. 1, it tends to indicate that crystal structure of PrBaSnxFe2−xO5+δ (x = 0.1) before reducing treatment is tetragonal.
m (221), JCPDS, no. 01-080-1054). Combining these observations with XRD patterns in Fig. 1, it tends to indicate that crystal structure of PrBaSnxFe2−xO5+δ (x = 0.1) before reducing treatment is tetragonal.
After reducing treatment, the TEM image and the corresponding FFT of PrBaSnxFe2−xO5+δ (x = 0.1) are shown in Fig. 5c and d respectively. The XRD patterns of PrBaSnxFe2−xO5+δ (x = 0.1) after reducing treatment (shown in Fig. 2) are quite similar to those of simple cubic La0.5Ba0.5FeO2.955 (space group: Pm![[3 with combining macron]](https://www.rsc.org/images/entities/char_0033_0304.gif) m (221), JCPDS, no. 01-080-1054). This simple observation indicates that the crystal structure of PrBaSnxFe2−xO5+δ (x = 0.1) could be cubic, which is different from tetragonal structure of PrBaSnxFe2−xO5+δ (x = 0.1) before reducing treatment as mentioned above. In fact, one can see that the characteristics of diffraction spot (006) with 2θ ≈ 28.7° disappeared in both XRD patterns (Fig. 2) and FFT diffraction (Fig. 5d), indicating that a phase transition took place. Interestingly, the characteristic diffraction spot (001/2) of double perovskites with d(001/2) = 0.79 nm appeared along the [010] zone axis as shown in Fig. 5d, which is two times d(001) = 0.394 nm in the simple cubic perovskites. Since the Miller index (h k l) should be integers, the minimum integer index (001) of double perovskites can be obtained by doubling the (001/2). Accordingly, we have h* = 2h, k* = 2k, l* = 2l, given the Miller index (h k l) of simple perovskite and (h* k* l*) of double perovskite respectively. As observed above, the lattice parameter of simple cubic La0.5Ba0.5FeO2.955 a ≈ 0.394 nm while that of PrBaSnxFe2−xO5+δ (x = 0.1) after reducing treatment a* ≈ 0.79 nm. Accordingly, the inter-planar distance d* of double perovskite is two times that of simple perovskite, i.e., d* = 2d. Compared with a simple cubic perovskite La0.5Ba0.5FeO2.955, the crystal structure of PrBaSnxFe2−xO5+δ (x = 0.1) after reducing treatment is a supercell cubic double perovskite. Fig. 5e shows a schematic illustration of such a crystal structure. The BaO layer and PrO1−δ′ (δ = 1 − 2δ′) layer are formed alternatively along the [001] direction (c axis direction), resulting in [PrFeO3]1/[BaFeO3]1 super-lattice. In the meantime, the cell parameter is doubled along the c-axis compared with simple cubic La0.5Ba0.5FeO2.955. To retain the cubic structure, the cell parameters are also doubled simultaneously along the a- and b-axis directions, forming the 2ap × 2ap × 2ap supercell lattice, here ap is the lattice parameter of simple cubic perovskite La0.5Ba0.5FeO2.955. The inter-planar distance d(001)* ≈ 0.79 nm identified in Fig. 5c is either the distance between two adjacent BaO and BaO layers, or PrO1−δ′ and PrO1−δ′ layers along the c-axis, while d(002)* ≈ 0.39 nm is the distance between two adjacent BaO and PrO1−δ′ layers along the c-axis, d(004)* ≈ 0.20 nm is the distance between two adjacent BaO and FeO layers, or PrO1−δ′ and FeO layers along the c-axis. The inter-planar distances of d(200)* ≈ 0.39 nm and d(400)* ≈ 0.20 nm can also be observed along a-axis in Fig. 5c. In addition, the inter-planar distance of d(402)* ≈ 0.18 nm can also be identified in the FFT image of Fig. 5d. The plane (002), (004) and (400), and (402) can be classified into {200}, {400}, and {420} crystal plane family respectively in cubic crystal structure, which are also observable in XRD patterns shown in Fig. 2.
m (221), JCPDS, no. 01-080-1054). This simple observation indicates that the crystal structure of PrBaSnxFe2−xO5+δ (x = 0.1) could be cubic, which is different from tetragonal structure of PrBaSnxFe2−xO5+δ (x = 0.1) before reducing treatment as mentioned above. In fact, one can see that the characteristics of diffraction spot (006) with 2θ ≈ 28.7° disappeared in both XRD patterns (Fig. 2) and FFT diffraction (Fig. 5d), indicating that a phase transition took place. Interestingly, the characteristic diffraction spot (001/2) of double perovskites with d(001/2) = 0.79 nm appeared along the [010] zone axis as shown in Fig. 5d, which is two times d(001) = 0.394 nm in the simple cubic perovskites. Since the Miller index (h k l) should be integers, the minimum integer index (001) of double perovskites can be obtained by doubling the (001/2). Accordingly, we have h* = 2h, k* = 2k, l* = 2l, given the Miller index (h k l) of simple perovskite and (h* k* l*) of double perovskite respectively. As observed above, the lattice parameter of simple cubic La0.5Ba0.5FeO2.955 a ≈ 0.394 nm while that of PrBaSnxFe2−xO5+δ (x = 0.1) after reducing treatment a* ≈ 0.79 nm. Accordingly, the inter-planar distance d* of double perovskite is two times that of simple perovskite, i.e., d* = 2d. Compared with a simple cubic perovskite La0.5Ba0.5FeO2.955, the crystal structure of PrBaSnxFe2−xO5+δ (x = 0.1) after reducing treatment is a supercell cubic double perovskite. Fig. 5e shows a schematic illustration of such a crystal structure. The BaO layer and PrO1−δ′ (δ = 1 − 2δ′) layer are formed alternatively along the [001] direction (c axis direction), resulting in [PrFeO3]1/[BaFeO3]1 super-lattice. In the meantime, the cell parameter is doubled along the c-axis compared with simple cubic La0.5Ba0.5FeO2.955. To retain the cubic structure, the cell parameters are also doubled simultaneously along the a- and b-axis directions, forming the 2ap × 2ap × 2ap supercell lattice, here ap is the lattice parameter of simple cubic perovskite La0.5Ba0.5FeO2.955. The inter-planar distance d(001)* ≈ 0.79 nm identified in Fig. 5c is either the distance between two adjacent BaO and BaO layers, or PrO1−δ′ and PrO1−δ′ layers along the c-axis, while d(002)* ≈ 0.39 nm is the distance between two adjacent BaO and PrO1−δ′ layers along the c-axis, d(004)* ≈ 0.20 nm is the distance between two adjacent BaO and FeO layers, or PrO1−δ′ and FeO layers along the c-axis. The inter-planar distances of d(200)* ≈ 0.39 nm and d(400)* ≈ 0.20 nm can also be observed along a-axis in Fig. 5c. In addition, the inter-planar distance of d(402)* ≈ 0.18 nm can also be identified in the FFT image of Fig. 5d. The plane (002), (004) and (400), and (402) can be classified into {200}, {400}, and {420} crystal plane family respectively in cubic crystal structure, which are also observable in XRD patterns shown in Fig. 2.
The electrical conductivity of PrBaFe(2−x)SnxO5+δ (x = 0, 0.1, 0.15, 0.3) was measured from 400 to 800 °C using four-probe technique in different reducing atmospheres, including the humidified hydrogen (∼3% H2O) and humidified gas mixture of hydrogen and nitrogen (H2![[thin space (1/6-em)]](https://www.rsc.org/images/entities/char_2009.gif) :
:![[thin space (1/6-em)]](https://www.rsc.org/images/entities/char_2009.gif) N2 = 1
N2 = 1![[thin space (1/6-em)]](https://www.rsc.org/images/entities/char_2009.gif) :
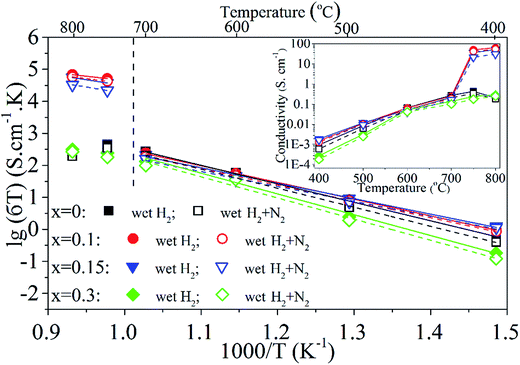
:![[thin space (1/6-em)]](https://www.rsc.org/images/entities/char_2009.gif) 1). The electrical conductivity of the bulk was monitored on-line but not recorded until it reached an equilibrium in a given operating condition. The results are shown in Fig. 6. Obviously, the electrical conductivity almost linearly increased with increasing operating temperatures from 400 to 700 °C. Beyond 700 °C, the electrical conductivity of bulk PrBaFe(2−x)SnxO5+δ (x = 0.1, 0.15) dramatically increased. The bulk demonstrated a little bit higher electrical conductivities in the humidified hydrogen than those in the humidified gas mixture of hydrogen and nitrogen, exhibiting a N-type semiconductor characteristic. With increasing the Sn doping level from 0 to 0.1, the electrical conductivity increased a little bit. With further increasing the Sn doping level from 0.1 to 0.3, the electrical conductivity decreased.
1). The electrical conductivity of the bulk was monitored on-line but not recorded until it reached an equilibrium in a given operating condition. The results are shown in Fig. 6. Obviously, the electrical conductivity almost linearly increased with increasing operating temperatures from 400 to 700 °C. Beyond 700 °C, the electrical conductivity of bulk PrBaFe(2−x)SnxO5+δ (x = 0.1, 0.15) dramatically increased. The bulk demonstrated a little bit higher electrical conductivities in the humidified hydrogen than those in the humidified gas mixture of hydrogen and nitrogen, exhibiting a N-type semiconductor characteristic. With increasing the Sn doping level from 0 to 0.1, the electrical conductivity increased a little bit. With further increasing the Sn doping level from 0.1 to 0.3, the electrical conductivity decreased.
The maximum electrical conductivity of 63.6 S cm−1 was obtained at 800 °C in humidified hydrogen with the bulk PrBaFe(2−x)SnxO5+δ (x = 0.1). It is generally recognized that the electrical conductivity of threshold requirement for anode material is 1 S cm−1 in the electrolyte-supported SOFCs while 10 S cm−1 in the anode-supported SOFCs.16 The electrical conductivities of bulk PrBaFe(2−x)SnxO5+δ (x = 0.1, 0.15) are higher than 10 S cm−1 in both humidified H2 and H2 + N2 atmospheres above 750 °C, indicating that these materials are potential anode materials for SOFCs.
As confirmed by iodometric measurement (Fig. 4), Sn(II) and Sn(I) were formed and stabilized in PrBaFe(2−x)SnxO5+δ (x = 0–0.3) in the strong reducing atmosphere of humidified hydrogen. Low valence Sn(II) could act as a donor in an atmosphere of very low oxygen partial pressures.17 In fact, the electronic structures of Fe are [Ar] 3d6 4s2 while those of Sn are [Kr] 4d10 5s2 5p2, further confirming this understanding that Sn can act as electronic donor dopant for Fe-based perovskite. With a small Sn doping level at B-site (0 < x ≤ 0.1), the electronic concentration would be increased, leading to the enhanced electrical conductivity.
However, when a relatively large amount of Sn was doped into the B-site (x ≥ 0.15), more oxygen vacancies were created, which was confirmed by above iodometric results. This in turn led to the decreased electronic concentration and electrical conductivity.
The electrical conductivity of bulk PrBaFe(2−x)SnxO5+δ (x = 0, 0.1, 0.15, 0.3) is also shown in the form of Arrhenius plot in Fig. 6. An excellent linear relationship can be observed in different atmospheres below the operating temperature of 700 °C. The corresponding activation energy (Ea) is calculated using Arrhenius equation, and the results are listed in Table 1.
| Atmosphere | Sn doping amount | |||||||
|---|---|---|---|---|---|---|---|---|
| x = 0 | x = 0.1 | x = 0.15 | x = 0.3 | |||||
| H2 | H2 + N2 | H2 | H2 + N2 | H2 | H2 + N2 | H2 | H2 + N2 | |
| Ea (eV): 400–700 °C | 1.14 | 1.18 | 1.03 | 1.01 | 0.96 | 0.92 | 1.29 | 1.31 |
| Ea (eV): 750–800 °C | — | — | 0.53 | 0.59 | 0.74 | 0.77 | — | — |
As shown in Table 1, for a given Sn doping level, the activation energies (Ea) are very close to each other in the atmosphere of humidified hydrogen and humidified gas mixture of hydrogen and nitrogen. However, the Ea values strongly depend on the Sn doping levels and obtained relatively low values with the Sn doping levels of x = 0.1, 0.15. When the operating temperature was beyond 750 °C, the activation energy was significantly decreased, particularly for PrBaFe(2−x)SnxO5+δ with Sn doping level of x = 0.1. These results indicate that the Sn doping levels of x = 0.1, 0.15 are close to the optimal doping amounts.
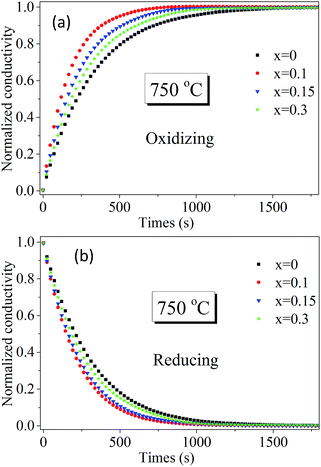
To further identify Sn doping effects on ionic conductivity and surface exchange kinetics of bulk PrBaFe(2−x)SnxO5+δ (x = 0, 0.1, 0.15, 0.3), electrical conductivity relaxation (ECR) technique was employed to determine bulk diffusivity and surface exchange coefficient. Fig. 7 shows the relaxation history of normalized electrical conductivity of bulk PrBaFe(2−x)SnxO5+δ (x = 0, 0.1, 0.15, 0.3) at 750 °C when the surrounding atmosphere was switched between the humidified hydrogen and humidified gas mixture of hydrogen and nitrogen (H2![[thin space (1/6-em)]](https://www.rsc.org/images/entities/char_2009.gif) :
:![[thin space (1/6-em)]](https://www.rsc.org/images/entities/char_2009.gif) N2 = 1
N2 = 1![[thin space (1/6-em)]](https://www.rsc.org/images/entities/char_2009.gif) :
:![[thin space (1/6-em)]](https://www.rsc.org/images/entities/char_2009.gif) 1 in volume ratio). Obviously, the relaxation behaviors from the fastest to the lowest are ordered with the Sn doping levels of x = 0.1, 0.15, 0.3, 0 in both reducing and oxidizing conditions. The corresponding surface exchange coefficient and bulk diffusivity were extracted from the ECR curves and are summarized in Table 2. In the oxidizing condition, the surface exchange coefficient and bulk diffusivity of PrBaFe(2−x)SnxO5+δ (x = 0.1) reached 3.56 × 10⁻⁶ m s−1 and 4.22 × 10⁻⁷ m2 s−1 respectively. With Sn doping level increasing from 0.1 to 0.3 or decreasing from 0.1 to 0, both the surface exchange coefficient and bulk diffusivity decreased monotonically. In the reducing condition, the surface exchange coefficient and bulk diffusivity demonstrated the similar trend. It is also noticed that both the surface exchange coefficient and bulk diffusivity in the reducing condition were much higher than those in the oxidizing condition.
1 in volume ratio). Obviously, the relaxation behaviors from the fastest to the lowest are ordered with the Sn doping levels of x = 0.1, 0.15, 0.3, 0 in both reducing and oxidizing conditions. The corresponding surface exchange coefficient and bulk diffusivity were extracted from the ECR curves and are summarized in Table 2. In the oxidizing condition, the surface exchange coefficient and bulk diffusivity of PrBaFe(2−x)SnxO5+δ (x = 0.1) reached 3.56 × 10⁻⁶ m s−1 and 4.22 × 10⁻⁷ m2 s−1 respectively. With Sn doping level increasing from 0.1 to 0.3 or decreasing from 0.1 to 0, both the surface exchange coefficient and bulk diffusivity decreased monotonically. In the reducing condition, the surface exchange coefficient and bulk diffusivity demonstrated the similar trend. It is also noticed that both the surface exchange coefficient and bulk diffusivity in the reducing condition were much higher than those in the oxidizing condition.
| Step change of oxygen partial pressure | Sn doping amount | |||||||
|---|---|---|---|---|---|---|---|---|
| x = 0 | x = 0.1 | x = 0.15 | x = 0.3 | |||||
| kex (10−6 m s−1) | Dchem (10 −7 m2 s−1) | kex (10−6 m s−1) | Dchem (10 −7 m2 s−1) | kex (10−6 m s−1) | Dchem (10 −7 m2 s−1) | kex (10−6 m s−1) | Dchem (10 −7 m2 s−1) | |
| H2 → H2 + N2 | 2.30 | 0.57 | 3.56 | 4.22 | 3.28 | 3.12 | 2.76 | 1.58 |
| H2 + N2 → H2 | 2.98 | 3.14 | 4.42 | 6.04 | 3.32 | 5.52 | 3.18 | 4.27 |
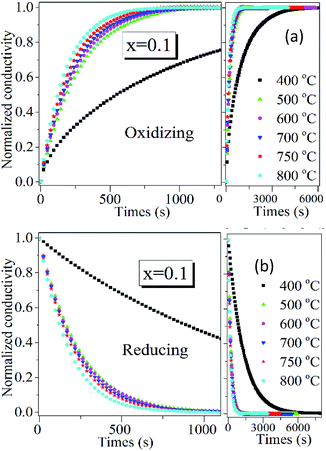
Since PrBaFe(2−x)SnxO5+δ (x = 0.1) demonstrated relatively high surface exchange kinetics and bulk diffusivity at 750 °C, it was further studied in a wide temperature range of 400–800 °C. Fig. 8 shows the relaxation history of normalized electrical conductivity of bulk PrBaFe(2−x)SnxO5+δ (x = 0.1) when the surrounding atmosphere was switched between humidified hydrogen and humidified gas mixture of hydrogen and nitrogen. It is easy to see that the relaxation time monotonically decreased with increasing operating temperature from 400 to 800 °C. Table 3 summarizes the surface exchange coefficient and bulk diffusivity extracted from ECR curves in Fig. 8. The surface exchange coefficient and bulk diffusivity reached 4.35 × 10⁻⁶ m s−1 and 5.34 × 10⁻⁷ m2 s−1 respectively at 800 °C in the oxidizing condition. These two parameters then monotonically decreased with decreasing operating temperatures, and reached 5.9 × 10⁻⁷ m s−1 and 3.72 × 10⁻¹⁰ m2 s−1 respectively at 400 °C. In the reducing condition, the surface exchange coefficient and bulk diffusivity showed similar treads but higher than those in the oxidizing condition, implying that it is easier for PrBaFe(2−x)SnxO5+δ (x = 0.1) to release oxygen to than intake from the surrounding atmosphere.
| Step change of oxygen partial pressure | Operating temperature | |||||||||||
|---|---|---|---|---|---|---|---|---|---|---|---|---|
| 400 °C | 500 °C | 600 °C | 700 °C | 750 °C | 800 °C | |||||||
| kex (10−6 m s−1) | Dchem (10 −10 m2 s−1) | kex (10−6 m s−1) | Dchem (10 −7 m2 s−1) | kex (10−6 m s−1) | Dchem (10 −7 m2 s−1) | kex (10−6 m s−1) | Dchem (10 −7 m2 s−1) | kex (10−6 m s−1) | Dchem (10 −7 m2 s−1) | kex (10−6 m s−1) | Dchem (10 −7 m2 s−1) | |
| H2 → H2 + N2 | 0.59 | 3.72 | 1.31 | 1.5 | 2.31 | 2.74 | 3.02 | 3.48 | 3.56 | 4.22 | 4.35 | 5.34 |
| H2 + N2 → H2 | 1.08 | 2.92 | 2.65 | 3.58 | 3.16 | 3.85 | 4.05 | 5.39 | 4.42 | 6.04 | 4.97 | 6.70 |
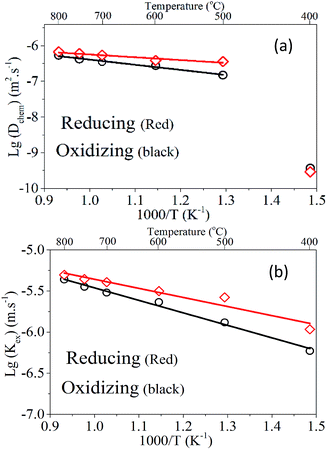
Using the data in Table 3, the temperature-dependent bulk diffusivity and surface exchange coefficient are also obtained and represented in Fig. 9a and b respectively in the Arrhenius format. The bulk diffusivity showed a good linear relationship with the operating temperature in the temperature range of 500–800 °C. The surface exchange coefficient demonstrated an excellent linear relationship with the operating temperature in the temperature range of 400–800 °C. Using the simple curve-fitting technique, one can obtain Arrhenius equations for bulk diffusivity and surface exchange coefficient, in particular for, oxidizing process:
 | (12) |
 | (13) |
 | (14) |
 | (15) |
The chemical compatibility of PrBaFe1.9Sn0.1O5+δ with commonly used oxygen ionic conducting electrolyte materials was studied, including LSGM (La0.80Sr0.20Ga0.80Mg0.20O3−δ), SDC (Sm0.20Ce0.80O1.9), and YSZ (8% yttria-stabilized zirconia). For this purpose, the mixture of PrBaFe1.9Sn0.1O5+δ and an electrolyte material was calcinated at 1150 °C in air for 24 h. The XRD patterns of individual materials and the mixtures were then examined. Fig. 10a shows the XRD patterns of PrBaFe1.9Sn0.1O5+δ, and LSGM, as well as their mixture before and after calcinating treatment. The diffraction peaks corresponded to either PrBaFe1.9Sn0.1O5+δ or LSGM. No peaks corresponding to other phases appeared, indicating that PrBaFe1.9Sn0.1O5+δ is chemically compatible with LSGM. Fig. 10b shows the XRD patterns of PrBaFe1.9Sn0.1O5+δ, and SDC, as well as their mixture before and after calcinating treatment. Obviously, the diffraction peaks corresponded to either PrBaFe1.9Sn0.1O5+δ or SDC. No peaks corresponding to other phases appeared, indicating that PrBaFe1.9Sn0.1O5+δ is also chemically compatible with SDC. However, the XRD patterns shown in Fig. 10c indicated that the new phases of BaZrO3 and Pr2Zr2O7 were generated after the mixture of PrBaFe1.9Sn0.1O5+δ and YSZ was calcinated. This result also agrees well with those in open literature.18,19
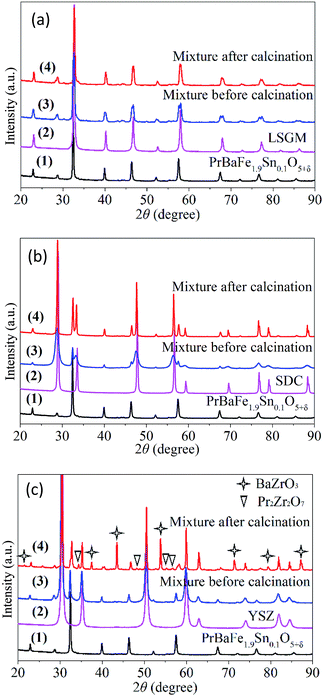 | ||
| Fig. 10 The XRD patterns of PrBaFe1.9Sn0.1O5+δ, and its mixtures with electrolyte material of (a) LSGM, (b) SDC, and (c) YSZ before and after heat treatment at 1150 °C in air for 24 h. | ||
The PrBaFe1.9Sn0.1O5+δ as anode material was evaluated using a symmetrical cell with the configuration of PrBaFe1.9Sn0.1O5+δ|LSGM|PrBaFe1.9Sn0.1O5+δ. The symmetrical cell assembly was sealed in a tubular quartz chamber. The humidified hydrogen with the flow rate of 50 mL min−1 flew through the chamber. The temperature of the chamber was controlled by a high temperature furnace. The symmetrical cell was first reduced at 850 °C for 2 h. The impedance spectra of the reduced symmetrical cell were subsequently measured in the temperature range of 700–850 °C. The results are shown in Fig. 11a. For convenient comparison, the ohmic resistance was graphically eliminated from the impedance spectra. The difference between low frequency intercept and high frequency intercept with real axis represents the overall polarization resistance of the electrodes. The area specific resistance (ASR) of individual electrode was then obtained by using the half of overall polarization resistance multiplying effective area of electrode. The ASR of the PrBaFe1.9Sn0.1O5+δ anode obtained from this analysis are 0.529, 0.285, 0.141 and 0.095 Ω cm2 at 700, 750, 800 and 850 °C, respectively. Table 4 lists the ASR of different anodes in open literature. Obviously the ASR of the PrBaFe1.9Sn0.1O5+δ anode prepared in this work is better than or comparable to the best of ceramic anodes in open literature.
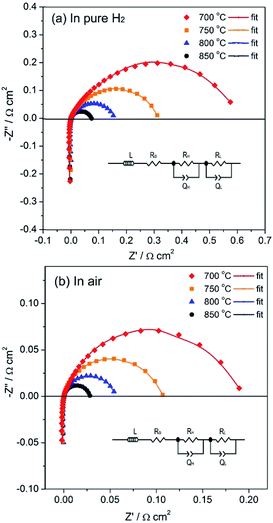 | ||
| Fig. 11 Impedance spectra of symmetrical cells PrBaFe1.9Sn0.1O5+δ|LSGM|PrBaFe1.9Sn0.1O5+δ measured in pure H2 (a) and in air (b) at different temperatures. | ||
| Anode | Electrolyte | Temperature (°C) | ASR (Ω cm2) | Ref. |
|---|---|---|---|---|
| Ni-YSZ | YSZ | 800 | 0.16 | 20 |
| La0.75Sr0.25Cr0.5Mn0.5O3 | YSZ | 900 | 0.26 | 6 |
| Sr2Fe1.5Mo0.5O6−δ | LSGM | 850 | 0.21 | 9 |
| Sr2MgMoO6−δ | LSGM | 850 | 0.48 | 21 |
| Sr2Co1.1Mo0.9O6−δ | LSGM | 800 | ∼0.35 | 22 |
| La4Sr8Ti11Mn0.5Ga0.5O38−δ/YSZ | YSZ | 850 | ∼0.25 | 23 |
| Sr2FeMo0.65Ni0.35O6−δ | LSGM | 850 | 0.106 | 24 |
| 800 | 0.163 | |||
| 750 | 0.290 | |||
| PrBaFe1.9Sn0.1O5+δ | LSGM | 850 | 0.095 | This work |
| 800 | 0.141 | |||
| 750 | 0.285 |
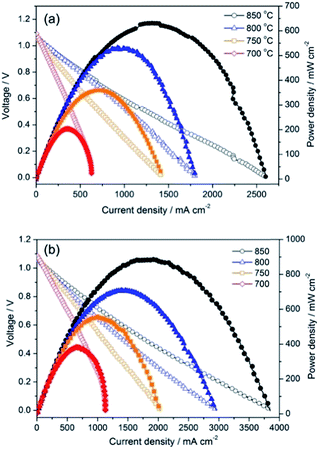
The PrBaFe1.9Sn0.1O5+δ as an anode material was further evaluated using the LSGM electrolyte-supported single cell with the configuration of PrBaFe1.9Sn0.1O5+δ|LSGM|SDC|PrBaCo2O5+δ, where a SDC buffer layer was used to avoid chemical reactions between LSGM and PrBaCo2O5+δ. Fig. 12a shows the electrochemical performance of the cell when the humidified hydrogen was used as the fuel and ambient air as the oxidant. The maximum power density reached 203.9, 360.1. 532.4 and 631.7 mW cm−2 at 700, 750, 800 and 850 °C, respectively. The cross-sectional view of the post-test electrode/electrolyte interface is depicted in Fig. S5,† suggesting intimate contacts at the interface.
Since PrBaFe1.9Sn0.1O5+δ can be used as both anode and cathode materials for SOFCs, LSGM electrolyte-supported symmetrical single cell was fabricated with PrBaFe1.9Sn0.1O5+δ as both anode and cathode. Compared with traditional SOFCs where anode material is different from the cathode material, symmetrical one has many advantages. For example, the fabrication process for a symmetrical SOFC is simpler than the conventional one, therefore reducing the cost of cell fabrication. The symmetrical design may mitigate thermal stresses induced by thermal mismatch among different layers especially the interfaces between the neighboring layers, improving stability and reliability for a long-term operation.25
In the above studies, the ASR of PrBaFe1.9Sn0.1O5+δ electrode was measured in a reducing atmosphere at different temperatures. To evaluate PrBaFe1.9Sn0.1O5+δ as potential cathode material, the ASR of PrBaFe1.9Sn0.1O5+δ electrode was determined using impedance spectra and symmetrical cell of PrBaFe1.9Sn0.1O5+δ|LSGM|PrBaFe1.9Sn0.1O5+δ in air at the temperatures of 700–850 °C. The resulting ASRs of PrBaFe1.9Sn0.1O5+δ electrode were 0.030, 0.061, 0.108, and 0.205 Ω cm2 at 850 °C, 800, 750 and 700 °C, respectively (Fig. 11b). These results are comparable to those of high performance cathode materials reported in literature, such as SmBaCo2Ox5+x (0.031 Ω cm2 at 800 °C),26 PrBa0.5Sr0.5Co2O5+x (0.027 Ω cm2 at 800 °C).27 The electrochemical performance of the symmetrical cell PrBaFe1.9Sn0.1O5+δ|LSGM|PrBaFe1.9Sn0.1O5+δ was then measured using the humidified hydrogen as the fuel and ambient air as the oxidant. As shown in Fig. 12b, the peak power densities of the PrBaFe1.9Sn0.1O5+δ symmetrical single cell reached 889.6, 709.7, 558.5 and 387.2 mW cm−2 at 850, 800, 750 and 700 °C, respectively. These results are also comparable to other high performance symmetrical cell in literature,28 where the (Pr0.4)xSr0.6Co0.2Fe0.7Nb0.3O3−δ was used as electrode material and the power density of 0.94 W cm−2 was obtained at 850 °C with a 265 μm thick LSGM electrolyte. The SEM images of the post-test cell indicate that the electrodes intimately contacted with the electrolyte, no interfacial delamination was observed (Fig. S6†).
3. Experimental section
3.1. Material synthesis
The PrBaFe(2−x)SnxO5+δ (x = 0, 0.05, 0.1, 0.15, 0.2, 0.3) powders were synthesized using a combustion method. Specifically, Pr(NO3)3, Ba(NO3)2, Fe(NO3)3·9H2O and SnCl2 were used as metal precursors. Citric acid monohydrate was used as metal ion complexing agent, and poly(vinyl alcohol) (PVA) was used as the combustion fuel. Metal precursors in stoichiometric ratio and citric acid monohydrate as well as PVA were dissolved in deionized water under the condition of continuous heating and magnetic stirring to form a clear dark-red solution. After heating and stirring for a few hours, the solution was converted into a dark red-brown concentrated liquid, which was subsequently heated up for combustion, resulting in porous black powders. The black powders were then grinded and subsequently fired at 600 °C for 1 h to remove organic residues, and then calcined at 1000 °C for 6 h in air to obtain pure phase PrBaFe(2−x)SnxO5+δ. The heating and cooling rates were 3 °C min−1 for firing and calcination. Layered PrBaCo2O5+δ (PBCO) powder was synthesized using Pechini process with Pr6O11, Ba(NO3)2·9H2O and Co(NO3)2·6H2O as precursors, followed by calcinations at 950 °C in air for 5 h.3.2. Characterization of phase stability
The synthesized powders of PrBaFe(2−x)SnxO5+δ (x = 0, 0.05, 0.1, 0.15, 0.2, 0.3) were heat-treated at 800 °C for 24 h in a reducing atmosphere of humidified hydrogen–nitrogen mixture with H2![[thin space (1/6-em)]](https://www.rsc.org/images/entities/char_2009.gif) :
:![[thin space (1/6-em)]](https://www.rsc.org/images/entities/char_2009.gif) N2 = 1
N2 = 1![[thin space (1/6-em)]](https://www.rsc.org/images/entities/char_2009.gif) :
:![[thin space (1/6-em)]](https://www.rsc.org/images/entities/char_2009.gif) 9 in volume ratio. The X-ray diffraction (XRD) patterns of the powders were examined before and after the treatment.
9 in volume ratio. The X-ray diffraction (XRD) patterns of the powders were examined before and after the treatment.
The redox stability of PrBaFe(2−x)SnxO5+δ (x = 0.1) powder was examined at 800 °C in a cycling atmosphere, where the humidified gas mixture (H2![[thin space (1/6-em)]](https://www.rsc.org/images/entities/char_2009.gif) :
:![[thin space (1/6-em)]](https://www.rsc.org/images/entities/char_2009.gif) N2 = 1
N2 = 1![[thin space (1/6-em)]](https://www.rsc.org/images/entities/char_2009.gif) :
:![[thin space (1/6-em)]](https://www.rsc.org/images/entities/char_2009.gif) 9 in volume ratio) and dry air were switched alternatively. In the long cycling test, the humidified gas mixture was supplied for 24 h followed by the supply of dry air for 24 h. In the short cycling test, the humidified gas mixture was supplied for 30 min followed by the supply of dry air for 30 min. The nitrogen was used to purge the system in between. The short cycling test was last for about 12 h. The XRD patterns of the powders were obtained before and after the cycling tests.
9 in volume ratio) and dry air were switched alternatively. In the long cycling test, the humidified gas mixture was supplied for 24 h followed by the supply of dry air for 24 h. In the short cycling test, the humidified gas mixture was supplied for 30 min followed by the supply of dry air for 30 min. The nitrogen was used to purge the system in between. The short cycling test was last for about 12 h. The XRD patterns of the powders were obtained before and after the cycling tests.
3.3. Characterizations of powder materials
The phase identification of powder materials was studied using the powder XRD by Cu-Kα radiation (D/MAX-3C) with a scanning rate of 5° min−1 in the range of 10° ≤ 2θ ≤ 90°. The micro-morphology and composition of the powders were investigated by thermal field-emission scanning electron microscopy (SEM, Zeiss ultra-plus) equipped with energy dispersive X-ray analysis (EDS). The high-resolution transmission electron microscopy (HRTEM) (JEOL JEM-2100F) was used to study crystal structures of the powder materials.Chemical compositions (metal ratios) of the powders were analyzed by Perkin-Elmer Inductively Coupled Plasma-Optical Emission Spectrometer (ICP-OES). Praseodymium (Pr), barium (Ba), iron (Fe) and tin (Sn) standard solutions used for ICP test were purchased from Sigma Corporation. The solutions were diluted with deionized water to obtain required concentrations, which was used for calibrations. PrBaFe(2−x)SnxO5+δ (x = 0, 0.05, 0.1, 0.15, 0.2, 0.3) powders were dissolved completely into 6 N (mol L−1 was abbreviated as N) hydrochloric acid (HCl) under the condition of heating and continuing magnetic stirring, which was subsequently diluted with deionized water to form a transparent acidic solution with the pH ≈ 1 for analysis.
3.4. Determination of oxygen content with iodometry
The oxygen content of the powders PrBaFe(2−x)SnxO5+δ (x = 0, 0.05, 0.1, 0.15, 0.2, 0.3) was determined using iodine titration technique at room temperature.29 The 0.100 g of dry PrBaFe(2−x)SnxO5+δ powder and 1.000 g of potassium iodide (KI) were weighed and placed in a 250 mL three-neck flask glass vessel. A few drops of deionized water were then added into the vessel. The air in the flask glass vessel and the system was purged using dry N2 with a flowing rate of 40 mL min−1 for 30 min. Then, 30 mL HCl with a concentration of 6 N was added into the vessel, and the vessel was heated up and maintained at ∼108 °C, the azeotropic point of 6 N HCl, under continuous magnetic stirring until the powders were dissolved completely and a clear and transparent solution was formed in a dark environment. The heating of the vessel was terminated and 30 mL deionized water was added to dilute the solution and cool down the temperature. The solution was then titrated with 0.0337 N sodium thiosulfate (Na2S2O3) solution. Since the reaction of iodine and starch leads to a characteristic color, about 1 mL starch solution (1%, wt) was used as an indicator to determine the titration endpoint. In the entire process, the flowing N2 was used to protect excess I−, Na2S2O3, and low valence transition metal cations from oxidation.3.5. Chemical compatibility of PrBaFe1.9Sn0.1O5+δ with electrolyte materials
The widely used electrolyte materials, LSGM (La0.80Sr0.20Ga0.80Mg0.20O3−x) and SDC (Sm0.20Ce0.80O1.9) were purchased from Fuel Cell Materials Corporation, and YSZ (8% yttria-stabilized zirconia) was purchased from Tosoh Corporation.The as-synthesized PrBaFe1.9Sn0.1O5+δ powder was mixed with the electrolyte material with the weight ratio of 1![[thin space (1/6-em)]](https://www.rsc.org/images/entities/char_2009.gif) :
:![[thin space (1/6-em)]](https://www.rsc.org/images/entities/char_2009.gif) 1, and grinded to form a powder mixture. The mixed powders were then dry-pressed into bulks, which were subsequently calcined at 1150 °C for 24 h in air. The calcinated bulks were then grinded into fine powders. The XRD patterns of the fine powders were examined and compared with those of the individual materials.
1, and grinded to form a powder mixture. The mixed powders were then dry-pressed into bulks, which were subsequently calcined at 1150 °C for 24 h in air. The calcinated bulks were then grinded into fine powders. The XRD patterns of the fine powders were examined and compared with those of the individual materials.
3.6. Electrical conductivity and electrical conductivity relaxation (ECR) measurements
The synthesized PrBaFe(2−x)SnxO5+δ (x = 0, 0.1, 0.15, 0.3) powders were mixed with a binder material of 1% (wt%) ethyl cellulose, then isostatically cold-pressed into a rectangular bar (40 × 8 × 2 mm) with a stainless steel mold at 600 MPa. The bar was sintered at 1150 °C for 5 h in air, resulting in a relative density over 97% as confirmed by Archimedes' method. Four silver wires were attached onto the surface of sample bar at well-aligned four different locations using silver paste (Heraeus 2807). The sample bar with silver wire assembly is sealed in an alumina test chamber. The temperature of the chamber is controlled by a high temperature tube furnace. The humidified gas mixture of hydrogen and nitrogen was supplied to the test chamber. The conductivity of the sample bar is automatically recorded using a digital multimeter (Agilent 4284A) in combination with a computer system. To obtain gas mixture with different oxygen partial pressures, two routes of gas supply subsystems were employed. The humidified gas mixture of one route is composed of 50% H2 and 50% N2; while another route is composed of 100% H2. In either route, the total flow rate of the humidified gas was controlled at 100 mL min−1. The overall electrical conductivity of the sample bar was monitored on-line but not recorded until it reached an equilibrium at a given operating temperature and gas atmosphere. For electrical conductivity relaxation measurement, one of the gas mixtures was supplied to the alumina chamber. After stabilization of sample conductivity, the supplied gas mixture was instantly switched to another one until it reached an equilibrium. The relaxation history of sample conductivity was recorded during this process. The surface exchange coefficient and bulk diffusivity were then extracted from electrical conductivity relaxation data using an algorithm. The details were described elsewhere.303.7. Cell fabrication and electrochemical characterization
Electrolyte-supported button cells were employed to rapidly evaluate PrBaFe1.9Sn0.1O5+δ as electrode material. In literature, both LSGM and YSZ were widely used as electrolyte materials for this purpose (see examples in Table 4). Since electrolytes have little effect on ASRs of the concerned material, here we use LSGM as a model electrolyte material for the button cell fabrications. The LSGM powders were mixed with the binder of polyvinyl butyral (1% wt). The mixed powders were isostatically cold-pressed at 600 MPa to form an electrolyte substrate with a diameter of ∼10 mm. The green electrolyte substrate was then sintered at 1470 °C for 5 h in air to form a dense electrolyte. The surface of sintered LSGM electrolyte substrate was mechanically polished using sand-papers, and subsequently washed by anhydrous ethanol in an ultrasonic cleaner. The resulting thickness of LSGM electrolyte substrates was about 300 μm. The fine electrode material (PrBaFe1.9Sn0.1O5+δ, PrBaCo2O5+δ) powders (40% wt) were grinded with ethyl-cellulose and α-terpineol (6% wt and 54% wt, respectively, Alfa Aesar, USA) to form electrode inks. The electrode inks were then screen-printed onto either side of dense LSGM electrolyte substrate. After drying and aging, the electrode–electrolyte assembly was fired at 1100 °C in air for 1 h to form a symmetrical cell PrBaFe1.9Sn0.1O5+δ/LSGM/PrBaFe1.9Sn0.1O5+δ. A single cell PrBaFe1.9Sn0.1O5+δ/LSGM/SDC/PrBaCo2O5+δ was fabricated using the similar process, where a buffer layer of SDC was embedded between LSGM and PrBaCo2O5+δ to avoid chemical reactions. The SDC buffer layer was first screen-printed onto the LSGM electrolyte and then sintered at 1400 °C for 2 h in air, followed by screen-printing PrBaCo2O5+δ layer and sintering at 1000 °C for 3 h in air. The resulting effective area of electrodes was about 0.5 cm2, and the thickness of electrodes was about 25 μm. The electrochemical impedance spectra (EIS) of the symmetrical cell PrBaFe1.9Sn0.1O5+δ/LSGM/PrBaFe1.9Sn0.1O5+δ were obtained in both air and pure hydrogen from 700 to 850 °C under open circuit voltage conditions. The Solatron 1260 frequency response analyzer in combination with a Solartron 1287 potentiostat was used for EIS measurement with a voltage perturbation of 10 mV over the sweeping frequency range from 0.01 Hz to 106 Hz. Single cells were tested from 700 to 850 °C with the humidified hydrogen (∼3% H2O) as a fuel and the static air as an oxidant. The flow rate of fuel was controlled at 50 mL min−1 using a precision flow meter (APEX). The voltage–current curves and EIS were obtained using the Solatron electrochemical workstation.4. Conclusion
Sn doped PrBaFe2O5+δ double perovskites PrBaFe(2−x)SnxO5+δ (x = 0, 0.05, 0.1, 0.15, 0.2, 0.3) were successfully synthesized using a combustion method. The as-synthesized PrBaFe(2−x)SnxO5+δ exhibited different crystal structures depending on Sn doping levels. The materials also demonstrated excellent stability in both reducing and redox atmospheres at elevated temperatures. The transitions between tetragonal and cubic phases were also observed for PrBaFe(2−x)SnxO5+δ (x = 0.05, 0.1, 0.15) after redox treatment. The oxygen content in the as-prepared PrBaFe(2−x)SnxO5+δ was nonlinearly correlated to the Sn doping level and reached maximum values at x = 0.1, 0.15. After reducing treatment, the oxygen content linearly decreased with increasing Sn doping levels. The electrical conductivity of PrBaFe(2−x)SnxO5+δ (x = 0, 0.1, 0.15, 0.3) exhibited an N-type semiconducting characteristics, and almost linearly increased with increasing operating temperatures from 400 to 700 °C, but dramatically increased beyond 700 °C for Sn doping levels of x = 0.1, 0.15. The maximum electrical conductivity of 63.6 S cm−1 was obtained at 800 °C in humidified hydrogen with the bulk PrBaFe(2−x)SnxO5+δ (x = 0.1). The surface exchange coefficient and bulk diffusivity of PrBaFe(2−x)SnxO5+δ with Sn doping level of x = 0.1 reached the maximum values, and decreased monotonically with both decreasing and increasing Sn doping levels. Both the surface exchange coefficient and bulk diffusivity in the reducing condition were much higher than those in the oxidizing condition. The surface exchange coefficient and bulk diffusivity of PrBaFe(2−x)SnxO5+δ (x = 0.1) decreased with decreasing operating temperatures. The activation energies of bulk diffusivity and surface exchange coefficient of PrBaFe(2−x)SnxO5+δ (x = 0.1) in oxidizing condition are higher than those in reducing condition. The PrBaFe(2−x)SnxO5+δ (x = 0.1) also demonstrated chemical compatibility with electrolyte materials of LSGM and SDC. The ASRs of both PrBaFe1.9Sn0.1O5+δ anode and cathode electrode prepared in this work were comparable to those of ceramic anode and high performance cathode respectively in open literature. The peak power densities of LSGM electrolyte-supported symmetrical cell with PrBaFe1.9Sn0.1O5+δ electrodes were also comparable to those of high performance symmetrical cells in open literature.Acknowledgements
This work was financially supported by US Department of Energy through National Energy Technology Laboratory under grant number DE-FE0024059.References
- B. C. H. Steele and A. Heinzel, Nature, 2001, 414, 345–352 CrossRef CAS PubMed.
- M. F. Liu, Y. M. Choi, L. Yang, K. Blinn, W. T. Qin, P. Liu and M. L. Liu, Nano Energy, 2012, 1, 448–455 CrossRef CAS.
- L. Yang, S. Z. Wang, K. Blinn, M. F. Liu, Z. Liu, Z. Cheng and M. L. Liu, Science, 2009, 326, 126–129 CrossRef CAS PubMed.
- S. Park, J. M. Vohs and R. J. Gorte, Nature, 2000, 404, 265–267 CrossRef CAS PubMed.
- Z. L. Zhan and S. A. Barnett, Science, 2005, 308, 844–847 CrossRef CAS PubMed.
- S. W. Tao and J. Irvine, Nat. Mater., 2003, 2, 320–323 CrossRef CAS PubMed.
- A. Atkinson, S. Barnett, R. J. Gorte, J. T. S. Irvine, A. J. Mcevoy, M. Mogensen, S. C. Singhal and J. Vohs, Nat. Mater., 2004, 3, 17–27 CrossRef CAS PubMed.
- Y. H. Huang, R. I. Dass, Z. L. Xing and J. B. Goodenough, Science, 2006, 312, 254–257 CrossRef CAS PubMed.
- Q. Liu, X. H. Dong, G. L. Xiao, F. Zhao and F. L. Chen, Adv. Mater., 2010, 22, 5478–5482 CrossRef CAS PubMed.
- A. A. Taskin, A. N. Lavrov and Y. Ando, Appl. Phys. Lett., 2005, 86, 091910 CrossRef.
- R. Pelosato, G. Cordaro, D. Stucchi, C. Cristiani and G. Dotelli, J. Power Sources, 2015, 298, 46–67 CrossRef CAS.
- S. Sengodan, S. Choi, A. Jun, T. H. Shin, Y. W. Ju, H. Y. Jeong, J. Shin, J. T. S. Irvine and G. Kim, Nat. Mater., 2015, 14, 205–209 CrossRef CAS PubMed.
- H. P. Ding, Z. T. Tao, S. Liu and J. J. Zhang, Sci. Rep., 2015, 5, 18129 CrossRef CAS PubMed.
- Y. H. Chen, Z. X. Cheng, Y. Yang, Q. W. Gu, D. Tian, X. Y. Lu, W. L. Yu and B. Lin, J. Power Sources, 2016, 310, 109–117 CrossRef CAS.
- P. Karen, J. Solid State Chem., 2004, 177, 281–292 CrossRef CAS.
- P. I. Cowin, C. T. G. Petit, R. Lan, J. T. S. Irvine and S. W. Tao, Adv. Energy Mater., 2011, 1, 314–332 CrossRef CAS.
- K. Kobayashi, Y. Doshida, Y. Mizuno and C. A. Randall, Jpn. J. Appl. Phys., 2014, 53, 011501 CrossRef.
- H. G. Shi, B. B. Yang, C. Li and Z. P. Shao, Sci. China: Chem., 2011, 41, 1871–1876 Search PubMed.
- A. J. Jacobson, Chem. Mater., 2010, 22, 660–674 CrossRef CAS.
- T. Suzuki, M. Awano, P. Jasinski, V. Petrovsky and H. U. Anderson, Solid State Ionics, 2006, 177, 2071–2074 CrossRef CAS.
- L. Jiang, G. Liang, J. T. Han and Y. H. Huang, J. Power Sources, 2014, 270, 441–448 CrossRef CAS.
- T. Wei, Q. Zhang, Y. H. Huang and J. B. Goodenough, J. Mater. Chem., 2012, 22, 225–231 RSC.
- J. C. Ruiz-Morales, J. Canales-Vázquez, C. Savaniu, D. Marrero-López, W. Z. Zhou and J. T. S. Irvine, Nature, 2006, 439, 568–571 CrossRef CAS PubMed.
- Z. H. Du, H. L. Zhao, S. Yi, Q. Xia, Y. Gong, Y. Zhang, X. Cheng, Y. Li, L. Gu and K. Swierczek, ACS Nano, 2016, 10, 8660–8669 CrossRef CAS PubMed.
- S. Choi, S. Sengodan, S. Park, Y. W. Ju, J. Kim, J. Hyodo, H. Y. Jeong, T. Ishihara, J. Shin and G. Kim, J. Mater. Chem. A, 2016, 4, 1747–1753 CAS.
- Q. J. Zhou, T. M. He and Y. Ji, J. Power Sources, 2008, 185, 754–758 CrossRef CAS.
- S. Q Lü, G. H Long, X. W. Meng, Y. Ji, B. R. Lü and H. Y. Zhao, Int. J. Hydrogen Energy, 2012, 37, 5914–5919 CrossRef.
- P. Zhang, G. Q. Guan, D. S. Khaerudini, X. G. Hao, M. F. Han, Y. Kasai, K. Sasagawa and A. Abudula, J. Power Sources, 2014, 248, 163–171 CrossRef CAS.
- K. Conder, E. Pomjakushina, A. Soldatov and E. Mitberg, Mater. Res. Bull., 2005, 40, 257–263 CrossRef CAS.
- F. He, X. F. Jin, T. F. Tian, H. P. Ding, R. D. Green and X. J. Xue, J. Electrochem. Soc., 2015, 162, F951–F958 CrossRef CAS.
Footnote |
| † Electronic supplementary information (ESI) available. See DOI: 10.1039/c7ra03143b |
| This journal is © The Royal Society of Chemistry 2017 |

