 Open Access Article
Effects of humidity on the sliding wear properties of Zn–Ni alloy coatings
L. Lee ,
P. Behera,
K. R. Sriraman
 and
R. R. Chromik*
Department of Mining and Materials Engineering, McGill University, Montreal, Canada. E-mail: richard.chromik@mcgill.ca
First published on 25th April 2017
Abstract
Zn–Ni alloy coatings were developed in the 1980's as a replacement for pure zinc coatings as a sacrificial coating for steel in the automotive industry due to their better corrosion resistance and hydrogen embrittlement properties. More recently, the aerospace industry has taken an interest in these coatings because cadmium, the sacrificial coatings used for steel in the aerospace industry, is toxic and carcinogenic in nature. Although Zn–Ni coatings are mainly used for corrosion protection, an interest in their tribological properties has arisen due to their high hardness. In this study, tribological tests were performed with a reciprocating pin-on-flat tribometer using a steel countersphere on a commercially electrodeposited Zn-14 wt%–Ni coating under relative humidity levels of 0, 20, 40 and 60% with a normal load of 3.5 N. Worn surfaces, debris and transfer films were examined for their morphology, chemistry and microstructure using electron microscopy, energy-dispersive X-ray spectroscopy, X-ray diffraction and Raman spectroscopy. Wear rates were also determined using non-contact profilometry. Tribological behaviour of the coatings under the same contact conditions but different humidity was found to differ, as an increase in humidity corresponded to a more stable coefficient of friction and lower wear rate. This is related to the formation of ZnO on the surface of the wear track which acts as a lubricating layer when humidity is present.
1. Introduction
Zn–Ni coatings were developed for the automotive industry in the 1980's for corrosion protection of steel coatings as a replacement for Zn coatings due to their superior corrosion properties to Zn and other Zn alloys.1 In the past decade, the aerospace industry has developed an interest in these coatings for sacrificial corrosion protection of steel. This is because cadmium (the sacrificial corrosion protective coatings for steel used in the industry) is carcinogenic and toxic, and some cadmium plating baths contain cyanide.2–5 As these coatings are mainly used for corrosion purposes, their corrosion properties are extensively studied, such as those found in ref. 1, 4, 6–12. It was found that cubic γ-ZnNi coatings have the highest corrosion resistance compared to other phases of intermetallic zinc–nickel coatings.7 Although Zn–Ni is coveted mostly as a replacement coating for cadmium, Zn–Ni is a harder coating than cadmium coatings. This makes Zn–Ni coatings desirable for applications where tribological properties are also important. Few studies are found in the open literature regarding the tribological properties of Zn–Ni. Panagopoulos et al.13 studied the effects of normal load on the coefficient of friction (CoF), and Ghaziof and Gao14 studied the effects of morphology on the effects on their tribological properties. Interest in their tribological properties with comparison to cadmium can be seen in recent publications, such as work done by Sriraman et al., where they compared the tribological and tribocorrosion properties between Zn-14 wt%–Ni alloy coatings with cadmium and Cd–Ti coatings.3,9 They found Zn-14 wt%–Ni to be more wear resistant than cadmium and Cd–Ti in dry sliding wear.3 Also, Zn-14 wt%–Ni performed better than cadmium and Cd–Ti when submersed in 3.5% NaCl due to nickel surface enrichment in the coatings.9 Differences between the tribological behaviour of Zn–Ni and cadmium opens up a potential for these coatings in purposes other than corrosion protection, such as wear resistant coatings. Tribological properties of this coating are not well represented in the open literature, and thus studies of Zn–Ni coatings in this area is needed.Humidity is an important aspect of a tribosystem which greatly affects its friction and wear behaviour, especially in unlubricated conditions. It is well known in metals tribology, the contamination film, which is composed of adsorbed gas particles and/or oxide layer, greatly influence the tribological behaviour of a system.15 Lancaster16 reviewed the effects of humidity on metallic, polymer, lamellar solid lubricants, carbon and graphite, and ceramic systems, and divided the effect of humidity into 3 categories: (1) crack propagation, where water vapour or liquid water interacts with the crack tip to accelerate crack propagation; (2) surface reactions, where water vapour or liquid water reacts with the surface to either form protective oxides or reacted layers that are easy to remove; and (3) modification of the third body layer of aggregated wear debris, where liquid water prevents agglomeration of wear particles or disrupts the already agglomerated wear particles or water vapour modifies the properties of agglomerated wear particles. The last effect refers to third bodies that are developed through physical, chemical and/or microstructural changes during the sliding process and have different properties from the parent materials.17,18 Development of third bodies modifies the contact and influences the tribological properties.19,20 Studies of a steel on steel system showed an increase in humidity resulted in a decrease in CoF and total wear observed,21 while with (Ti,Al)N coatings, abrasive alumina formed and increasing the humidity lowered the abrasiveness of the alumina by forming hydrated oxides.22 Studies on the effect of cycling of the environment between dry nitrogen and humid air was made on YSZ/Au/MoS2 coatings showed a strong dependence on the environment as an increased CoF is observed during the humid air cycles, which reverted back to a lower CoF during the dry nitrogen cycles.23 Further in situ studies were made on Pb–Mo–S coating systems, where MoS2 is known to be sensitive to the environment.24 In situ studies shows humidity changed the morphology of the transfer film, resulting in different velocity accommodation methods and CoF.24
Studies of Zn–Ni alloy coatings are few in the open literature and does not provide a complete picture of the tribological behaviour of Zn–Ni alloy coatings. There exists extensive tribological studies of Zn and Ni in the open literature. However, Zn-14 wt%–Ni alloy is an intermetallic phase and exhibit different mechanical and tribological properties from its parent metals. It is therefore important to conduct further studies in this coating system in terms of tribology. The purpose of this study is to fill in this knowledge gap by exploring the tribological properties of Zn–Ni alloy coatings coupled with a steel (AISI 440C) counterface using a reciprocating tribometer. Change in contact conditions will be made in terms of change in relative humidity. Wear tracks and transfer film material will be studied through ex situ methods.
2. Methods
2.1 Coating process
Zinc nickel alloy was electrodeposited onto a 100 × 160 × 0.8 mm3 low carbon steel (SAE 1006) plate through a commercially available pilot plating bath. The plating solution is an alkaline NaOH (120–135 g L−1) based solution and contains zinc (7–10 g L−1) and nickel (1–1.8 g L−1). The plating operation was performed at 21–25 °C with a current density of 1–3 A dm−2. The as-plated samples were then passivated using a blue trivalent chrome passivate and then baked at 200 °C for 24 hours. Electron probe micro-analyzer (EPMA) test was performed on the coating in order to determine the percentage of nickel in the coating, and the sample was composed of 14.63 wt% ± 0.05 Ni and 84.83 ± 0.21 wt% Zn.2.2 Characterization
Characterization using scanning electron microscopy (SEM) and energy dispersive spectrometry (EDS) was performed on the unworn coating surface, wear track and transfer film. Surface and cross sectional morphology of the coating and the wear tracks were observed using a Philips XL30 field emission SEM at 20 kV accelerating voltage. Composition of the coatings pre-wear test and post-wear test was performed using EDS. Raman spectroscopy was also used in order to determine oxide phases on the tribofilm. Raman spectroscopy was performed with a Renishaw System InVia Raman microscope, with a low power argon-ion laser excitation (2.5 mW, 514.5 nm). Subsurface morphologies of the wear tracks were observed through a Technai G2 F20 Cryo-STEM. TEM specimens were made with focus ion beam (FIB) lift-out performed using Helios Nanolab DualBeam microscope.2.3 Wear tests
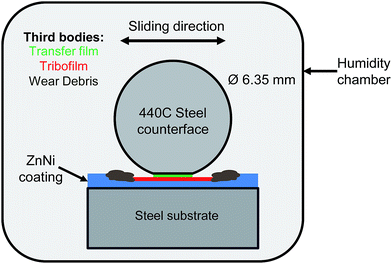
Wear tests were performed using a reciprocating pin-on-flat tribometer using 6.35 mm diameter AISI 440C steel counterfaces (Fig. 1). A normal load of 3.5 N, which correspond to an initial Hertzian contact stress (IHCS) of 750 MPa (using an EZnNi = 118 GPa and νZnNi = 0.23 (ref. 25 and 26)), was used to evaluate the tribological properties of the coatings under relative humidity conditions of 60, 40, 20 and 0% at ambient temperatures of 20–25 °C. The relative humidity levels were controlled through the flow of wet and dry air into the chamber enclosing the tribometer. A sliding speed of 14 mm s−1 was used.Stripe tests were performed on the coating. In these stripe tests, an initial track length of 20 mm is decreased by 2 mm at cycles 10, 75, 200, 500, 850 and 2000 while maintaining a constant sliding speed of 14 mm s−1, amounting to a total sliding distance of 46.54 m.
Wear rates were obtained by scanning the resulting wear scars with a white light profilometer (Wyko NT8000). Wear volume of the wear tracks were calculated based on the average wear area of 10 cross sections, multiplied by the wear track length. The wear rate was then calculated using the Archard and Hirst equation27 shown in eqn (1).
 | (1) |
3. Results
3.1 Characterization
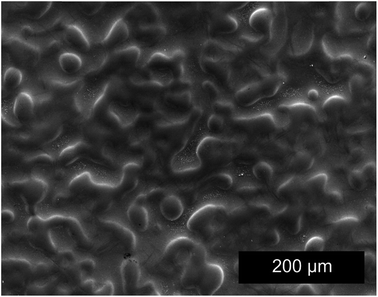
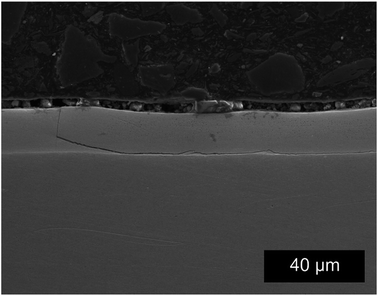
Initial characterization of the coating was performed using SEM and XRD. The electrodeposited coating is composed of fine globular platelets less than 0.5 μm in diameter and forms a smooth and slightly wavy surface (Fig. 2). Through thickness cracks (see Fig. 3) are present on the coating, which are induced by the baking step.28 Cracks are induced to the coatings during the baking step to allow the escape of hydrogen introduced through the electrodeposition process.29,30 The coating thickness was measured on the cross sections of the SE images and was found to be around 13 ± 1 μm. The average roughness of the coating is 1.35 ± 0.19 μm, which was previously reported in ref. 28.XRD was performed on the as-received coatings in the standard θ–2θ mode with a Co-Kα source. Diffraction pattern obtained previously28 shows peaks corresponding to the γ-ZnNi phase, which is an intermetallic phase of zinc and nickel found in the range of 12–15 wt% nickel Zn–Ni alloys. Cubic γ-ZnNi coatings was found to have the highest corrosion resistance compared to other phases of intermetallic zinc–nickel coatings.7
3.2 Wear test
The evolution of the CoF with the number of cycles is shown in Fig. 4a. Histograms, which plots the distribution of the CoF in steady state regime, is shown in Fig. 4b. The steady state regime is defined based on tests performed at RH 60% and 0%, where the curves flatten out. At RH 60%, the CoF increases to 0.8 before stabilizing to 0.5. At RH 40%, the CoF increases to 0.8 and oscillates between 0.6 and 0.7 in the steady state regime. At RH 20%, the CoF increases to 0.7 before stabilizing at around 0.6. At RH 0%, the CoF increases to 0.6 and then stabilizes to 0.5. Both CoF of tests performed in RH 20 and 0% fluctuates at a high frequency in the steady state regime.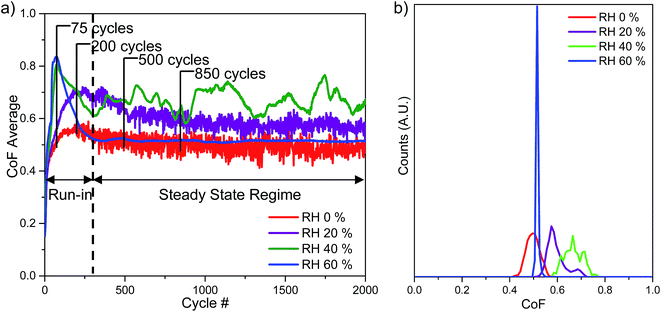 | ||
| Fig. 4 (a) CoF evolution and (b) histogram of steady state region of tests performed at RH 60, 40, 20 and 0%. | ||
The SEM micrographs of the wear tracks at 75, 200, 850 and 2000 cycles and transfer films after 2000 cycles of wear at different relative humidity levels are shown in Fig. 5. With tests performed in RH 60%, after 75 cycles of wear, indicative of the peak CoF observed in the run-in period, asperities of the coatings are flattened through deformation and materials removal. Coating material is transferred to the counterface and dispersed in the recess of the coating as particulates. After 200 cycles of wear, indicative of the end of the run-in period, widening of the asperities are observed. After 850 cycles, indicative of the middle of the steady state period, a distinct wear track is formed, and it appears similar to the wear track after 2000 cycles of wear. For tests performed in RH 60%, the initial increase of the CoF appears to be the result of flattening of the asperities. When a steady state is reached, further wear observed is small.
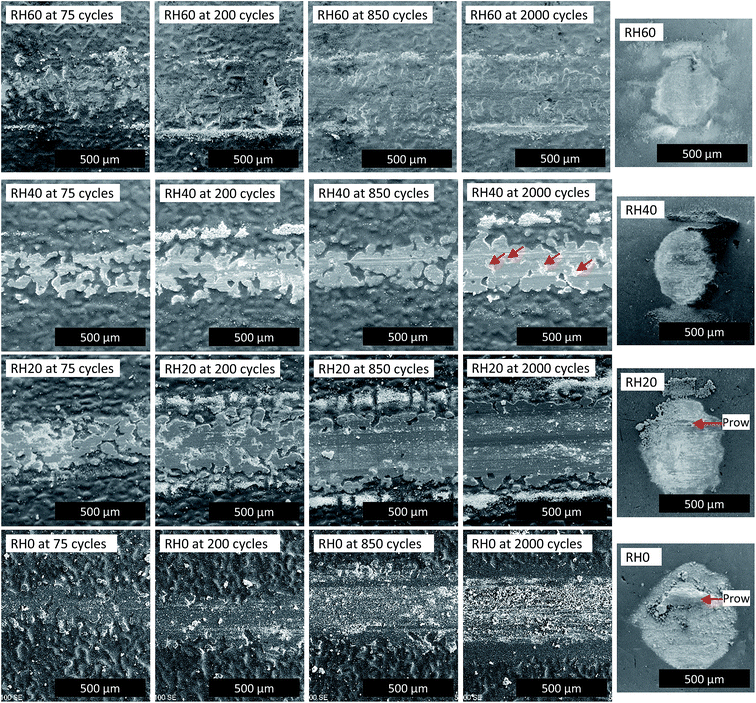 | ||
| Fig. 5 Morphologies of wear track at cycles 75, 200, 850 and 2000 (left) and transfer film after 2000 cycles of wear (right) for RH 60, 40, 20 and 0%. Sliding direction ↔. | ||
With tests performed in RH 40% (Fig. 5), after 75 cycles, flattening of asperities are again observed, which were slightly more severe than RH 60%. After 200 cycles, a defined wear track is observed. After 850 cycles of wear, a score line is observed on the wear track. After 2000 cycles of wear, widening of the wear track is observed, along with the score line observed after 850 cycles. Also, material chip off (indicated by arrows in Fig. 5) is observed within the wear track after 2000 cycles. Fluctuations observed in the CoF during the steady state regime may be due to the score line and material chip off observed.
With tests performed in RH 20% (Fig. 5), after 75 cycles of wear, flattening of asperities is observed, however wear at this point is more severe than the higher humidity tests, as can be seen with the wider flattened asperities. After 200 cycles of wear, widening of the wear track is observed and a well-defined wear track is observed, although unworn areas are still observed due to the roughness of the coating. After 850 cycles of wear, the wear track is widened and wear has occurred past the roughness of the coating. Particles and a score line is also observed in the wear track. After 2000 cycles of wear, the wear track is widened. For wear tracks observed in RH 20%, the formation of a defined wear track is much quicker than the tests performed at higher humidity levels, which may account for the lack of a peak of the CoF during the run-in period. The score line and particulates within the wear track may have contributed to the high frequency fluctuations of the CoF during the steady state period.
Wear tracks obtained from RH 0% (Fig. 5) have the most severe wear out of the 4 humidity levels tested. After 75 cycles of wear, the beginnings of a well-defined wear track is already observed. After 200 cycles of wear, wear has already gone past the roughness of the coating, as unworn coating is not observed within the wear track. After 850 cycles of wear, the wear track is widened and there is a score line present within the wear track. A lot of wear particles is present within the wear track and there appears to be abrasive wear. After 2000 cycles of wear, the wear track is widened and more particulates are observed within the wear track. Abrasive wear is also observed and the score line appears to have widened and deepened. EDS also shows a strong iron peak, which is not observed in lower cycle wear tracks and higher humidity levels, indicating that the coating has been worn through.
The transfer films were also observed and are shown in Fig. 5. Profilometry data is shown in Table 1. As the humidity decreases, there is a thickening and widening of the transfer film. Counterface (CF) wear was also observed. The volume of wear is higher for humidity condition RH 20%, than for humidity conditions RH 40 and 60%, where we see a lower wear volume. Correspondingly, the height of the spherical cap increases from 1 to 3 μm with decreasing humidity. Prow formation is also observed in tests performed in RH 0% from the micrographs (Fig. 5) and a prow thickness of around 37 μm was measured. Substantial amount of material is also transferred to the counterface for tests performed in RH 0% as can be seen from the prow formation, which suggests an adhesive nature in wear at this humidity condition.
| Wear volume (mm3) | Transfer film volume (mm3) | Wear rate after 2000 cycles (mm3 N−1 m−1) | |
|---|---|---|---|
| RH0 | — | 145.72 × 10⁻⁵ | — |
| RH20 | 12.33 × 10⁻⁵ | — | 0.075 |
| RH40 | 4.37 × 10⁻⁵ | — | 0.027 |
| RH60 | 1.92 × 10⁻⁵ | — | 0.012 |
EDX maps of the oxygen present in the wear track area are shown in Fig. 6. At 60% relative humidity, the surface of the wear track has a high oxygen peak with exception of areas where the coating has not been worn due to the irregularity of the coating morphology. In contrast, the map for the wear track ran in RH 20%, oxygen is mostly absent from the surface of the wear track and concentrated on the debris at the sides of the wear track and on the particles present within the wear track.
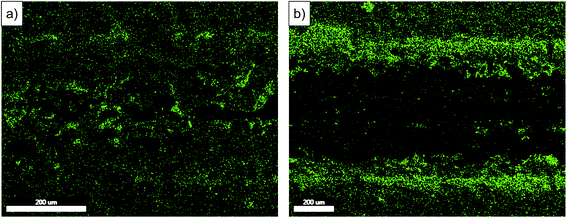 | ||
| Fig. 6 EDX map of oxygen peak at wear tracks after 2000 cycles of tests performed at (a) RH 60% and (b) RH 20%. Sliding direction ↔. | ||
3.3 Wear rate
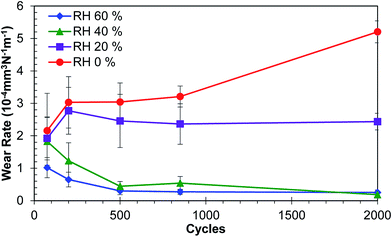
The wear rate is shown in Fig. 7. Initial cycles of the tests show similar wear rates for 0, 20 and 40% RH levels, and 60% RH shows a lower wear rate. As the test progressed, the wear rates of tests performed at RH 60 and 40% decreased and stabilized. In comparison, the wear rates of tests performed at RH 20 and 0% increased and are higher than the other humidity levels. This may be due to adhesive wear as evidence by prow formation (Fig. 5) and subsequent ploughing or cutting of the coating by the prow. Wear rates for tests at RH 0% increased after 850 cycles while tests at RH 20% stayed constant, which may be due to more severe adhesive wear for tests performed at RH 0% due to lack of water vapour in the environment. This led to a larger prow formation and more severe ploughing of the coating, thus removing the coating material from the wear track where the prow is in contact.3.4 Raman spectroscopy
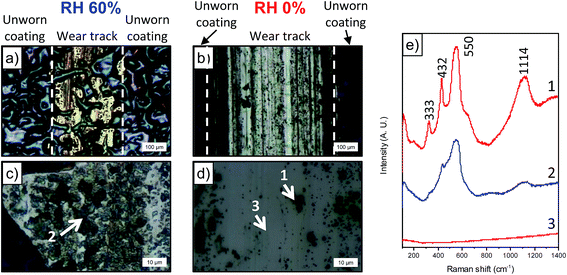
In order to look at the chemical changes on the wear track obtained at different humidity levels, Raman was performed on the wear tracks from RH 60 and 0%. Optical images of the wear track and location where Raman was performed are shown in Fig. 8a–d. From the optical images shown in Fig. 8c and d, the wear track from RH 0% is clean with dark particles scattered throughout the track, whereas the wear track from RH 60%, dark compact film throughout the surface of the wear track is observed. Raman on the dark particles and compact film (Fig. 8e) observed in both conditions reveals peaks corresponding to ZnO.31 Although both conditions shows ZnO, the distribution of ZnO is different in both cases. ZnO in RH 60% is more adherent to the wear track and forms a continuous film on the surface (Fig. 8c), and the peaks corresponding to ZnO are broader. Two spectrums are taken from tracks obtained from RH 0% (Fig. 8e). One was obtained on the cleaner area, where no peaks were observed. The other was obtained on the dark particles scattered throughout the wear tracks, which again showed peaks corresponding to ZnO (Fig. 8d and e). The peaks were sharper than that observed from RH 60%. Differences in the peaks in the spectrums could be due to grain size or orientation of the grains.32,33 Raman mapping was performed on the wear tracks through mapping the 550 cm−1 peak. The maps showed the presence of ZnO on the dark particles and the absence in the wear tracks for those obtained from RH 0% (Fig. 9). In contrast, for wear tracks obtained in RH 60% (Fig. 10), presence of the peak was observed throughout the wear track, indicating the dark compact film observed throughout the wear track is ZnO.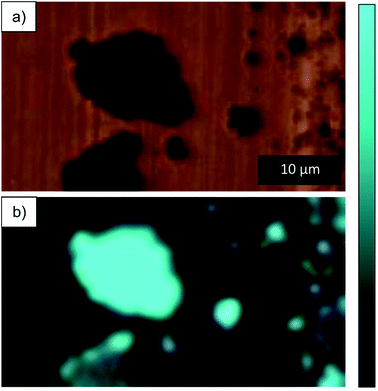 | ||
| Fig. 9 (a) Optical image of dark particle and (b) Raman map of intensity between 490–600 cm−1 for dark particle on wear track obtained at RH 0%. | ||
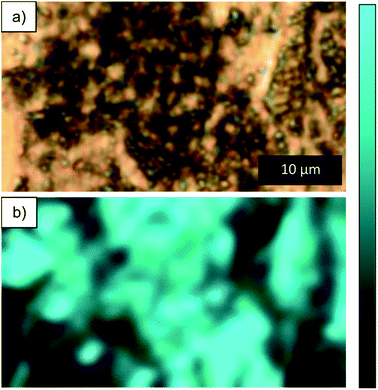 | ||
| Fig. 10 (a) Optical image of dark particle and (b) Raman map of intensity between 490–600 cm−1 for compact film on wear track obtained at RH 60%. | ||
3.5 Transmission electron microscopy: selective area electron diffraction
In order to see additional details on the near surface tribofilms, TEM observation and selective area electron diffraction (SAED) was performed on a cross sectional thin foil on the surface of the wear track (Fig. 11). TEM images revealed a thin nanocrystalline layer on the surface of the wear track obtained in 60% RH with a grain size of around 10 nm (Fig. 12a). The nanocrystalline layer was not observed on the wear track obtained at 0% RH (Fig. 13a). Upon closer investigation (Fig. 12c), a nanometer scale layer of mechanically transformed material is present at the subsurface of the wear track (Fig. 13c), which is not found on the subsurface of the wear track obtained at 60% RH. Dark field images (Fig. 13b) also show deformation of the grains into the subsurface of the wear track, which is also not observed in wear tracks obtained at 60% humidity (Fig. 12b). SAED was performed on the different features on the wear track cross section and compared with the SAED of the unworn samples. Due to the small thickness of the nanocrystalline phase, the area of SAED included some of the larger grain size phase. In order to differentiate the two phases, the rings from the pattern were taken as the nanocrystalline phase. Table 2 compares the d-spacing with standard PDF card of hexagonal structured ZnO, which matched well to the d-spacing of the rings, indicating the presence of ZnO in the nanocrystalline layer. | ||
| Fig. 12 TEM images of wear track surface cross section (a) bright field, (b) dark field and (c) magnified image of the nanocrystalline layer obtained in RH 60% environment. | ||
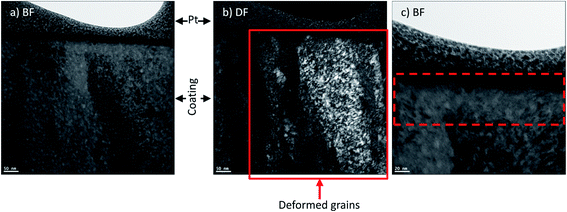 | ||
| Fig. 13 TEM image of wear track surface cross section obtained in RH 0% environment (a) bright field, (b) dark field and (c) tribologically transformed layer at subsurface of wear track. | ||
| Measured from rings d (Å) | PDF card reference d (Å) | Indices |
|---|---|---|
| 2.822 | 2.810 | 10![[1 with combining macron]](https://www.rsc.org/images/entities/char_0031_0304.gif) 0 0 |
| — | 2.610 | 0002 |
| 2.488 | 2.474 | 10![[1 with combining macron]](https://www.rsc.org/images/entities/char_0031_0304.gif) 1 1 |
| 1.919 | 1.912 | 10![[1 with combining macron]](https://www.rsc.org/images/entities/char_0031_0304.gif) 2 2 |
| 1.635 | 1.623 | 11![[2 with combining macron]](https://www.rsc.org/images/entities/char_0032_0304.gif) 0 0 |
| 1.481 | 1.479 | 10![[1 with combining macron]](https://www.rsc.org/images/entities/char_0031_0304.gif) 3 3 |
| — | 1.405 | 20![[2 with combining macron]](https://www.rsc.org/images/entities/char_0032_0304.gif) 0 0 |
| 1.368 | 1.378 | 11![[2 with combining macron]](https://www.rsc.org/images/entities/char_0032_0304.gif) 2 2 |
| — | 1.357 | 20![[2 with combining macron]](https://www.rsc.org/images/entities/char_0032_0304.gif) 1 1 |
4. Discussion
Humidity has a significant effect on the sliding wear behaviour of Zn–Ni alloy coatings. Coatings tested in higher humidity levels showed a high CoF during the run-in period which is due to flattening asperities and formation of third bodies (Fig. 4a and 5), whereas coatings tested at lower humidity levels does not see this trend. A stable and low CoF is observed in the steady state regime for tests ran in high humidity, whereas the CoF becomes less steady as the humidity decreases. From Fig. 4a, the average steady state CoF is summarized in Table 3. When the relative humidity decreases from 60 to 40%, there is an increase in the steady state CoF. However, as the relative humidity decreases from 20 to 0%, the steady state CoF also decreases. An increase of adhesive wear is observed when the relative humidity is decreased from 60 to 40%. This is probably due to reduced formation of nanocrystalline ZnO layer, as evidence by the slight coating pull-out in the wear track at RH 40%. When the relative humidity is decreased from 20 to 0%, the decrease of the steady state CoF is due to the change in velocity accommodation mechanism. When the relative humidity is decreased to 0%, an increased amount of wear particles is observed within the wear track as well as formation of a prow. This can aid in accommodating the velocity difference between the first bodies.20 In addition, as the humidity of the test decreases, the wear increases. These differences are due to differences in the wear and velocity accommodation mechanisms at different humidity levels.| Relative humidity (%) | Steady state CoF |
|---|---|
| 60 | 0.52 ± 0.01 |
| 40 | 0.67 ± 0.04 |
| 20 | 0.60 ± 0.04 |
| 0 | 0.50 ± 0.03 |
ZnO was detected in the wear track in tests performed both in RH 60% and 0%. ZnO has been reported to reduce the CoF and wear rate when it is present in a thin nanocrystalline or amorphous form.33–35 Although ZnO was detected in both conditions, lowered and stable CoF and wear rate was observed in RH 60%, whereas an unstable CoF and high wear rate is observed in RH 0% in the steady state regime. In both high and low humidity cases, ZnO is observed in the Raman spectra (see Fig. 8e). The difference of the ZnO in both wear tracks is in its formation which is reflected upon the morphology of the ZnO. At RH 0%, the oxides are in the form of agglomerated particles and very dispersed in wear track. In contrast, at RH 60%, compacted nanocrystalline oxide film layer was found on the tribolayer throughout the wear track. Therefore, the thin layer of ZnO present in the wear track contributed to a low and stable CoF and low wear rate observed in RH 60% due to shear occurring in the nanocrystalline layer (Fig. 14). In contrast, at RH 0%, an unstable CoF and high wear rate is observed due to a lack of an adherent nanocrystalline ZnO film layer and subsequently interfacial sliding between the prow and wear track (Fig. 15). The higher relative humidity facilitates ZnO nanocrystalline film formation, while the absence of humidity prevents a fast enough formation of ZnO nanocrystalline film. Corrosion of zinc and its alloys is well understood and documented. It is noted in atmospheric corrosion, especially in purified air, the conditions for surface condensation and atmospheric corrosion are affected by the humidity.36–38 For zinc, it has been shown that atmospheric corrosion occurs when the relative humidity is above 60%, whereas below 60% RH, little corrosion occurs.37,39 In the presence of water, zinc transforms into zinc hydroxide, and then into zinc oxide in the presence of air due to dehydration, shown in eqn (2) and (3).38 The different relative humidity levels of the tests result in different atmospheric corrosion conditions, which may explain the chemical and structural differences in third bodies.
| Zn2+ + 2OH− → Zn(OH)2 | (2) |
| Zn(OH)2 → ZnO + H2O | (3) |
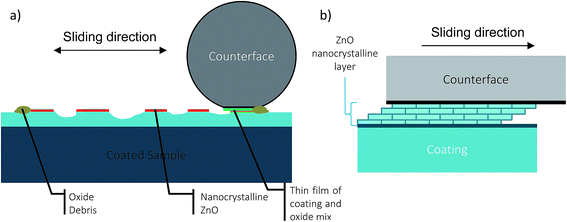 | ||
| Fig. 14 Schematic diagram of wear behaviour during steady state at high humidity levels (a) wear track during test and (b) shearing of nanocrystalline ZnO film. | ||
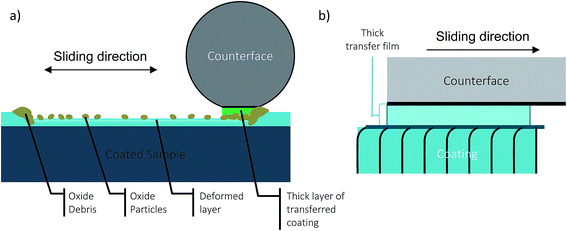 | ||
| Fig. 15 Schematic diagram of wear behaviour during steady state at low humidity levels (a) wear track during test and (b) transfer material and coating interface sliding. | ||
SEM (see Fig. 5) shows major differences among the wear track morphologies after 2000 cycles of wear. At RH 60%, the low amount of wear may be related to the formation of a lubricating ZnO layer. At RH 40%, slightly more wear occurs in the wear track indicated by the wear rate and SEM image where slight material pull-out is observed in the wear track, which may contribute to the higher and irregular CoF. At RH 20%, the wear rate transitions from a decreasing to an increasing trend. This is due to the severe wear observed in the SEM images. Slight prow formation is observed on the transfer film and wear track which is indicative of adhesive wear. Sliding occurring between the prow/wear track interface and wear particles in the center of the wear track may contribute to an unstable yet lower CoF. At RH 0%, the large prow formation and substantial amount of wear debris in the center of the wear track may also contribute to the low but unstable CoF. Increasing adhesion of coating material to the counterface is observed with decreasing humidity in the form of prow formation due to a lack of water vapour in the environment to aid in the formation of the nanocrystalline ZnO layer. This also contributes to the higher wear rate observed due to ploughing of the coating by the prow. Grains on the near surface of the wear track is also deformed, indicating the velocity accommodated through deformation of the coating at low humidity levels.
5. Conclusion
A Zn–Ni coating was tested in various humidity levels in order to test the effect of humidity on the sliding wear properties of the coating. Wear rates of high humidity tests are much lower than low humidity tests due to different wear and velocity accommodation mechanisms. High humidity tests form a compacted film of nanocrystalline hexagonal ZnO on the tribolayer which is lubricious, resulting in a steady CoF and low wear rate. In contrast, at low humidity tests, ZnO particles were disperse and scattered in the wear track. Prow formation occurred for tests conducted at low humidity, which contributed to a high wear rate due to ploughing of the coating.Acknowledgements
The authors thank Salim Brahimi for his continual support and inputs throughout the experiments. We also thank Natural Science and Engineering Research Council (NSERC), Boeing Canada, Pratt & Whitney Canada, Héroux Devtek, Canadian Fastener Institute and Messier-Bugatti-Dowty for their financial support. We thank Boeing, Coventya and Dipsol Inc. for providing specimens.References
- G. D. Wilcox and D. R. Gabe, Corros. Sci., 1993, 35, 1251–1258 CrossRef CAS.
- British Defence Standards, DEF STAN 03-36 Guidance to the Use of Cadmium Alternatives in the Protective Coating of Defence Equipment, Glasgow, Crown, UK, 2010 Search PubMed.
- K. R. Sriraman, H. W. Strauss, S. Brahimi, R. R. Chromik, J. A. Szpunar, J. H. Osborne and S. Yue, Tribol. Int., 2012, 56, 107–120 CrossRef CAS.
- M. Bielawski, Can. Aeronaut. Space J., 2010, 56, 67–80 CrossRef.
- K. Legg, Cadmium Replacement Options, Rowan Technology Group, 2003, http://www.rowantechnology.com/wp-content/uploads/2012/06/Cadmium-replacement-options1.pdf Search PubMed.
- K. R. Sriraman, S. Brahimi, J. A. Szpunar, J. H. Osborne and S. Yue, Electrochim. Acta, 2013, 105, 314–323 CrossRef CAS.
- T. V. Byk, T. V. Gaevskaya and L. S. Tsybulskaya, Surf. Coat. Technol., 2008, 202, 5817–5823 CrossRef CAS.
- K. R. Baldwin and C. J. E. Smith, Trans. Inst. Met. Finish., 1996, 74, 202–209 CAS.
- K. R. Sriraman, S. Brahimi, J. A. Szpunar, J. H. Osborne and S. Yue, Surf. Coat. Technol., 2013, 224, 126–137 CrossRef CAS.
- J. A. Bates, Plat. Surf. Finish., 1994, 81, 36–40 CAS.
- A. Conde, M. A. Arenas and J. J. de Damborenea, Corros. Sci., 2011, 53, 1489–1497 CrossRef CAS.
- H. Bruet, J. P. Bonino, A. Rousset and M. E. Chauveau, J. Mater. Sci., 1999, 34, 881–886 CrossRef.
- C. N. Panagopoulos, K. G. Georgarakis and P. E. Agathocleous, Tribol. Int., 2003, 36, 619–623 CrossRef CAS.
- S. Ghaziof and W. Gao, Appl. Surf. Sci., 2014, 311, 635–642 CrossRef CAS.
- F. P. Bowden and D. Tabor, The friction and lubrication of solids, Clarendon Press, Oxford, 1954 Search PubMed.
- J. K. Lancaster, Tribol. Int., 1990, 23, 371–389 CrossRef CAS.
- M. Godet, Wear, 1984, 100, 437–452 CrossRef.
- M. Godet, Wear, 1990, 136, 29–45 CrossRef.
- Y. Berthier, in Tribology Series, ed. D. Dowson, C. M. Taylor, T. H. C. Childs, G. Dalmaz, Y. Berthier, L. Flamand, J. M. Georges and A. A. Lubrecht, Elsevier, 1996, vol. 31, pp. 21–30 Search PubMed.
- Y. Berthier, L. Vincent and M. Godet, Wear, 1988, 125, 25–38 CrossRef.
- D. Klaffke, Wear, 1995, 189, 117–121 CrossRef CAS.
- M. Z. Huq and J. P. Celis, Wear, 1999, 225–229(1), 53–64 CrossRef CAS.
- C. C. Baker, R. R. Chromik, K. J. Wahl, J. J. Hu and A. A. Voevodin, Thin Solid Films, 2007, 515, 6737–6743 CrossRef CAS.
- S. D. Dvorak, K. J. Wahl and I. L. Singer, Tribol. Lett., 2007, 28, 263–274 CrossRef CAS.
- C. S. Lin, H. B. Lee and S. H. Hsieh, Metall. Mater. Trans. A, 2000, 31, 475–485 CrossRef.
- T. Sasaki and Y. Hirose, Thin Solid Films, 1994, 253, 356–361 CrossRef CAS.
- J. F. Archard and W. Hirst, Proc. Roy. Soc. Lond. Math. Phys. Sci., 1956, 236, 397–410 CrossRef.
- L. Lee, É. Régis, S. Descartes and R. R. Chromik, Wear, 2015, 330–331, 112–121 CrossRef CAS.
- ASTM International, F519 – 10, Standard Test Method for Mechanical Hydrogen Embrittlement Evaluation of Plating/Coating Processes and Service Environments, ASTM International, Pennsylvania, USA, 2011 Search PubMed.
- K. R. Sriraman, S. Brahimi, J. A. Szpunar and S. Yue, J. Appl. Electrochem., 2013, 1–11 Search PubMed.
- T. C. Damen, S. P. S. Porto and B. Tell, Phys. Rev., 1966, 142, 570–574 CrossRef CAS.
- K. R. Sriraman, P. Manimunda, R. R. Chromik and S. Yue, RSC Adv., 2016, 6, 17360–17372 RSC.
- J. S. Zabinski, J. Corneille, S. V. Prasad, N. T. McDevitt and J. B. Bultman, J. Mater. Sci., 1997, 32, 5313–5319 CrossRef CAS.
- S. V. Prasad and J. S. Zabinski, Wear, 1997, 203–204, 498–506 CrossRef CAS.
- J. Zhang and J. Zheng, Tribol. Lett., 2013, 49, 77–83 CrossRef CAS.
- F. C. Porter, in Corrosion resistance of zinc and zinc alloys, CRC Press, 1994, ch. 2 Search PubMed.
- W. H. J. Vernon, Trans. Faraday Soc., 1935, 31, 1668–1700 RSC.
- X. G. Zhang, in Corrosion and electrochemistry of zinc, Springer, US, 1996, ch. 8, pp. 241–281 Search PubMed.
- K. Suzumura and S. I. Nakamura, J. Mater. Civ. Eng., 2004, 16, 1–7 CrossRef CAS.
| This journal is © The Royal Society of Chemistry 2017 |

