DOI:
10.1039/C7RA03067C
(Paper)
RSC Adv., 2017,
7, 34382-34391
Remarkable dielectric properties of 1![[thin space (1/6-em)]](https://www.rsc.org/images/entities/h2_char_2009.gif) :
:![[thin space (1/6-em)]](https://www.rsc.org/images/entities/h2_char_2009.gif) 2 inter-molecular compound of 2-(4-(dimethylamino) benzylideneamino) benzoic acid and urea due to excited-state intramolecular proton transfer†
2 inter-molecular compound of 2-(4-(dimethylamino) benzylideneamino) benzoic acid and urea due to excited-state intramolecular proton transfer†
Received
15th March 2017
, Accepted 20th June 2017
First published on 7th July 2017
Abstract
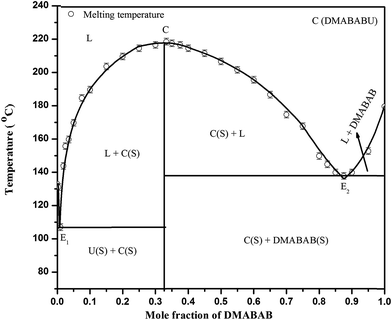
The phase diagram of 2-(4-(dimethylamino) benzylideneamino) benzoic acid (DMABAB)–urea (U) gives two eutectics E1 (mp 107.0 °C) and E2 (mp 138.0 °C) with 0.01 and 0.86 mole fractions of urea, respectively, and a 1![[thin space (1/6-em)]](https://www.rsc.org/images/entities/char_2009.gif) :
:![[thin space (1/6-em)]](https://www.rsc.org/images/entities/char_2009.gif) 2 inter-molecular compound (IMC) with a congruent melting point of 219.0 °C, which has a high dielectric constant (ε = 0.9 × 10³) and reasonable electrical conductivity in the order ∼5 × 10⁻⁶ S m−1. This is due to the remarkable packing of U molecules in the IMC, where it shows coupling of two different types of cyclic hydrogen-bonded motifs alternating to form a corrugated sheet or chain of rings extending along the b axis via N–H⋯O hydrogen bonding interactions. In the presence of an electric field, an inter-molecular proton transfer process occurs in the NH⋯O bonds of the chain of the U molecules, which leads to disproportionate defects and the formation of polar domains on the macroscopic scale. An appropriate quantity of the IMC is synthesized via a green synthetic method, which has a monoclinic crystal system with the P21/c centrosymmetric space group. Additionally, its crystal data and hydrogen bonding parameters are determined. According to powder X-ray diffraction, spectral and thermal characterization, the eutectics are a mechanical mixture of the IMC and pure components, although the IMC behaves as a pure compound. The IMC shows a broad emission band in the range of 350 to 580 nm with a quantum yield of almost 1 (0.99) upon excitation at the λmax absorption (300 nm) in MeOH solution at a concentration of 1 × 10⁻⁵ M.
2 inter-molecular compound (IMC) with a congruent melting point of 219.0 °C, which has a high dielectric constant (ε = 0.9 × 10³) and reasonable electrical conductivity in the order ∼5 × 10⁻⁶ S m−1. This is due to the remarkable packing of U molecules in the IMC, where it shows coupling of two different types of cyclic hydrogen-bonded motifs alternating to form a corrugated sheet or chain of rings extending along the b axis via N–H⋯O hydrogen bonding interactions. In the presence of an electric field, an inter-molecular proton transfer process occurs in the NH⋯O bonds of the chain of the U molecules, which leads to disproportionate defects and the formation of polar domains on the macroscopic scale. An appropriate quantity of the IMC is synthesized via a green synthetic method, which has a monoclinic crystal system with the P21/c centrosymmetric space group. Additionally, its crystal data and hydrogen bonding parameters are determined. According to powder X-ray diffraction, spectral and thermal characterization, the eutectics are a mechanical mixture of the IMC and pure components, although the IMC behaves as a pure compound. The IMC shows a broad emission band in the range of 350 to 580 nm with a quantum yield of almost 1 (0.99) upon excitation at the λmax absorption (300 nm) in MeOH solution at a concentration of 1 × 10⁻⁵ M.
1. Introduction
It is well known that inter-molecular compounds (IMCs) are homogeneous multi-component crystalline materials with a well defined stoichiometry. Their formation is based on inter-molecular interactions and molecular crystal patterns and their design inspired by the principles of crystal engineering and supramolecular chemistry.1 Insight into the source of solid state properties can be gained from the knowledge about packing arrangements.2 The exploitation of non-covalent interactions (hydrogen bonding, dipole–dipole interactions, induced dipole interactions, van der Waal interaction, etc.) between molecules coupled with molecular packing patterns can result in many desirable electrical, magnetic, optical and dielectric properties in materials of commercial and technological importance.3 The appearance of synthons, which are used as design units for new materials, is of immense importance for the further control of different properties.4 The wide choice of organic compounds coupled with the attachment of different functional groups result in many new properties, which together with control of the packing arrangement can provide ample opportunities to improve solid state properties.5 Binary organic compounds have been designed with promising properties such as light emitting diodes of different colors including white light, and nonlinear optical, electro-optic and conducting materials.6–8 Studies on binary organic materials have been conducted to produce non-linear optical (NLO) materials and white light emitting diode materials and to modify the limitations of materials used in NLO applications.9–11
Urea is one of the most robust building block molecules, which has the tendency to form hydrogen-bonded chains in variety of environments for crystal engineering. It has a bifunctional hydrogen bond donor and acceptor (–NH2 and O![[double bond, length as m-dash]](https://www.rsc.org/images/entities/char_e001.gif) C) and 2-(4-(dimethylamino) benzylideneamino) benzoic acid (DMABAB) exists as a zwitterion. Therefore, these compounds were selected to study their eutectics and inter-molecular compounds. Their phase diagram is determined and they are characterized via X-ray diffraction and spectroscopically. Furthermore, their electrochemical, dielectric and optical behavior are studied. The arrangement of their molecules in three dimensions is also studied using a single crystal grown in a saturated solution of methanol at room temperature via the slow evaporation technique.
C) and 2-(4-(dimethylamino) benzylideneamino) benzoic acid (DMABAB) exists as a zwitterion. Therefore, these compounds were selected to study their eutectics and inter-molecular compounds. Their phase diagram is determined and they are characterized via X-ray diffraction and spectroscopically. Furthermore, their electrochemical, dielectric and optical behavior are studied. The arrangement of their molecules in three dimensions is also studied using a single crystal grown in a saturated solution of methanol at room temperature via the slow evaporation technique.
2. Experimental
2.1 Materials and their purification
Anthranilic acid (AA) and N,N-(dimethylamino) benzaldehyde (DMAB) (Aldrich, Germany) were purified via repeated crystallization from ethanol (AR). Urea (U) was purchased from Aldrich, Germany and used as received. The purity of the materials was ascertained by determining their melting temperatures which were found to be very close to recent literature values.12 The melting temperatures of AA, DMAB and U were found to be 148.0 °C, 73.0 °C and 133.0 °C, respectively. 2-(4-(Dimethylamino) benzylideneamino) benzoic acid (DMABAB) was synthesized via solvent a free synthetic method involving a thermally heated molten state reaction between DMAB and AA by mixing both in a 1![[thin space (1/6-em)]](https://www.rsc.org/images/entities/char_2009.gif) :
:![[thin space (1/6-em)]](https://www.rsc.org/images/entities/char_2009.gif) 1 molar ratio in a test tube and heating them to their melting points in a silicon oil bath. The mixture was then homogenized by repeating the process of melting followed by chilling in an ice bath 4 times.13 The as formed product was removed from the test tube and ground in a pestle and mortar was and then purified by repeated crystallization from analytical reagent grade methanol. It was then characterized via X-ray diffraction, FTIR, NMR and thermal methods.
1 molar ratio in a test tube and heating them to their melting points in a silicon oil bath. The mixture was then homogenized by repeating the process of melting followed by chilling in an ice bath 4 times.13 The as formed product was removed from the test tube and ground in a pestle and mortar was and then purified by repeated crystallization from analytical reagent grade methanol. It was then characterized via X-ray diffraction, FTIR, NMR and thermal methods.
2.2 Phase diagram
The phase diagram of DMABAB and U was determined using the thaw–melt method14 by taking mixtures of DMABAB and U in the entire compositional range and sealing them in test tubes to avoid the loss of molecules. They were then homogenized by melting followed by cooling in ice cold water 5 times. The melting points of the different mixtures were determined and a graph was plotted between the melting point on the y-axis and mole fraction on the x-axis to obtain the phase diagram of the system.
2.3 Characterization
2.3.1 Spectroscopic characterization. NMR spectra of the pure components and the IMC (DMABAB–U) crystal in CDCl3 solvent were obtained on a JEOL 300 MHz Spectrometer. Infrared spectra were recorded in the range of 4000–400 cm−1 at 300 K using a Perkin Elmer FT-IR Spectrum 1000 infrared spectrometer by dispersing the compounds in KBr pellets.
2.3.2 X-ray diffraction. Powder X-ray diffraction (XRD) patterns for all compounds were recorded using a Pan Analytical diffractometer with Cu Kα (1.5408 Å) radiation in the 2θ range of 10–70° at a scanning rate of 4° min−1. The single crystal of the IMC was grown in a saturated solution of methanol at room temperature via the slow vaporization technique. X-ray diffraction data of the single crystal were collected using an Xcalibur Oxford CCD diffractometer. Data reduction was carried out using the Chrysalis Pro software. The IMC structure was solved by direct methods using SHELXS-97 (ref. 15) and refined with the full-matrix least squares method using SHELXL-2014 (ref. 16) present in the program suite WinGX program suite.17 All non-hydrogen atoms were refined anisotropically, and all hydrogen atoms bound to carbon and oxygen were placed in the calculated positions. The hydrogen atoms bound to nitrogen were located. The packing diagram of the IMC was generated using the Mercury 3.6 software.18
2.3.3 Thermal characterization. The heat of fusion of the IMC crystal was determined19 via differential scanning calorimetry (Mettler DSC-4000 system). Indium and zinc samples were used to calibrate the DSC unit. The amount of test sample and heating rate were about 5 mg and 5 °C min−1, respectively.
2.3.4 Electrochemical characterization. Electrochemical experiments were performed at room temperature (25 °C) on a CHI-660C (CH Instruments, USA) using the three-electrode system with GC (CH Instruments, area = 0.07 cm2) as the working electrode, platinum wire as the counter electrode and Ag/AgCl (saturated with KCl) as the reference electrode. All measurements were carried out in dimethyl sulfoxide (DMSO) with 0.1 M tetrabutylammonium perchlorate (TBAP) as the supporting electrolyte.16 The concentration of the samples was 0.001 M and the potential range was −1.0 V to 1.0 V.
2.3.5 Dielectric characterization. Dielectric constant and dielectric loss measurements were carried out on pellets (dimensions: ≈1.5 mm thickness and 141.04 mm2 area) of the corresponding fine powders obtained via the pressing technique. The capacitance together with the dielectric loss and impedance of the IMC crystal were monitored using a WAYNE KERR 6500 B impedance analyzer as a function of frequency (100 Hz–5 MHz) and temperature (303 K to 293 K). Silver epoxy was used in electroding the samples. The values of dielectric constant and dielectric loss of the IMC crystal were evaluated by taking the dimensions of the samples into account.
2.3.6 Optical characterization. UV-vis spectroscopy was carried out on a UV/vis/NIR (JASCO model V-670) spectrometer by scanning monochromatic light in the range of 190 to 1200 nm. A quartz cuvette with a path length of 1.00 cm was used and the solvent used was MeOH. Fluorescence spectra were recorded on a Varian Cary Eclipse fluorescence spectrophotometer using pyrene as a reference at room temperature.
3. Result and discussion
3.1 Phase diagram
The phase diagram of the DMABAB–U system gave two eutectics E1 (m p 107.0 °C) and E2 (mp 138.0 °C) and a 1![[thin space (1/6-em)]](https://www.rsc.org/images/entities/char_2009.gif) :
:![[thin space (1/6-em)]](https://www.rsc.org/images/entities/char_2009.gif) 2 inter-molecular compound with 0.01, 0.86 and 0.33 mole fraction of DMABAB, respectively. This inter-molecular compound has a congruent melting point (mp 219.0 °C). At this temperature the equilibrium is expressed as
2 inter-molecular compound with 0.01, 0.86 and 0.33 mole fraction of DMABAB, respectively. This inter-molecular compound has a congruent melting point (mp 219.0 °C). At this temperature the equilibrium is expressed as
| DMABAB + U → DMABAB–U (solid) → DMABAB–U (liquid) |
In the liquid state the IMC remains associated since the curve is flat at the top in the phase diagram, which is shown in Fig. 1.
 |
| | Fig. 1 Phase diagram of the DMABAB–U system. | |
3.2 Spectral studies
The infrared spectrum of the IMC is different from that of its components. The peaks observed at 3434, 2922, 1677 and 1587 cm−l in the spectrum of DMABAB are attributed to the O–H, N–H and C![[double bond, length as m-dash]](https://www.rsc.org/images/entities/char_e001.gif) O and imine groups (–C
O and imine groups (–C![[double bond, length as m-dash]](https://www.rsc.org/images/entities/char_e001.gif) N–), respectively. The shift observed in the O–H and C
N–), respectively. The shift observed in the O–H and C![[double bond, length as m-dash]](https://www.rsc.org/images/entities/char_e001.gif) O and imine groups (3183, 1666 and 1591 cm−l, respectively) in the spectrum of the IMC is due to hydrogen bonding. The other peak centered at 1606 cm−l is ascribed to the hydrogen bonded carbonyl group of the U molecules.
O and imine groups (3183, 1666 and 1591 cm−l, respectively) in the spectrum of the IMC is due to hydrogen bonding. The other peak centered at 1606 cm−l is ascribed to the hydrogen bonded carbonyl group of the U molecules.
In the 1H NMR spectrum of DMABAB peaks appear at δ = 3.11 ppm (6H s), 8.52 ppm (1H s), 8.33 ppm (1H d), 7.77 ppm (1H t), 7.55 ppm (1H t), 7.44 ppm (1H d), 7.33 ppm (2H d), 6.77 ppm (2H d) and 9.67 ppm (1H s). The 1H NMR spectrum of IMC show peaks at δ = 12.14 ppm (1H s), 3.00 ppm (6H s), 6.75 ppm (2H d), 7.64 ppm (2H d), 8.11 ppm (1H s), 8.08 ppm (1H d), 7.73 ppm (1H d), 7.78 ppm (1H t), 7.75 ppm (1H t) and 3.36 ppm (8H s).
3.3 Description of the structures
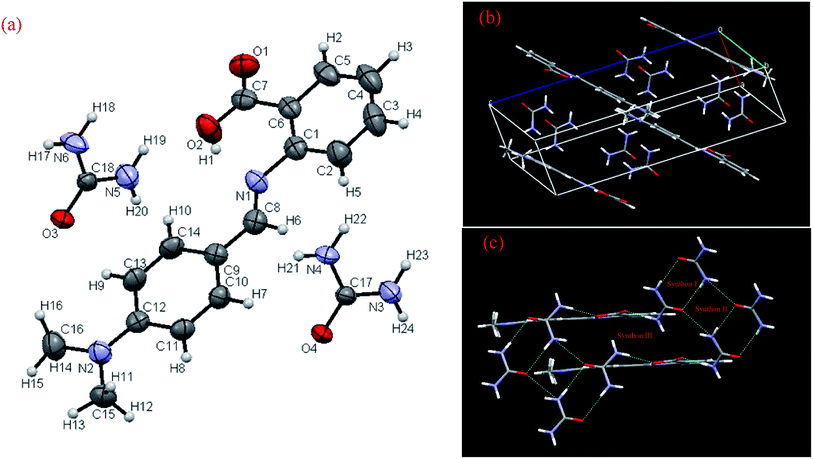
DMABAB and U both contain multiple hydrogen bond donor and acceptor groups. These groups can be used to design an IMC composed of these two molecules. The DMABAB crystallizes in a monoclinic cell having the C2/c space group with lattice parameters a = 18.167(3), b = 13.045(8), c = 15.377(3) and α = γ = 90.00, β = 129.65 (CCDC no. 940623).21 U crystallizes in an orthorhombic unit cell having the P421m space group with lattice parameters a = 5.589(5), b = 5.589(5), c = 4.695(4) and α = β = γ = 90.00 (CCDC no. 131762).22 The crystallographic asymmetric unit of the DMABAB–U IMC consists of one DMABAB molecule and two U molecules in a monoclinic unit cell with the P21/c (CCDC no. 940627) centrosymmetric space group, and ORTEP representation and atomic packing are shown in (Fig. 2(a) and (b), respectively). The crystallographic information for the 1![[thin space (1/6-em)]](https://www.rsc.org/images/entities/char_2009.gif) :
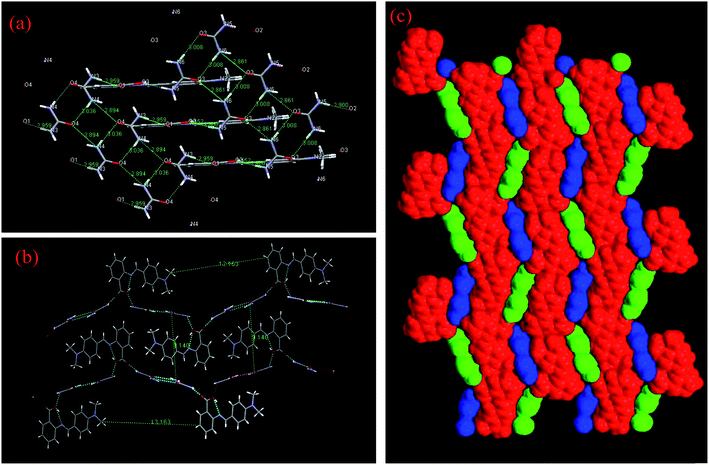
:![[thin space (1/6-em)]](https://www.rsc.org/images/entities/char_2009.gif) 2 inter-molecular compound is presented in Table 1. This molecule shows supramolecular synthonic interactions. The IMC can be described as a supramolecular macrocycle in which two DMABAB and four U molecules are joined by alternate N–H⋯O hydrogen bonding interactions (supramolecular synthon III) (Fig. 2(c)). One of the remarkable features of this structure is the coupling of two different types of cyclic hydrogen-bonded motifs (supramolecular synthon I and II) alternating to form layers along the b axis via N–H⋯O (2.894 Å and 3.008 Å) hydrogen bonding interactions (Fig. 3(a)). These layers lie in the ac plane where they play a central role in the self-assembly process. The motifs are composed of urea molecules alone arranged in the plane of the array, which are described in Fig. 3(a) as supramolecular synthon rings I and II, and can be described as a supramolecular synthon I–II chain similar to the finding of Zvicka Deutsch and Joel Bernstein.23 All the hydrogen bonding possibilities of urea are utilized in the formation of a 2D planar sheet through strong hydrogen bonds, which further stacks one over the other in the third dimension. The crystal structure analysis reveals that the molecules in the crystal structure form alternate parallel layers of DMABAB and U (Fig. 3(b)) and the space filing structure of alternate layers of U and DMABAB molecules with symmetry equivalence of both layers is given in Fig. 3(c). The distance between two U layers is 9.140 Å and in between these two layers one layer of DMABAB chain stays alive. In the DMABAB molecular layer every alternate molecule is bonded with different U molecule layers (Fig. 3(b)). The main bonding parameters are summarized in Table S1 in the ESI† and all the hydrogen bonding parameters are tabulated in Table 2.
2 inter-molecular compound is presented in Table 1. This molecule shows supramolecular synthonic interactions. The IMC can be described as a supramolecular macrocycle in which two DMABAB and four U molecules are joined by alternate N–H⋯O hydrogen bonding interactions (supramolecular synthon III) (Fig. 2(c)). One of the remarkable features of this structure is the coupling of two different types of cyclic hydrogen-bonded motifs (supramolecular synthon I and II) alternating to form layers along the b axis via N–H⋯O (2.894 Å and 3.008 Å) hydrogen bonding interactions (Fig. 3(a)). These layers lie in the ac plane where they play a central role in the self-assembly process. The motifs are composed of urea molecules alone arranged in the plane of the array, which are described in Fig. 3(a) as supramolecular synthon rings I and II, and can be described as a supramolecular synthon I–II chain similar to the finding of Zvicka Deutsch and Joel Bernstein.23 All the hydrogen bonding possibilities of urea are utilized in the formation of a 2D planar sheet through strong hydrogen bonds, which further stacks one over the other in the third dimension. The crystal structure analysis reveals that the molecules in the crystal structure form alternate parallel layers of DMABAB and U (Fig. 3(b)) and the space filing structure of alternate layers of U and DMABAB molecules with symmetry equivalence of both layers is given in Fig. 3(c). The distance between two U layers is 9.140 Å and in between these two layers one layer of DMABAB chain stays alive. In the DMABAB molecular layer every alternate molecule is bonded with different U molecule layers (Fig. 3(b)). The main bonding parameters are summarized in Table S1 in the ESI† and all the hydrogen bonding parameters are tabulated in Table 2.
 |
| | Fig. 2 (a) ORTEP view and numbering scheme, (b) atomic packing and (c) supramolecular synthonic interactions of IMC. | |
Table 1 Crystal data and details of the refinement for the DMABAB–U IMC
| |
DMABAB–U |
| Formula |
C18 H24 N6 O4 |
| Mr |
388.43 |
| CCDC no. |
940627 |
| Crystal system |
Monoclinic |
| Space group |
P21/c |
| a [Å] |
5.1034(11) |
| b [Å] |
18.336(5) |
| c [Å] |
20.348(5) |
| α [°] |
90 |
| β [°] |
95.30(2) |
| γ [°] |
90 |
| V [Å3] |
1896.0(8) |
| Z |
4 |
| Dcalcd [g cm−3] |
1.361 |
| μ (MoKα) [cm−1] |
0.099 |
| F (000) |
824.0 |
| hkl range |
±6, ±24, ±26 |
| T [K] |
293 |
| Reflections measured |
13![[thin space (1/6-em)]](https://www.rsc.org/images/entities/char_2009.gif) 332 332 |
| Reflections unique |
4437 |
| Data with Fo > 4σ(Fo) |
2338 |
| Rint |
0.1019 |
| Parameters refined |
253 |
| R(F) (for Fo > 4σ(Fo)) |
0.0816 |
| wR(F2) (all reflections) |
0.2077 |
| GoF (F2) |
1.030 |
 |
| | Fig. 3 (a) Supramolecular synthon I and II chains of U molecules, (b) layers of DMABAB molecules in the U molecule layers and (c) space filling of both layers. | |
Table 2 Hydrogen bond parameters ([Å] and [°]) in the DMABAB–U IMC
| D–H⋯A |
D–H |
H⋯A |
D⋯A |
<DHA |
| N3–H22⋯O1 |
0.860 |
2.151 |
2.959 |
158.36 |
| N4–H21⋯O4 |
0.861 |
2.206 |
3.036 |
161.46 |
| N4–H22⋯O4 |
0.860 |
2.171 |
2.894 |
141.46 |
| N5–H19⋯O2 |
0.860 |
2.268 |
2.900 |
130.27 |
| O2–H1⋯N1 |
0.819 |
1.790 |
2.552 |
154.03 |
| N6–H18⋯O3 |
0.860 |
2.861 |
2.861 |
138.03 |
| N6–H17⋯O3 |
0.860 |
2.155 |
3.008 |
171.19 |
3.4 Powder XRD analysis
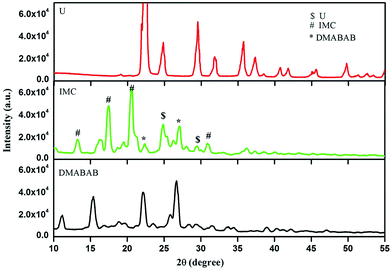
The powder X-ray diffraction patterns of the parent components (DMABAB and U) and IMC are recorded and depicted in Fig. 4. It is evident from the figure that the XRD pattern of IMC is quite different from both components. The X-ray diffraction patterns of IMC shows some new peaks which are not related either of the parent components. Also, the intensity of some of the peaks of the parent compounds shows significant changes. These observations confirm the formation of a new compound. The calculated (from Mercury) and experimental powder X-ray patterns (Fig. S1†) when fitted show some deviations because the calculated powder X-ray pattern is from a single crystal and the experimental powder X-ray pattern is from a powder sample.
 |
| | Fig. 4 Powder X-ray diffraction patterns of U, DMABAB and IMC. | |
3.5 Optical study
3.5.1 UV-vis absorption. The absorption spectra of all the components, namely, DMABAB, U and DMABAB–U IMC were recorded in MeOH solution at a concentration of 10 μM. DMABAB shows absorption at 250 and 339 nm due to π → π* and n → π* transitions, U shows only one peak at 267 nm with very low intensity (0.008) and IMC shows approximately the wavelengths of both components but with different intensities, where λmax (n → π*) has a lower (just half) intensity and π → π* has higher intensities (Fig. 5(a)). The intensity of the λmax (n → π*) transition of IMC decreases because the non-bonding electrons of the carboxylic group of DMABAB are involved in hydrogen bonding with the U molecule, and due to the extension of conjugation caused by hydrogen bonding intensity of the π → π* transition of IMC also increases.24
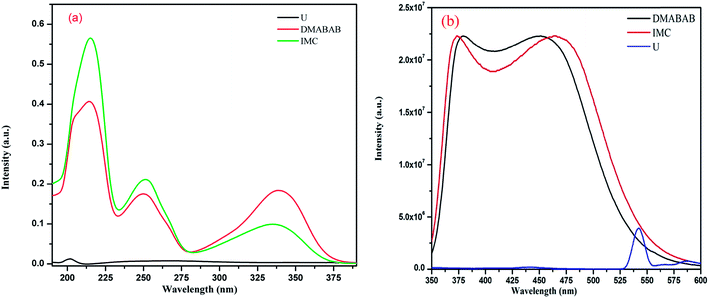 |
| | Fig. 5 (a) UV-vis absorption spectra and (b) emission spectra of U, DMABAB and IMC. | |
3.5.2 Emission spectra. DMABAB shows emission in range of 350 to 570 nm upon λmax excitation with a quantum yield of 0.49 and IMC also shows a broad emission band from 350 to 580 nm with a quantum yield of almost 1 (0.993) upon excitation at λmax absorption (300 nm) in comparison to the pyrene emission, which is more than double that of the DMABAB, and U does not show any emission (Fig. 5(b)). The increment in the quantum yield of IMC is due to the excited state intermolecular proton transfer in the two dimensional chains of the U molecules (Fig. 6).25 IMC is more rigid than its parents due to the interaction of U and DMABAB, thus the increment of rigidity is also one of the reasons for the increment in quantum yield.26
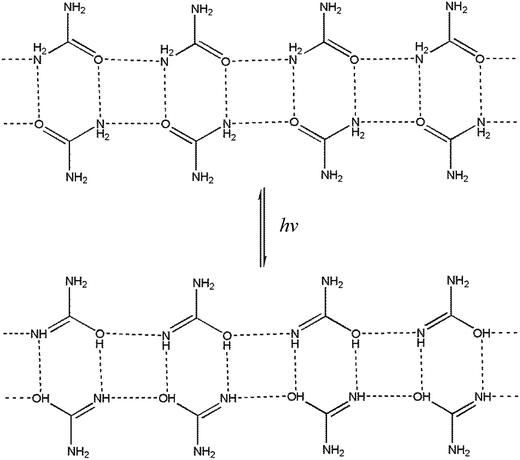 |
| | Fig. 6 Mechanism of proton transfer in the supramolecular chain of U molecules in the excited state. | |
3.6 Dielectric properties and conductivity
The dielectric constant of IMC was estimated by measuring the capacitance20 of its pellet using silver paste for electroding in the frequency range of 100 Hz to 1 MHz (see Experimental section). IMC has a high dielectric constant (ε) of approximately 300 at lower frequencies and at a temperature of 313 K, and it decreases exponentially with a decrease in frequency and increases with an increase in temperature. At 363 K and at lower frequencies, the dielectric constant (ε) is 900 (Fig. 7(a) and (b)). The variation in dielectric constant with temperature at particular frequencies is given in Fig. S2 in the ESI.† IMC exhibits a high dielectric loss (tan![[thin space (1/6-em)]](https://www.rsc.org/images/entities/char_2009.gif) δ) at a lower frequency which exponentially decreases with an increase in frequency, and with an increase in temperature the dielectric loss increases (Fig. S3(a)–(c) in the ESI†). A correlation between the dielectric properties and hydrogen-bonding behaviors of IMC is of potential importance. Hydrogen bonds within inter-molecular complexes can be properly designed to realize dynamic protonic motion which plays an important role in causing the phase transition of hydrogen-bonded dielectrics.27,28 It is clear from the single crystal XRD data of IMC that it has infinite 2D hydrogen-bonding chains, as shown in Fig. 3(a). Strong hydrogen bonds (N–H⋯O), with N–O distances less than 2.9 Å, typically exhibit a double layer proton coordinate. The dielectric responses are affected by the electrode polarization effect due to the presence of proton transfer in the material, where the accumulation of charge carriers (protons) occurs at the surfaces of the electrodes, which leads to the development of ionic double layers in these regions. Thus, the applied voltage drops rapidly in these layers, which implies a huge electrical polarization of the material and the near-absence of an electric field in the bulk sample at low frequencies. At high frequencies, the mean free path of the charge carriers tends to zero, and the effect of the electrode polarization decreases. As a result, the value of the dielectric constant decreases with frequency.29 When an electric field is applied, the dipole of structure is arranged by intramolecular charge transfer and proton transfer in the heteronuclear hydrogen bonds, which results in the formation of domains (Fig. 7(c)). In the schematic representation of a portion of the hydrogen-bonded U (or DMABAB) structure, in the array of parallel NH⋯O hydrogen-bonded chains (hexagonal box), a polar domain (interface of the hexagonal and circular boxes) results from the protons transferred in the sequence of the NH⋯O hydrogen bonded layers of U molecules (Fig. 8(a) and (b)). The polar domain regions between the DMABAB and U molecules are twisted 110.93° and 116.27°, alternately (Fig. S4 in the ESI†). The existence of these polar regions submerged in the non-polar crystal lattice is characteristic of a ferroelectric relaxer which is one of the most intensively studied electronic materials because of its extremely high dielectric constant and electrooptic properties.30,31 The conductivity is given by σ = (d/A)G, where (d/A) is the geometrical factor of IMC (d and A are the thickness and area of the pellet, respectively) used. It shows conductivity in the 10−6 S m−1 range which increases with an increase in frequency (Fig. 9(a)) and also increases with an increase in temperature (Fig. 9(b)).28,32 This is due to the intermolecular proton transfer in the infinite 2D hydrogen-bonding chains of the urea molecules (Fig. 7(c)). These conductive dielectric materials can be formed into novel electric molecular materials and can be potentially developed as dual memory devices.33 When the dipole structures are arranged by applying an electric field, the strong interactions between the dipole arrangements in the dielectric parts and the conductive electrons have the potential to induce nonlinear current–voltage characteristics.
δ) at a lower frequency which exponentially decreases with an increase in frequency, and with an increase in temperature the dielectric loss increases (Fig. S3(a)–(c) in the ESI†). A correlation between the dielectric properties and hydrogen-bonding behaviors of IMC is of potential importance. Hydrogen bonds within inter-molecular complexes can be properly designed to realize dynamic protonic motion which plays an important role in causing the phase transition of hydrogen-bonded dielectrics.27,28 It is clear from the single crystal XRD data of IMC that it has infinite 2D hydrogen-bonding chains, as shown in Fig. 3(a). Strong hydrogen bonds (N–H⋯O), with N–O distances less than 2.9 Å, typically exhibit a double layer proton coordinate. The dielectric responses are affected by the electrode polarization effect due to the presence of proton transfer in the material, where the accumulation of charge carriers (protons) occurs at the surfaces of the electrodes, which leads to the development of ionic double layers in these regions. Thus, the applied voltage drops rapidly in these layers, which implies a huge electrical polarization of the material and the near-absence of an electric field in the bulk sample at low frequencies. At high frequencies, the mean free path of the charge carriers tends to zero, and the effect of the electrode polarization decreases. As a result, the value of the dielectric constant decreases with frequency.29 When an electric field is applied, the dipole of structure is arranged by intramolecular charge transfer and proton transfer in the heteronuclear hydrogen bonds, which results in the formation of domains (Fig. 7(c)). In the schematic representation of a portion of the hydrogen-bonded U (or DMABAB) structure, in the array of parallel NH⋯O hydrogen-bonded chains (hexagonal box), a polar domain (interface of the hexagonal and circular boxes) results from the protons transferred in the sequence of the NH⋯O hydrogen bonded layers of U molecules (Fig. 8(a) and (b)). The polar domain regions between the DMABAB and U molecules are twisted 110.93° and 116.27°, alternately (Fig. S4 in the ESI†). The existence of these polar regions submerged in the non-polar crystal lattice is characteristic of a ferroelectric relaxer which is one of the most intensively studied electronic materials because of its extremely high dielectric constant and electrooptic properties.30,31 The conductivity is given by σ = (d/A)G, where (d/A) is the geometrical factor of IMC (d and A are the thickness and area of the pellet, respectively) used. It shows conductivity in the 10−6 S m−1 range which increases with an increase in frequency (Fig. 9(a)) and also increases with an increase in temperature (Fig. 9(b)).28,32 This is due to the intermolecular proton transfer in the infinite 2D hydrogen-bonding chains of the urea molecules (Fig. 7(c)). These conductive dielectric materials can be formed into novel electric molecular materials and can be potentially developed as dual memory devices.33 When the dipole structures are arranged by applying an electric field, the strong interactions between the dipole arrangements in the dielectric parts and the conductive electrons have the potential to induce nonlinear current–voltage characteristics.
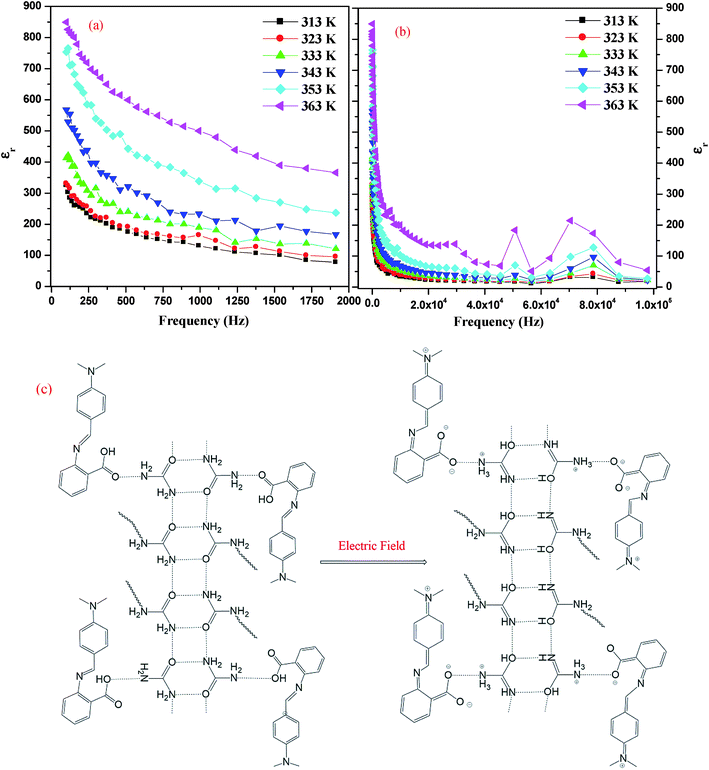 |
| | Fig. 7 Variation of dielectric constant with frequency (a) up to 2000 Hz and (b) up to 1 MHz and (c) formation of domains in the presence of an electric field. | |
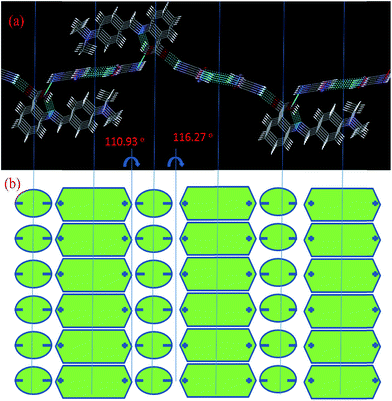 |
| | Fig. 8 Schematic representation of the formation of domains and alternative layers of U and DMABAB molecules: NH⋯O hydrogen bonded chain of U (hexagonal shape) and chains of DMABAB molecules (circular shape). | |
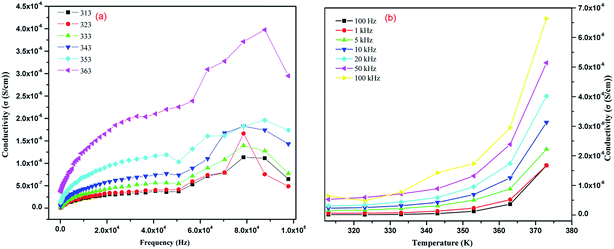 |
| | Fig. 9 Variation of conductivity (a) with frequency at a particular temperature and (b) with temperature at a particular frequency. | |
3.7 Electrochemical properties
The electrochemical behavior of DMABAB and DMABAB–U IMC were investigated via cyclic voltammetry in DMSO, as illustrated in Fig. 10(a) and (b). DMABAB shows redox behavior upon oxidation at +0.59 V and reduction at +0.48 V, which is attributed to the intramolecular charge transfer (ICT) process.34 The cyclic voltammogram of IMC exhibits two oxidation peaks, one at 0.85 V and the second reversible oxidation at −0.57 V with a reversible reduction peak at −0.63 V. The first oxidation peak is attributed to the ICT process of DMABAB, which occurs because the hydrogen bonding of the carboxylic groups with U decreases the charge density in the ring and thus shifts the reduction potentials to more positive values compared to that of DMABAB. The second reversible redox peak is due to the proton transfer reaction in the 2D hydrogen bonded chain of U molecules.35
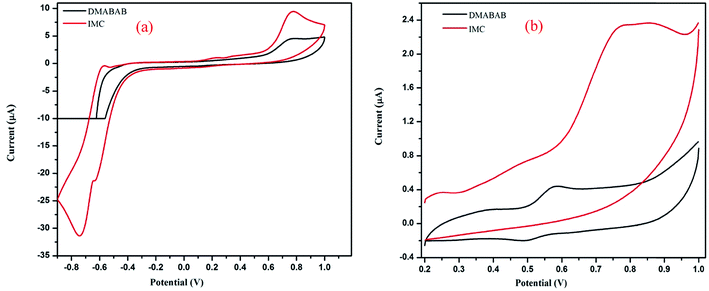 |
| | Fig. 10 Cyclic voltammograms of DMABAB and IMC. | |
3.8 Thermal properties
To evaluate the thermal stability of DMABAB–U, TGA-DTA studies were carried out and the data are given in Fig. 11(a). This technique was also used to study the decomposition products. The samples were heated from room temperature to 700 °C in a nitrogen flow at a heating rate of 10 °C min−1. As can be seen in Fig. 11(a), there are two weight loss regions: above 210 °C the molecular complex started to decarboxylate and CO2 was removed36 and above approximately 240 °C, the U molecules started to decompose,37 which were not further investigated. The DSC curve of IMC exhibits a sharp peak at 169 °C (Fig. 11(b)) which indicates the melting point of the molecular complex. The enthalpy of fusion of IMC was estimated using the DSC data, which was found to be 61.22 kJ mol−1.
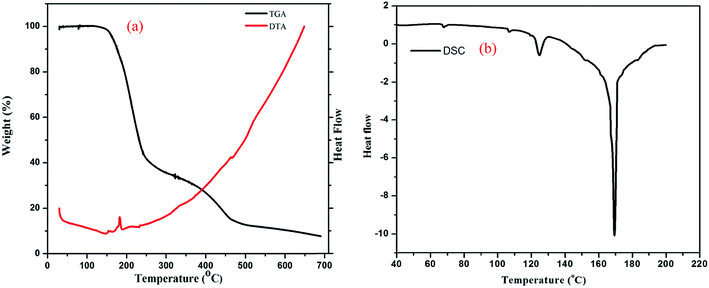 |
| | Fig. 11 (a) TGA and DTA and (b) DSC spectra of IMC. | |
4. Conclusion
The phase diagram of the DMABAB–U system was determined via the thaw-melt method. A new IMC of U and DMABAB was prepared via a green synthetic method involving a molten state reaction, which was characterized. Its overall structure was determined by the formation of an identically extended two dimensional chain of U molecules. One of the remarkable features of the structure is the coupling of two different types of cyclic hydrogen-bonded motifs alternating to form a corrugated sheet or chain of rings extending along the b axis via N–H⋯O (2.894 Å and 3.008 Å) hydrogen bonding interactions, which play a central role in the self-assembly process with the second component DMABAB molecules. IMC formed alternate parallel layers of U and DMABAB. IMC shows absorption at 250 and 339 nm due to π → π* and n → π* transitions and a broad emission band from 350 to 580 nm with a quantum yield of almost 1 (0.99) upon excitation at λmax absorption (300 nm) in methanol solvent. A huge dielectric effect (ε = 0.9 × 10³) was observed in the hydrogen-bonded IMC due to the intramolecular charge transfer and proton transfer in the heteronuclear hydrogen bonds, which leads to the formation of domains in presence of an electric field. Due to intermolecular proton transfer in the infinite 2D hydrogen-bonding chains of U molecules it also shows conductivity (∼5 × 10⁻⁶ S m−1). This conductive dielectric material can be used in novel electric molecular materials and can be potentially developed as a dual memory device. The cyclic voltammogram of IMC exhibits two oxidation peaks, one at 0.85 V and the second reversible oxidation at −0.57 V with a reversible reduction peak at −0.63 V. The melting point of IMC is 169 °C and its enthalpy of fusion is 61.22 kJ mol−1.
Acknowledgements
Authors would like to thank the Head, Department of Chemistry, Institute of Science, Banaras Hindu University, Varanasi, India for laboratory facilities.
References
- A. Alhalaweh, S. George, D. Bostrom and S. P. Velaga, 1
![[thin space (1/6-em)]](https://www.rsc.org/images/entities/char_2009.gif) :
:![[thin space (1/6-em)]](https://www.rsc.org/images/entities/char_2009.gif) 1 and 2
1 and 2![[thin space (1/6-em)]](https://www.rsc.org/images/entities/char_2009.gif) :
:![[thin space (1/6-em)]](https://www.rsc.org/images/entities/char_2009.gif) 1 Urea–Succinic Acid Cocrystals: Structural Diversity, Solution Chemistry, and Thermodynamic Stability, Cryst. Growth Des., 2010, 10, 4847–4855 CAS.
1 Urea–Succinic Acid Cocrystals: Structural Diversity, Solution Chemistry, and Thermodynamic Stability, Cryst. Growth Des., 2010, 10, 4847–4855 CAS. - R. B. Hammond, C. Ma, K. J. Roberts, P. Y. Ghi and R. K. Harris, Application of Systematic Search Methods to Studies of the Structures of Urea–Dihydroxy Benzene Cocrystals, J. Phys. Chem. B, 2003, 107, 11820–11826 CrossRef CAS.
- N. Blagden, M. de Matas, P. T. Gavan and P. York, Crystal engineering of active pharmaceutical ingredients to improve solubility and dissolution rates, Adv. Drug Delivery Rev., 2007, 59, 617–630 CrossRef CAS PubMed.
- G. R. Desiraju, Supramolecular Synthons in Crystal Engineering-A New Organic Synthesis, Angew. Chem., Int. Ed. Engl., 1995, 34, 2311–2327 CrossRef CAS.
- T. Friscic and W. Jones, Recent Advances in Understanding the Mechanism of Cocrystal Formation via Grinding, Cryst. Growth Des., 2009, 9(3), 1621–1637 CAS.
- Y. Dwivedi, S. Kant, R. N. Rai and S. B. Rai, Efficient white light generation from 2,3-diphenyl-1,2-dihydro-quinoxaline complex, Appl. Phys. B, 2010, 101, 639–642 CrossRef CAS.
- T. Henningsen, N. B. Singh, R. H. Hopkins, R. Mazelsky, F. K. Hopkins, D. O. Frazier and O. P. Singh, Growth of binary organic NLO crystals: m.Na-p.NA and m.Na-CNA systems, Mater. Lett., 1994, 20, 203–209 CrossRef CAS.
- R. N. Rai, R. S. B. Reddi and U. S. Rai, Developments and future directions of phase diagram, physicochemical and optical studies of binary organic complexes, Prog. Cryst. Growth Charact. Mater., 2013, 59, 73–11 CrossRef CAS.
- R. N. Rai and C. W. Lan, Crystal structure and properties of a new organic nonlinear optical material, J. Mater. Res., 2002, 1587–1591 CrossRef CAS.
- R. N. Rai, S. R. Mudunuri, R. S. B. Reddi, V. S. A. Kumar Satuluri, S. Ganeshmoorthy and P. K. Gupta, Crystal growth and nonlinear optical studies of m-dinitrobenzene doped urea, J. Cryst. Growth, 2011, 321, 72–77 CrossRef CAS.
- R. N. Rai, P. Ramasamy and C. W. Lan, Synthesis and crystal growth of binary organic NLO material UNBA, J. Cryst. Growth, 2002, 235, 499–504 CrossRef CAS.
- J. A. Dean, Lange's handbook of chemistry, McGraw-Hill, New York, 1985 Search PubMed.
- U. S. Rai, M. Singh and R. N. Rai, Green synthesis, characterization and some physico-chemical studies on a novel intermolecular compound; 4-nitro-o-phenylenediamine–N,N-dimethylaminobenzaldehyde system, J. Mol. Struct., 2017, 1144, 41–48 CrossRef CAS.
- M. Singh, R. N. Rai and U. S. Rai, Some Physicochemical and Thermal Studies on Organic Analog of a Nonmetal–Nonmetal Monotectic Alloy; 2-Cyanoacetamide–4-Chloronitrobenzene System, Am. J. Anal. Chem., 2011, 2, 953–961 CrossRef CAS.
- G. M. Sheldirck, Shelex-97, Program for Crystal Structure Refinement from Diffraction Data, University of Gottingen, Gottingen, 1997 Search PubMed.
- G. M. Sheldrick, Crystal structure refinement with SHELXL, Acta Crystallogr., Sect. C: Struct. Chem., 2015, 71, 3–8 CrossRef PubMed.
- L. J. Farrugia, WinGX suite for small-molecule single-crystal crystallography, J. Appl. Crystallogr., 1999, 32, 837–838 CrossRef CAS.
- C. F. Marcrae, I. J. Bruno, J. A. Chisholm, P. R. Edgington, P. McCabe, E. Pidcock, L. Rodriguez-Monge, R. Taylor, J. Streek and P. A. Wood, Mercury CSD 2.0-new features for the visualization and investigation of crystal structures, J. Appl. Crystallogr., 2008, 41, 466–470 CrossRef.
- M. Singh, P. Pandey, R. N. Rai and U. S. Rai, Solid–liquid equilibrium, thermal, and physicochemical studies on salicylamide–4-nitrophenol and 2-cyanoacetamide–4-aminoacetophenone organic eutectic systems, J. Therm. Anal. Calorim., 2013, 113, 977–983 CrossRef CAS.
- D. M. Opris, F. Nuesch, C. Lowe, M. Molberg and M. Nagel, Synthesis, Characterization, and Dielectric Properties of Phthalocyanines with Ester and Carboxylic Acid Functionalities, Chem. Mater., 2008, 20, 6889–6896 CrossRef CAS.
- M. Singh and U. S. Rai, CCDC 940623: Experimental Crystal Structure Determination, 2017, DOI:10.5517/ccdc.csd.cc10ksp1.
- V. Zavodnik, A. Stash, V. Tsirelson, R. de Vries and D. Feil CCDC 131762: Experimental Crystal Structure Determination, 2014, DOI:10.5517/cc4f3d1.
- Z. Deutsch and J. Bernstein, Cocrystal of Urea and Imidazolidone: Formation of an Unexpected 1-D Substructure in a Plausibly Predictable Cocrystal, Cryst. Growth Des., 2008, 8(10), 3537–3542 CAS.
- P. S. Kalsi, Spectroscopy of Organic Compounds, New Age Publication, India, 6th edn, 2005, pp. 1–12 Search PubMed.
- P. Naumov and Y. Ohashi, Packing-dependent photochromism: the case of photoinduced intramolecular proton transfer in 6-(2′,4′-dinitrobenzyl)-2,2′-bipyridine, Acta Crystallogr., Sect. C: Cryst. Struct. Commun., 2004, 60, 343–349 Search PubMed.
- M. Grell and D. D. C. Bradley, Polarized luminescence from oriented molecular materials, Adv. Mater., 1999, 11(11), 895–905 CrossRef CAS.
- M. Felderhoff, I. Steller, A. Reyes-Arellano, R. Boese and R. Sustmann, Cooperative proton-electron transfer in a supramolecular structure of meso-1,2-bis-(4-dimethylaminophenyl)-1,2-ethanediol and bis(4-cyanobenzylidene)ethylenediamine, Adv. Mater., 1996, 8, 402–405 CrossRef CAS.
- T. Akutagawa, T. Hasegawa, T. Nakamura, T. Inabe and G. Saito, Coupled Protonic and Electronic Conduction in the Molecular Conductor [2-(2-1H-Benzimidazolyl)-1H-benzimidazolium] ±TCNQ, Chem.–Eur. J., 2002, 8, 4402–4411 CrossRef CAS.
- P. Ben Ishai, M. S. Talary, A. Caduff, E. Levy and Y. Feldman, Electrode polarization in dielectric measurements: a review, Meas. Sci. Technol., 2013, 24, 102001 CrossRef CAS.
- M. Szafranski and A. Katrusiak, Short-Range Ferroelectric Order Induced by Proton Transfer-Mediated Ionicity, J. Phys. Chem. B, 2004, 108, 15709–15713 CrossRef CAS.
- G. A. Samara, Ferroelectricity revisited—Advances in materials and physics, Solid State Phys., 2001, 56, 239–405 CAS.
- T. Akutagawa, S. Takeda, T. Hasegawa and T. Nakamura, Proton Transfer and a Dielectric Phase Transition in the Molecular Conductor (HDABCO+)2(TCNQ)3, J. Am. Chem. Soc., 2004, 126, 291–294 CrossRef CAS PubMed.
- N. A. Hill, Why Are There So Few Magnetic Ferroelectrics?, J. Phys. Chem. B, 2000, 104, 6694–6709 CrossRef CAS.
- Y. Zhu, R. D. Champion and S. A. Jenekhe, Conjugated Donor–Acceptor Copolymer Semiconductors with Large Intramolecular Charge Transfer:
![[thin space (1/6-em)]](https://www.rsc.org/images/entities/char_2009.gif) Synthesis, Optical Properties, Electrochemistry, and Field Effect Carrier Mobility of Thienopyrazine-Based Copolymers, Macromolecules, 2006, 39, 8712–8719 CrossRef CAS.
Synthesis, Optical Properties, Electrochemistry, and Field Effect Carrier Mobility of Thienopyrazine-Based Copolymers, Macromolecules, 2006, 39, 8712–8719 CrossRef CAS. - C. Costentin, Electrochemical Approach to the Mechanistic Study of Proton-Coupled Electron Transfer, Chem. Rev., 2008, 108, 2145–2179 CrossRef CAS PubMed.
- Y. Rao and C. P. Wong, Material characterization of a high-dielectric-constant polymer–ceramic composite for embedded capacitor for RF applications, J. Appl. Polym. Sci., 2004, 92, 2228–2231 CrossRef CAS.
- P. M. Schaber, J. Colson, S. Higgins, D. Thielen, B. Anspach and J. Brauer, Thermal decomposition (pyrolysis) of urea in an open reaction vessel, Thermochim. Acta, 2004, 424, 131–142 CrossRef CAS.
Footnote |
| † Electronic supplementary information (ESI) available. CCDC 940627. For ESI and crystallographic data in CIF or other electronic format see DOI: 10.1039/c7ra03067c |
|
| This journal is © The Royal Society of Chemistry 2017 |
Click here to see how this site uses Cookies. View our privacy policy here.  Open Access Article
![[thin space (1/6-em)]](https://www.rsc.org/images/entities/h2_char_2009.gif) :
:![[thin space (1/6-em)]](https://www.rsc.org/images/entities/h2_char_2009.gif) 2 inter-molecular compound of 2-(4-(dimethylamino) benzylideneamino) benzoic acid and urea due to excited-state intramolecular proton transfer†
2 inter-molecular compound of 2-(4-(dimethylamino) benzylideneamino) benzoic acid and urea due to excited-state intramolecular proton transfer† *,
Manjeet Singh and
R. N. Rai
![[thin space (1/6-em)]](https://www.rsc.org/images/entities/char_2009.gif) :
:![[thin space (1/6-em)]](https://www.rsc.org/images/entities/char_2009.gif) 2 inter-molecular compound (IMC) with a congruent melting point of 219.0 °C, which has a high dielectric constant (ε = 0.9 × 10³) and reasonable electrical conductivity in the order ∼5 × 10⁻⁶ S m−1. This is due to the remarkable packing of U molecules in the IMC, where it shows coupling of two different types of cyclic hydrogen-bonded motifs alternating to form a corrugated sheet or chain of rings extending along the b axis via N–H⋯O hydrogen bonding interactions. In the presence of an electric field, an inter-molecular proton transfer process occurs in the NH⋯O bonds of the chain of the U molecules, which leads to disproportionate defects and the formation of polar domains on the macroscopic scale. An appropriate quantity of the IMC is synthesized via a green synthetic method, which has a monoclinic crystal system with the P21/c centrosymmetric space group. Additionally, its crystal data and hydrogen bonding parameters are determined. According to powder X-ray diffraction, spectral and thermal characterization, the eutectics are a mechanical mixture of the IMC and pure components, although the IMC behaves as a pure compound. The IMC shows a broad emission band in the range of 350 to 580 nm with a quantum yield of almost 1 (0.99) upon excitation at the λmax absorption (300 nm) in MeOH solution at a concentration of 1 × 10⁻⁵ M.
2 inter-molecular compound (IMC) with a congruent melting point of 219.0 °C, which has a high dielectric constant (ε = 0.9 × 10³) and reasonable electrical conductivity in the order ∼5 × 10⁻⁶ S m−1. This is due to the remarkable packing of U molecules in the IMC, where it shows coupling of two different types of cyclic hydrogen-bonded motifs alternating to form a corrugated sheet or chain of rings extending along the b axis via N–H⋯O hydrogen bonding interactions. In the presence of an electric field, an inter-molecular proton transfer process occurs in the NH⋯O bonds of the chain of the U molecules, which leads to disproportionate defects and the formation of polar domains on the macroscopic scale. An appropriate quantity of the IMC is synthesized via a green synthetic method, which has a monoclinic crystal system with the P21/c centrosymmetric space group. Additionally, its crystal data and hydrogen bonding parameters are determined. According to powder X-ray diffraction, spectral and thermal characterization, the eutectics are a mechanical mixture of the IMC and pure components, although the IMC behaves as a pure compound. The IMC shows a broad emission band in the range of 350 to 580 nm with a quantum yield of almost 1 (0.99) upon excitation at the λmax absorption (300 nm) in MeOH solution at a concentration of 1 × 10⁻⁵ M.![[double bond, length as m-dash]](https://www.rsc.org/images/entities/char_e001.gif) C) and 2-(4-(dimethylamino) benzylideneamino) benzoic acid (DMABAB) exists as a zwitterion. Therefore, these compounds were selected to study their eutectics and inter-molecular compounds. Their phase diagram is determined and they are characterized via X-ray diffraction and spectroscopically. Furthermore, their electrochemical, dielectric and optical behavior are studied. The arrangement of their molecules in three dimensions is also studied using a single crystal grown in a saturated solution of methanol at room temperature via the slow evaporation technique.
C) and 2-(4-(dimethylamino) benzylideneamino) benzoic acid (DMABAB) exists as a zwitterion. Therefore, these compounds were selected to study their eutectics and inter-molecular compounds. Their phase diagram is determined and they are characterized via X-ray diffraction and spectroscopically. Furthermore, their electrochemical, dielectric and optical behavior are studied. The arrangement of their molecules in three dimensions is also studied using a single crystal grown in a saturated solution of methanol at room temperature via the slow evaporation technique.![[thin space (1/6-em)]](https://www.rsc.org/images/entities/char_2009.gif) :
:![[thin space (1/6-em)]](https://www.rsc.org/images/entities/char_2009.gif) 1 molar ratio in a test tube and heating them to their melting points in a silicon oil bath. The mixture was then homogenized by repeating the process of melting followed by chilling in an ice bath 4 times.13 The as formed product was removed from the test tube and ground in a pestle and mortar was and then purified by repeated crystallization from analytical reagent grade methanol. It was then characterized via X-ray diffraction, FTIR, NMR and thermal methods.
1 molar ratio in a test tube and heating them to their melting points in a silicon oil bath. The mixture was then homogenized by repeating the process of melting followed by chilling in an ice bath 4 times.13 The as formed product was removed from the test tube and ground in a pestle and mortar was and then purified by repeated crystallization from analytical reagent grade methanol. It was then characterized via X-ray diffraction, FTIR, NMR and thermal methods.
![[thin space (1/6-em)]](https://www.rsc.org/images/entities/char_2009.gif) :
:![[thin space (1/6-em)]](https://www.rsc.org/images/entities/char_2009.gif) 2 inter-molecular compound with 0.01, 0.86 and 0.33 mole fraction of DMABAB, respectively. This inter-molecular compound has a congruent melting point (mp 219.0 °C). At this temperature the equilibrium is expressed as
2 inter-molecular compound with 0.01, 0.86 and 0.33 mole fraction of DMABAB, respectively. This inter-molecular compound has a congruent melting point (mp 219.0 °C). At this temperature the equilibrium is expressed as![[double bond, length as m-dash]](https://www.rsc.org/images/entities/char_e001.gif) O and imine groups (–C
O and imine groups (–C![[double bond, length as m-dash]](https://www.rsc.org/images/entities/char_e001.gif) N–), respectively. The shift observed in the O–H and C
N–), respectively. The shift observed in the O–H and C![[double bond, length as m-dash]](https://www.rsc.org/images/entities/char_e001.gif) O and imine groups (3183, 1666 and 1591 cm−l, respectively) in the spectrum of the IMC is due to hydrogen bonding. The other peak centered at 1606 cm−l is ascribed to the hydrogen bonded carbonyl group of the U molecules.
O and imine groups (3183, 1666 and 1591 cm−l, respectively) in the spectrum of the IMC is due to hydrogen bonding. The other peak centered at 1606 cm−l is ascribed to the hydrogen bonded carbonyl group of the U molecules.
![[thin space (1/6-em)]](https://www.rsc.org/images/entities/char_2009.gif) :
:![[thin space (1/6-em)]](https://www.rsc.org/images/entities/char_2009.gif) 2 inter-molecular compound is presented in Table 1. This molecule shows supramolecular synthonic interactions. The IMC can be described as a supramolecular macrocycle in which two DMABAB and four U molecules are joined by alternate N–H⋯O hydrogen bonding interactions (supramolecular synthon III) (Fig. 2(c)). One of the remarkable features of this structure is the coupling of two different types of cyclic hydrogen-bonded motifs (supramolecular synthon I and II) alternating to form layers along the b axis via N–H⋯O (2.894 Å and 3.008 Å) hydrogen bonding interactions (Fig. 3(a)). These layers lie in the ac plane where they play a central role in the self-assembly process. The motifs are composed of urea molecules alone arranged in the plane of the array, which are described in Fig. 3(a) as supramolecular synthon rings I and II, and can be described as a supramolecular synthon I–II chain similar to the finding of Zvicka Deutsch and Joel Bernstein.23 All the hydrogen bonding possibilities of urea are utilized in the formation of a 2D planar sheet through strong hydrogen bonds, which further stacks one over the other in the third dimension. The crystal structure analysis reveals that the molecules in the crystal structure form alternate parallel layers of DMABAB and U (Fig. 3(b)) and the space filing structure of alternate layers of U and DMABAB molecules with symmetry equivalence of both layers is given in Fig. 3(c). The distance between two U layers is 9.140 Å and in between these two layers one layer of DMABAB chain stays alive. In the DMABAB molecular layer every alternate molecule is bonded with different U molecule layers (Fig. 3(b)). The main bonding parameters are summarized in Table S1 in the ESI† and all the hydrogen bonding parameters are tabulated in Table 2.
2 inter-molecular compound is presented in Table 1. This molecule shows supramolecular synthonic interactions. The IMC can be described as a supramolecular macrocycle in which two DMABAB and four U molecules are joined by alternate N–H⋯O hydrogen bonding interactions (supramolecular synthon III) (Fig. 2(c)). One of the remarkable features of this structure is the coupling of two different types of cyclic hydrogen-bonded motifs (supramolecular synthon I and II) alternating to form layers along the b axis via N–H⋯O (2.894 Å and 3.008 Å) hydrogen bonding interactions (Fig. 3(a)). These layers lie in the ac plane where they play a central role in the self-assembly process. The motifs are composed of urea molecules alone arranged in the plane of the array, which are described in Fig. 3(a) as supramolecular synthon rings I and II, and can be described as a supramolecular synthon I–II chain similar to the finding of Zvicka Deutsch and Joel Bernstein.23 All the hydrogen bonding possibilities of urea are utilized in the formation of a 2D planar sheet through strong hydrogen bonds, which further stacks one over the other in the third dimension. The crystal structure analysis reveals that the molecules in the crystal structure form alternate parallel layers of DMABAB and U (Fig. 3(b)) and the space filing structure of alternate layers of U and DMABAB molecules with symmetry equivalence of both layers is given in Fig. 3(c). The distance between two U layers is 9.140 Å and in between these two layers one layer of DMABAB chain stays alive. In the DMABAB molecular layer every alternate molecule is bonded with different U molecule layers (Fig. 3(b)). The main bonding parameters are summarized in Table S1 in the ESI† and all the hydrogen bonding parameters are tabulated in Table 2.

![[thin space (1/6-em)]](https://www.rsc.org/images/entities/char_2009.gif) 332
332
![[thin space (1/6-em)]](https://www.rsc.org/images/entities/char_2009.gif) δ) at a lower frequency which exponentially decreases with an increase in frequency, and with an increase in temperature the dielectric loss increases (Fig. S3(a)–(c) in the ESI†). A correlation between the dielectric properties and hydrogen-bonding behaviors of IMC is of potential importance. Hydrogen bonds within inter-molecular complexes can be properly designed to realize dynamic protonic motion which plays an important role in causing the phase transition of hydrogen-bonded dielectrics.27,28 It is clear from the single crystal XRD data of IMC that it has infinite 2D hydrogen-bonding chains, as shown in Fig. 3(a). Strong hydrogen bonds (N–H⋯O), with N–O distances less than 2.9 Å, typically exhibit a double layer proton coordinate. The dielectric responses are affected by the electrode polarization effect due to the presence of proton transfer in the material, where the accumulation of charge carriers (protons) occurs at the surfaces of the electrodes, which leads to the development of ionic double layers in these regions. Thus, the applied voltage drops rapidly in these layers, which implies a huge electrical polarization of the material and the near-absence of an electric field in the bulk sample at low frequencies. At high frequencies, the mean free path of the charge carriers tends to zero, and the effect of the electrode polarization decreases. As a result, the value of the dielectric constant decreases with frequency.29 When an electric field is applied, the dipole of structure is arranged by intramolecular charge transfer and proton transfer in the heteronuclear hydrogen bonds, which results in the formation of domains (Fig. 7(c)). In the schematic representation of a portion of the hydrogen-bonded U (or DMABAB) structure, in the array of parallel NH⋯O hydrogen-bonded chains (hexagonal box), a polar domain (interface of the hexagonal and circular boxes) results from the protons transferred in the sequence of the NH⋯O hydrogen bonded layers of U molecules (Fig. 8(a) and (b)). The polar domain regions between the DMABAB and U molecules are twisted 110.93° and 116.27°, alternately (Fig. S4 in the ESI†). The existence of these polar regions submerged in the non-polar crystal lattice is characteristic of a ferroelectric relaxer which is one of the most intensively studied electronic materials because of its extremely high dielectric constant and electrooptic properties.30,31 The conductivity is given by σ = (d/A)G, where (d/A) is the geometrical factor of IMC (d and A are the thickness and area of the pellet, respectively) used. It shows conductivity in the 10−6 S m−1 range which increases with an increase in frequency (Fig. 9(a)) and also increases with an increase in temperature (Fig. 9(b)).28,32 This is due to the intermolecular proton transfer in the infinite 2D hydrogen-bonding chains of the urea molecules (Fig. 7(c)). These conductive dielectric materials can be formed into novel electric molecular materials and can be potentially developed as dual memory devices.33 When the dipole structures are arranged by applying an electric field, the strong interactions between the dipole arrangements in the dielectric parts and the conductive electrons have the potential to induce nonlinear current–voltage characteristics.
δ) at a lower frequency which exponentially decreases with an increase in frequency, and with an increase in temperature the dielectric loss increases (Fig. S3(a)–(c) in the ESI†). A correlation between the dielectric properties and hydrogen-bonding behaviors of IMC is of potential importance. Hydrogen bonds within inter-molecular complexes can be properly designed to realize dynamic protonic motion which plays an important role in causing the phase transition of hydrogen-bonded dielectrics.27,28 It is clear from the single crystal XRD data of IMC that it has infinite 2D hydrogen-bonding chains, as shown in Fig. 3(a). Strong hydrogen bonds (N–H⋯O), with N–O distances less than 2.9 Å, typically exhibit a double layer proton coordinate. The dielectric responses are affected by the electrode polarization effect due to the presence of proton transfer in the material, where the accumulation of charge carriers (protons) occurs at the surfaces of the electrodes, which leads to the development of ionic double layers in these regions. Thus, the applied voltage drops rapidly in these layers, which implies a huge electrical polarization of the material and the near-absence of an electric field in the bulk sample at low frequencies. At high frequencies, the mean free path of the charge carriers tends to zero, and the effect of the electrode polarization decreases. As a result, the value of the dielectric constant decreases with frequency.29 When an electric field is applied, the dipole of structure is arranged by intramolecular charge transfer and proton transfer in the heteronuclear hydrogen bonds, which results in the formation of domains (Fig. 7(c)). In the schematic representation of a portion of the hydrogen-bonded U (or DMABAB) structure, in the array of parallel NH⋯O hydrogen-bonded chains (hexagonal box), a polar domain (interface of the hexagonal and circular boxes) results from the protons transferred in the sequence of the NH⋯O hydrogen bonded layers of U molecules (Fig. 8(a) and (b)). The polar domain regions between the DMABAB and U molecules are twisted 110.93° and 116.27°, alternately (Fig. S4 in the ESI†). The existence of these polar regions submerged in the non-polar crystal lattice is characteristic of a ferroelectric relaxer which is one of the most intensively studied electronic materials because of its extremely high dielectric constant and electrooptic properties.30,31 The conductivity is given by σ = (d/A)G, where (d/A) is the geometrical factor of IMC (d and A are the thickness and area of the pellet, respectively) used. It shows conductivity in the 10−6 S m−1 range which increases with an increase in frequency (Fig. 9(a)) and also increases with an increase in temperature (Fig. 9(b)).28,32 This is due to the intermolecular proton transfer in the infinite 2D hydrogen-bonding chains of the urea molecules (Fig. 7(c)). These conductive dielectric materials can be formed into novel electric molecular materials and can be potentially developed as dual memory devices.33 When the dipole structures are arranged by applying an electric field, the strong interactions between the dipole arrangements in the dielectric parts and the conductive electrons have the potential to induce nonlinear current–voltage characteristics.


![[thin space (1/6-em)]](https://www.rsc.org/images/entities/char_2009.gif) :
:![[thin space (1/6-em)]](https://www.rsc.org/images/entities/char_2009.gif) 1 and 2
1 and 2![[thin space (1/6-em)]](https://www.rsc.org/images/entities/char_2009.gif) :
:![[thin space (1/6-em)]](https://www.rsc.org/images/entities/char_2009.gif) 1 Urea–Succinic Acid Cocrystals: Structural Diversity, Solution Chemistry, and Thermodynamic Stability, Cryst. Growth Des., 2010, 10, 4847–4855 CAS.
1 Urea–Succinic Acid Cocrystals: Structural Diversity, Solution Chemistry, and Thermodynamic Stability, Cryst. Growth Des., 2010, 10, 4847–4855 CAS.![[thin space (1/6-em)]](https://www.rsc.org/images/entities/char_2009.gif) Synthesis, Optical Properties, Electrochemistry, and Field Effect Carrier Mobility of Thienopyrazine-Based Copolymers, Macromolecules, 2006, 39, 8712–8719 CrossRef CAS.
Synthesis, Optical Properties, Electrochemistry, and Field Effect Carrier Mobility of Thienopyrazine-Based Copolymers, Macromolecules, 2006, 39, 8712–8719 CrossRef CAS.


