 Open Access Article
Creative Commons Attribution 3.0 Unported Licence
Raman optical activity (ROA) and surface-enhanced ROA (SE-ROA) of (+)-(R)-methyloxirane adsorbed on a Ag20 cluster†
Xin Ren‡
ab,
Weihua Lin‡b,
Yurui Fang*c,
Fengcai Ma*a and
Jingang Wang *a
*a
aDepartment of Physics and Chemistry, Liaoning University, Shenyang, 110036, China. E-mail: mafengcai@lnu.edu.cn; jingang_wang@sau.edu.cn
bBeijing Key Laboratory for Magneto-Photoelectrical Composite and Interface Science, School of Mathematics and Physics, University of Science and Technology Beijing, Beijing 100083, China
cKey Laboratory of Materials Modification by Laser, Electron, and Ion Beams (Ministry of Education), School of Physics, Dalian University of Technology, Dalian 116024, People's Republic of China. E-mail: yrfang@dlut.edu.cn
First published on 7th July 2017
Abstract
Chirality is ubiquitous in nature and plays an important role in biochemistry because biological function is largely dependent on the handedness of chiral molecules. Methods for determining chirality essentially measure optical activity. Surface plasmons have been demonstrated to hugely enhance the optical activity of chiral molecules. As with surface-enhanced Raman spectroscopy, when chiral molecules are adsorbed on the surface of plasmonic particles, chemical enhancement of the Raman optical activity (ROA) also occurs. Herein, we studied the theoretical Raman optical activity and surface-enhanced Raman optical activity of the chiral molecule methyloxirane, compared its vibrational modes and elucidated the new vibrational modes resulting from chemical enhancement. We found that upon adsorption on the Ag20 cluster, three modes exhibited a weaker ROA (even none at all), whereas two modes exhibited a stronger ROA (which was zero without adsorption on Ag20). This was attributed to changes in the symmetry of methyloxirane upon adsorption on the Ag20 cluster. A chiral molecule adsorbed on metal particles leads to changes in the dipole moment such that the intensity of some Raman vibrational modes is enhanced, and the symmetry broken responses for the changing ROA.
1 Introduction
Chirality is ubiquitous in nature, from the macroscopic level, in galaxies, cyclones, the hands, or snails, to the molecular level, in biomolecules such as DNA, proteins, amino acids and nucleic acids.1,2 The analysis and identification of chiral molecules is very important because biological function is crucially dependent on the handedness of the chiral molecule.3 Chirality also constitutes the basis of optical components, such as waveplates used for research on basic optical phenomena, advanced quantum optics and a new generation of integrated optical circuits.4 Typical methods for the analysis of chiral molecules are circular dichroism (CD), optical rotation dispersion (ORD) and Raman optical activity (ROA), which are jointly known as optical activity methods, whereby a chiral molecule exhibits slightly different absorption responses to left-handed and right-handed circularly polarized light (LCP and RCP, respectively).1 The optical activity cross section is so small that plenty of molecules are usually needed for the analysis, and because of the even smaller Raman scattering cross section (10−31 to 10−29 cm2), the Raman optical activity cross section is even smaller by several orders of magnitude.5 Thus, for optical activity measurements, a large sample volume is usually required. In this sense, improving sensitivity is very useful and essentially necessary for the functional study of molecules in living cells and for optical nanodevice design, as only a tiny amount of target materials can be in the detection volume.As the surface plasmon field of metal nanostructures leads to such marked signal enhancement, scientists have recently endeavoured to develop chiral metal structures or meta-molecules with enhanced light–matter interactions that lead to greater optical activity.6–11 These metamaterials can match the light wavelength with objects of several nanometers, which is the basis of next-generation integrated optical components for photonics and quantum optics applications. These metamaterials can be single spherical nanoparticles with chiral patterns, nanoparticles assembled with DNA, quasi-2D structures with spiral shapes, helical twists with a 3D structure and symmetrical structures with tilted incident light.12–14 In addition, there is always a super chiral field in the vicinity of these chiral or non-chiral structures. This super chiral field is defined by the equation  15,16 and strongly enhances the OA absorption of chiral molecules. The difference is defined by Δσ = G′′+C+ − G′′−C−, where G = G′ + iG′′ is the combined electric-magnetic dipole polarizability, and C± is the chiral field for the LCP or RCP. G′′ ∝ Im[
![[u with combining right harpoon above (vector)]](https://www.rsc.org/images/entities/i_char_0075_20d1.gif) ·
·![[m with combining right harpoon above (vector)]](https://www.rsc.org/images/entities/i_char_006d_20d1.gif) ] represents chirality from a pure physics perspective, which consists in the interaction between the electric and magnetic dipoles.15,17 Just like surface enhanced Raman scattering (SERS), which has been extensively investigated in the past decades, the ROA of the molecules can also be enhanced by the super chiral field generated near the surface of plasmon metal structures.18 In such system, due to the proximity of the metal to the molecules, both electromagnetic (EM) enhancement and chemical enhancement occur.19 Chemical enhancement results from changes not only in the dipole moment, but also in the ROA itself, which are due to changes in the symmetry of the molecule upon adsorption on the metal particle.
] represents chirality from a pure physics perspective, which consists in the interaction between the electric and magnetic dipoles.15,17 Just like surface enhanced Raman scattering (SERS), which has been extensively investigated in the past decades, the ROA of the molecules can also be enhanced by the super chiral field generated near the surface of plasmon metal structures.18 In such system, due to the proximity of the metal to the molecules, both electromagnetic (EM) enhancement and chemical enhancement occur.19 Chemical enhancement results from changes not only in the dipole moment, but also in the ROA itself, which are due to changes in the symmetry of the molecule upon adsorption on the metal particle.
Although many ROA experiments20–23 and theoretical studies on enhanced super chirality24–26 have been conducted with different molecules and systems, the chemical enhancement of the ROA has not been studied. Recently, the SE-ROA of other chiral molecules has been extensively explored in experimental and theoretical studies,31–34 but not for (+)-(R)-methyloxirane. In this study, the ROA of chiral (+)-(R)-methyloxirane was experimentally measured and calculated. This molecule was selected because of its suitable size for a detailed theoretical analysis of its vibrational ROA27–30 and useful for chemical products, which allowed us to obtain a clear picture of ROA polarizability.28 Thus, the (+)-(R)-methyloxirane-Ag20 represents a very good system to reveal how chemical enhancement affects SE-ROA.
In this work, we selected (+)-(R)-methyloxirane as our target system, and the chemical structures of the isolated and adsorbed molecule are shown in Fig. 1. The ROA and SE-ROA were analysed through theoretical studies of the different vibrational modes of the SERS spectra. It was observed that upon adsorption on the Ag20 cluster, three vibrational modes exhibited a weaker ROA (even disappeared), and two modes displayed a stronger ROA (which was zero without adsorption on Ag20). These spectral changes can be explained by the Ag20 cluster changing the symmetry of (+)-(R)-methyloxirane. This phenomenon constitutes the basis for surface-enhanced Raman optical activity, which is regarded as an essential technique to detect the weak ROA signal of chiral molecules. It should be noted that SE-ROA measurements are very problematic due to hot spot instabilities and the difficulty to record mirror-image SEROA spectra for enantiomers. Therefore, these calculations are not applicable to SERS in general, but only to the particular model of the (+)-(R)-methyloxirane molecule bound to the Ag20 cluster.
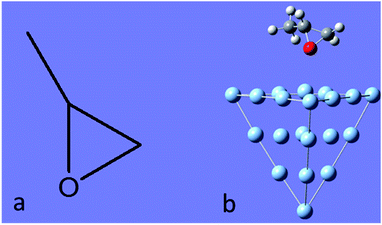 | ||
| Fig. 1 (a) Molecular structure of (+)-(R)-methyloxirane, and (b) methyloxirane adsorbed on a Ag20 cluster. | ||
2 Methods
The Raman and ROA spectra of (+)-(R)-methyloxirane had been previously reported.31 The Raman and ROA spectra of (+)-(R)-methyloxirane (100 μL) were acquired using a backscattering SCP Biotools μ-ChiralRAMAN-2X instrument fitted with a 532 nm laser and a power of 300 mW. The total acquisition time was 4 h.All quantum chemical calculations were conducted with the Gaussian 09 suite program.35 The molecular structure of (+)-(R)-methyloxirane is shown in Fig. 1a. The Raman and ROA spectra of (+)-(R)-methyloxirane were calculated based on its optimized geometry by density functional theory (DFT)36 using the B3PW91 functional with the 6-31G(D) basis set at zero frequency and 632.8 nm, respectively. The SE-ROA and SERS calculations were based on methyloxirane adsorbed on a Ag20 cluster (Fig. 1b). Ag20 had been previously used as a SERS substrate in theoretical calculations.37,38 The ground state was optimized by DFT using the PW91PW91 functional with the 6-31G(D) basis set for C, O, and H, and the LANL2DZ basis set39 for Ag. With the optimized ground state geometry, the SERS and SE-ROA spectra were also simulated by DFT using the B3PW91 functional with the 6-31G(D) basis set at zero frequency and 632.8 nm, respectively. Therefore, these calculations are not applicable to SERS in general, but only to the particular model of the (+)-(R)-methyloxirane molecule bound to the Ag20 cluster.
3 Results and discussion
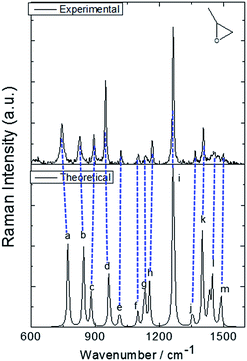
The molecular structure of isolated (+)-(R)-methyloxirane and (+)-(R)-methyloxirane adsorbed on a Ag substrate are shown in Fig. 1. Firstly, we compared the experimental Raman spectrum of (+)-(R)-methyloxirane powder, recorded with a laser of 532 nm, with the theoretically calculated Raman spectrum (Fig. 2). The results show 13 typical bands in the range of 600 to 1600 cm−1. The bands in the theoretical spectrum are in good agreement with the bands in the experimental spectrum. The experimental spectrum was acquired using a powder sample of (+)-(R)-methyloxirane, whereas the theoretical spectrum was calculated for a single molecule in the gas phase. Therefore, in the calculated spectrum, several Raman bands were somewhat shifted and the Raman relative intensities were slightly different. Fig. 3 shows the corresponding vibrational modes of the molecule for each spectral band, marked from a to m in Fig. 2. We based the analysis of the ROA on these vibrational modes.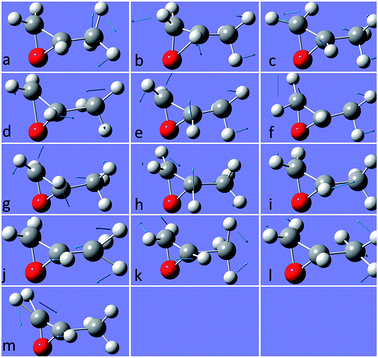 | ||
| Fig. 3 Vibrational modes of (+)-(R)-methyloxirane ascribed to the bands in the spectrum shown in Fig. 2. | ||
Fig. 4 shows the comparison of the experimental Raman, experimental ROA and theoretical ROA spectra. Firstly, we conducted the analysis without the Ag cluster so as to simplify the subsequent analysis of the SE-ROA. As seen in Fig. 4a and b, due to chirality, the Raman bands have large intensities, while the ROA bands exhibit lower intensities. Conversely, and also due to chirality, some ROA bands are more intense than the corresponding Raman bands. Wang observed bond polarizability in chiral (+)-(R)-methyloxirane whilst conducting theoretical studies on ROA.28 As seen in Fig. 4b and c, the calculated ROA spectrum is in very good agreement with the experimental one. The main bands are the same and display similar signs and intensities. Modes a, b, c, g, h, k and l have a stronger ROA intensity, while mode i, which has the strongest Raman intensity, has a weaker ROA intensity. Amongst the vibrational modes shown in Fig. 3, in mode i, symmetry is barely affected by the two vibration directions of the H atoms and in the molecule with the opposite handedness, the vibration directions are mostly the same. On the other hand, for mode a, the vibration of the three H atoms mimics a rotation, and the molecule with the opposite handedness exhibits the same rotative motion with the opposite momentum. From a pure physics perspective, molecular chirality consists in the interaction of the electric and magnetic dipoles, such that G′′ ∝ Im[![[u with combining right harpoon above (vector)]](https://www.rsc.org/images/entities/i_char_0075_20d1.gif) ·
·![[m with combining right harpoon above (vector)]](https://www.rsc.org/images/entities/i_char_006d_20d1.gif) ].17 From Fig. 3a we can see that the rotation of the three H atoms creates a magnetic dipole with a strong dipole moment, and there is a strong electric component in the rotation direction. This makes the
].17 From Fig. 3a we can see that the rotation of the three H atoms creates a magnetic dipole with a strong dipole moment, and there is a strong electric component in the rotation direction. This makes the ![[u with combining right harpoon above (vector)]](https://www.rsc.org/images/entities/i_char_0075_20d1.gif) ·
·![[m with combining right harpoon above (vector)]](https://www.rsc.org/images/entities/i_char_006d_20d1.gif) product quite large and therefore, the corresponding ROA band is quite intense. The two modes analysed above were the modes with the most obvious differences. The other modes can be analyzed in the same way, just decomposing the vibrations into a total electric direction and a rotating magnetic direction.
product quite large and therefore, the corresponding ROA band is quite intense. The two modes analysed above were the modes with the most obvious differences. The other modes can be analyzed in the same way, just decomposing the vibrations into a total electric direction and a rotating magnetic direction.
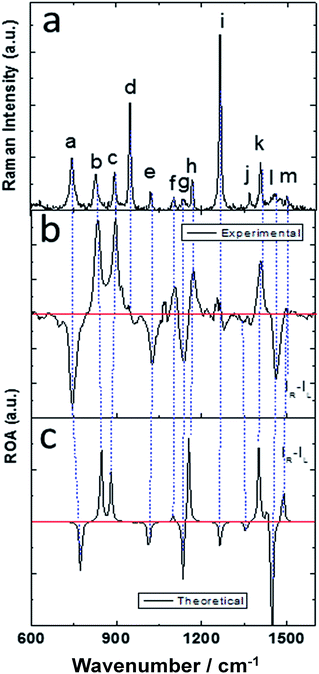 | ||
| Fig. 4 (a) Experimental Raman, (b) experimental ROA and (c) theoretical ROA spectra of (+)-(R)-methyloxirane. | ||
After this analysis, we started the study of the SE-ROA, with the molecule adsorbed on a Ag20 prism cluster. From Fig. 5a we can see that for the SERS spectrum of (+)-(R)-methyloxirane, there is one additional band at about 1550 cm−1, with respect to the SE-ROA spectrum. The other bands are similar, just with band b being stronger and band i being weaker, due to charge transfer. This phenomenon is known as chemical enhancement. As seen in Fig. 5b, in the SE-ROA spectrum, three bands are absent (or show a very weak intensity with opposite sign) with respect to the ROA spectrum. These are band c (marked with a red line), and bands h and n (marked with a green line). The disappearance of the c, g and k bands in the ROA spectrum (with respect to the SE-ROA spectrum) was attributed to: (1) charge transfer between the molecule and the Ag20 cluster, where 0.06 electrons are transferred from the molecule to the Ag20 cluster. The detailed charge distribution on each atom of the molecule can be seen in Fig. 6, and most of the electrons transferred to the substrate come from the O atom. (2) when the molecule is adsorbed on the substrate, it adopts a new symmetry (Fig. 7). Note that in Fig. 7, the Ag20 cluster is not shown to allow a better display of the SE-ROA vibrational modes. The SE-ROA vibrational modes for (+)-(R)-methyloxirane adsorbed on the Ag20 cluster can be found in the ESI.† Fig. 6 shows all of the SE-ROA vibrational modes of the new system with Ag20 cluster. The configuration of (+)-(R)-methyloxirane changes upon adsorption onto the Ag20 cluster. Thus, for mode c (Fig. 7c), the positions of the atoms are slightly different from those in the isolated molecule (Fig. 3c), and the directions of the vibrations are different. Furthermore, because symmetry is also different for the molecule adsorbed on the Ag20 cluster, the ROA band corresponding to mode c displays the opposite sign. For vibrational modes h and n, due to adsorption on Ag20, the atoms exhibit new degrees of freedom, and these modes are different for the structure with the opposite handedness, so the SE-ROA spectrum displays new bands. It should be noted that SEROA measurements are very problematic due to hot spot instabilities and the difficulty to record the SEROA spectra of mirror-image enantiomers. Therefore, these calculations are not applicable to SERS in general, but only to the particular model of the (+)-(R)-methyloxirane molecule bound to Ag20.
 | ||
| Fig. 5 (a) Calculated SE-ROA and SERS spectra of (+)-(R)-methyloxirane; (b) calculated SE-ROA and ROA spectra of (+)-(R)-methyloxirane. | ||
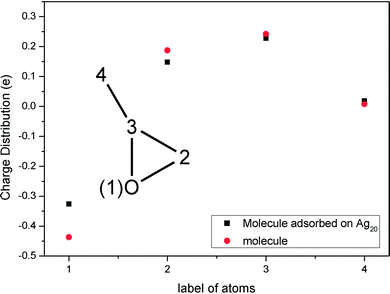 | ||
| Fig. 6 Charge distribution of the isolated (+)-(R)-methyloxirane molecule and the (+)-(R)-methyloxirane molecule adsorbed on Ag20. | ||
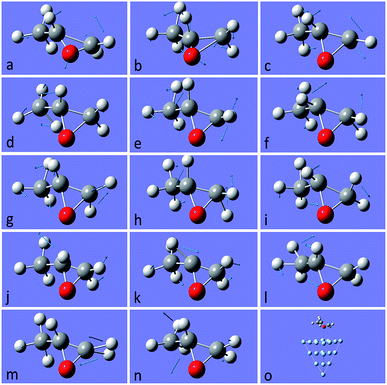 | ||
| Fig. 7 Vibrational modes of (+)-(R)-methyloxirane adsorbed on Ag20, ascribed to the bands of the spectrum shown in Fig. 5. The last picture shows the whole model with (+)-(R)-methyloxirane adsorbed on the Ag20 cluster. The SE-ROA vibrational modes of (+)-(R)-methyloxirane adsorbed on the Ag20 cluster can be seen in the ESI.† | ||
4 Conclusions
We conducted theoretical studies of the Raman optical activity and surface enhanced Raman optical activity of chiral (+)-(R)-methyloxirane, compared their vibrational modes and elucidated the new vibrational modes based on the chemical enhancement. We found that upon adsorption on a Ag20 cluster, three vibrational modes exhibited a weaker ROA (even disappeared), whereas two modes exhibited a stronger ROA (which was zero without adsorption on Ag20). This was attributed to the fact that adsorption on the Ag20 cluster changes the symmetry of the chiral molecule. This result was helpful for the SE-ROA experiment, which is regarded as an essential technique to detect the weak ROA signal of chiral molecules. In the future, SE-ROA may be detected on a G-SERS substrate or on a SERS substrate covered with two-dimensional (2D) materials to avoid chemical bonding between the chiral molecule and the metal substrate.40–45 It must be noted that SEROA measurements are very problematic due to hot spot instabilities and the difficulty to record the SEROA spectra for mirror-image enantiomers. Therefore, these calculations are not applicable to SERS in general, but only to the particular model of the (+)-(R)-methyloxirane molecule bound to the Ag20 cluster. Also, the SERS spectrum was simulated for the molecule adsorbed on the Ag20 cluster.37,38,46–50Acknowledgements
This work was supported by the National Natural Science Foundation of China (Grant No. 11274149, 11374353, 91436102 and 11474141), the National Basic Research Program of China (2016YFA02008000) and the Fundamental Research Funds for the Central Universities (DUT16RC(3)111).References
- L. D. Barron, Pure Appl. Chem., 2004, 57, 215–223 Search PubMed.
- M. Novotny and G. J. Kleywegt, J. Mol. Biol., 2005, 347, 231–241 CrossRef CAS PubMed.
- E. L. Izake, J. Pharm. Sci., 2007, 96, 1659–1676 CrossRef CAS PubMed.
- L. Du, S. S. Kou, E. Balaur, J. J. Cadusch, A. Roberts, B. Abbey, X. C. Yuan, D. Tang and J. Lin, Nat. Commun., 2015, 6, 10051 CrossRef CAS PubMed.
- W. Hug, Encyclopedia of Spectroscopy & Spectrometry, 1999, pp. 1966–1976 Search PubMed.
- E. Plum, V. A. Fedotov and N. I. Zheludev, Appl. Phys. Lett., 2008, 93, 191911 CrossRef.
- A. Kuzyk, R. Schreiber, Z. Fan, G. Pardatscher, E. M. Roller, A. Högele, F. C. Simmel, A. O. Govorov and T. Liedl, Nature, 2011, 483, 311–314 CrossRef PubMed.
- V. K. Valev, J. J. Baumberg, C. Sibilia and T. Verbiest, Adv. Mater., 2013, 25, 2517–2534 CrossRef CAS PubMed.
- S. Yoo and Q. H. Park, Phys. Rev. Lett., 2015, 114, 203003 CrossRef PubMed.
- X. Tian, Y. Fang and B. Zhang, ACS Photonics, 2014, 1, 1156–1164 CrossRef CAS.
- L. Hu, X. Tian, Y. Huang, L. Fang and Y. Fang, Nanoscale, 2016, 8, 3720–3728 RSC.
- P. Kühler, E. M. Roller, R. Schreiber, T. Liedl, T. Lohmüller and J. Feldmann, Nano Lett., 2014, 14, 2914–2919 CrossRef PubMed.
- M. Esposito, V. Tasco, F. Todisco, M. Cuscunà, A. Benedetti, D. Sanvitto and A. Passaseo, Nat. Commun., 2015, 6, 6484 CrossRef CAS PubMed.
- A. S. Schwanecke, A. Krasavin, D. M. Bagnall, A. Potts, A. V. Zayats and N. I. Zheludev, Phys. Rev. Lett., 2003, 91, 247404 CrossRef CAS PubMed.
- Y. Tang and A. E. Cohen, Phys. Rev. Lett., 2010, 104, 163901 CrossRef PubMed.
- D. M. Lipkin, J. Math. Phys., 1964, 5, 696–700 CrossRef.
- A. O. Govorov and Z. Fan, ChemPhysChem, 2012, 13, 2551–2560 CrossRef CAS PubMed.
- A. Garciaetxarri and J. A. Dionne, Phys. Rev. B: Condens. Matter Mater. Phys., 2013, 87, 235409 CrossRef.
- P. Kambhampati, C. M. Child, M. C. Foster and A. Campion, J. Chem. Phys., 1998, 108, 5013–5026 CrossRef CAS.
- S. Abdali and E. W. Blanch, Chem. Soc. Rev., 2008, 37, 980–992 RSC.
- L. Chuntonov and G. Haran, MRS Bull., 2013, 38, 642–647 CrossRef CAS.
- C. Johannessen and S. Abdali, Spectroscopy, 2007, 21, 143–149 CrossRef CAS.
- H. Kneipp, J. Kneipp and K. Kneipp, Anal. Chem., 2006, 78, 1363–1366 CrossRef CAS PubMed.
- E. Hendry, T. Carpy, J. Johnston, M. Popland, R. V. Mikhaylovskiy, A. J. Lapthorn, S. M. Kelly, L. D. Barron, N. Gadegaard and M. Kadodwala, Nat. Nanotechnol., 2010, 5, 783–787 CrossRef CAS PubMed.
- R. Ogier, Y. Fang, M. Käll and M. Svedendahl, Phys. Rev. X, 2015, 5, 041019 Search PubMed.
- X. Tian, Y. Fang and M. Sun, Sci. Rep., 2015, 5, 17534 CrossRef CAS PubMed.
- J. Šebestík and P. Bouř, J. Phys. Chem. Lett., 2011, 2, 498–502 CrossRef.
- P. Wang, Y. Fang and G. Wu, J. Raman Spectrosc., 2011, 42, 186–191 CrossRef CAS.
- L. Jensen, J. Autschbach, M. Krykunov and G. C. Schatz, J. Chem. Phys., 2007, 127, 134101 CrossRef CAS PubMed.
- L. D. Barron and P. L. Polavarapu, Mol. Phys., 1988, 65, 659–667 CrossRef CAS.
- M. Sun, Z. Zhang, P. Wang, Q. Li, F. Ma and H. Xu, Light: Sci. Appl., 2013, 2, e112 CrossRef CAS.
- D. V. Chulhai and L. Jensen, J. Phys. Chem. A, 2014, 118, 9069–9079 CrossRef CAS PubMed.
- T. Wu, X. Zhang, R. Wang and X. Zhang, J. Phys. Chem. C, 2016, 120, 14795–14804 CAS.
- F. Krausbeck, J. Autschbach and M. Reiher, J. Phys. Chem. A, 2016, 120, 9740–9748 CrossRef CAS PubMed.
- M. J. Frisch, G. W. Trucks, H. B. Schlegel, G. E. Scuseria and M. A. Robb, et al., Gaussian 09, Revision A.02, Gaussian, Inc., Wallingford, CT, 2009 Search PubMed.
- P. Hohenberg and W. Kohn, Phys. Rev., 1964, 136, B864 CrossRef.
- L. Zhao, L. Jensen and G. C. Schatz, J. Am. Chem. Soc., 2015, 128, 2911–2919 CrossRef PubMed.
- M. Sun, S. Liu, M. Chen and H. Xu, J. Raman Spectrosc., 2009, 40, 137–143 CrossRef CAS.
- P. J. Hay and W. R. Wadt, J. Chem. Phys., 1985, 82, 270–283 CrossRef CAS.
- X. Yang, H. Yu, X. Guo, Q. Ding, T. Pullerits, R. Wang, G. Zhang, W. Liang and M. Sun, Materials Today Energy, 2017, 5, 72 CrossRef.
- Q. Ding, Y. Shi, M. Chen, X. Yang, W. Liang and M. Sun, Sci. Rep., 2016, 6, 32724 CrossRef CAS PubMed.
- Z. Zhang, S. Sheng, R. Wang and M. Sun, Anal. Chem., 2016, 88, 9328–9346 CrossRef CAS PubMed.
- P. Wang, W. Liu, W. Lin and M. Sun, J. Raman Spectrosc., 2017, 48 DOI:10.1002/jrs.5199.
- Y. R. Fang, Z. L. Zhang and M. T. Sun, Rev. Sci. Instrum., 2016, 87, 033104 CrossRef PubMed.
- M. Sun, Z. Zhang, H. Zheng and H. Xu, Sci. Rep., 2012, 2, 647 Search PubMed.
- L. L. Zhao, L. Jensen and G. C. Schatz, Nano Lett., 2006, 6, 1229 CrossRef CAS PubMed.
- M. Sun, S. Liu, M. Chen and H. Xu, J. Raman Spectrosc., 2009, 40, 1172–1177 CrossRef CAS.
- M. Sun, S. Liu, M. Chen and H. Xu, J. Raman Spectrosc., 2009, 40, 1942–1948 CrossRef CAS.
- Z. Yang, Y. Li, Z. Li, D. Wu, J. Kang, H. Xu and M. Sun, J. Chem. Phys., 2009, 130, 234705 CrossRef PubMed.
- M. Sun, Y. Fang, Z. Yang and H. Xu, Phys. Chem. Chem. Phys., 2009, 11, 9412–9419 RSC.
Footnotes |
| † Electronic supplementary information (ESI) available. See DOI: 10.1039/c7ra04949h |
| ‡ Contributed equally. |
| This journal is © The Royal Society of Chemistry 2017 |

